
 1 Registry Star
Part:BBa_J23102
constitutive promoter family member
|
|
Variant RFP (au) J23112 1 J23103 17 J23113 21 J23109 106 J23117 162 J23114 256 J23115 387 J23116 396 J23105 623 J23110 844 J23107 908 J23106 1185 J23108 1303 J23118 1429 J23111 1487 J23101 1791 J23104 1831 J23102 2179 J23100 2547 |


Constitutive promoter family
Parts J23100 through J23119 are a family of constitutive promoter parts isolated from a small combinatorial library. J23119 is the "consensus" promoter sequence and the strongest member of the family. All parts except J23119 are present in plasmid J61002. Part J23119 is present in pSB1A2. This places the RFP downstream of the promoter. Reported activities of the promoters are given as the relative fluorescence of these plasmids in strain TG1 grown in LB media to saturation. See part BBa_J61002 for details on their use.
These promoter parts can be used to tune the expression level of constitutively expressed parts. The NheI and AvrII restriction sites present within these promoter parts make them a scaffold for further modification. JCAraw
Contribution
Group: Valencia_UPV iGEM 2018
Author: Adrián Requena Gutiérrez, Carolina Ropero
Summary: We adapted the part to be able to assemble transcriptional units with the Golden Gate assembly method
Documentation:
In order to create our complete [http://2018.igem.org/Team:Valencia_UPV/Part_Collection part collection] of parts compatible with the Golden Gate assembly method, we made the part BBa_K2656005 which is this part adapted to the Golden Gate technology.
Sequence and Features
- 10COMPATIBLE WITH RFC[10]
- 12INCOMPATIBLE WITH RFC[12]Illegal NheI site found at 7
Illegal NheI site found at 30 - 21COMPATIBLE WITH RFC[21]
- 23COMPATIBLE WITH RFC[23]
- 25COMPATIBLE WITH RFC[25]
- 1000COMPATIBLE WITH RFC[1000]
Manchester 2019 Characterisation
Group: Manchester iGEM 2019
Author: Elisa Barrow, Camilo Albornoz
We wanted to add new, normalised RFU data for two promoters from the Anderson family of constitutive promoters BBa_J23102 (Strong constitutive promoter) and BBa_J23106 (weak constitutive promoter) respectively; and a T7 promoter BBa_K199118 all expressing mRFP1. Another interest that we had was to test how OD was affected by RFP production, therefore we performed our measurements twice, at OD600 and OD660 respectively. This was done because it has been shown that OD660 gives a more accurate representation of bacterial growth in RFP-producing bacteria (Hecht et al., 2016).
In order to obtain our results, we grew our cell cultures up to an OD600/660 of ~0.6. After the desired OD had been reached, cultures were induced with IPTG (for BBa_K199118) and anhydrotetracycline (for BBa_K092300). Then they were placed on a microplate reader (CLARIOstar®, BMG Labtech). The specific script conditions can be seen below. The machine was set to measure OD600/660 and RFU overnight every 15 minutes. The data was then analysed and plotted. This experiment was performed both in transformed E. coli DH5a as well as BL21.
OD600:
Discrete wavelengths, 1
Wavelength: 600
Well scan: spiral average, 5mm diameter
OD660:
Discrete wavelengths, 1
Wavelength: 660
Well scan: spiral average, 5mm diameter
RFP Fluorescence:
Focal Height: 7.5
Gain: 1000
Excitation: 574-15
Emission: 618-22
Well scan: Matrix scan 3x3 1mm diameter
RESULTS
Quantitative results:
Below are the results we obtained for the OD and fluorescence measurements of the different promoters with mRFP1. All the values were analysed by blank-correction. For OD, the blank was LB media, and for RFU, the blank was E. coli TOP10 since it does not express any colour. The values were individually normalised by dividing RFU/OD and then averaged to plot the mean against time. An RFU value of 0 corresponds to baseline E. coli TOP10 measurements.
RFU/OD600 values during overnight growth of three different promoters expressing mRFP1 in E. coli DH5⍺:

The plot shows the mean RFU/OD from three replicates of each construct expressed in E. coli DH5⍺. The OD was measured at 600 nm and RFP fluorescence was measured at Ex ƛ 574, Em ƛ 618, every 15 minutes for 13 hours. The RFU values were normalised by the OD and the triplicates averaged. All values have been blank-corrected. A total of 52 recordings were made per well, with three biological/technical replicates per construct.
RFU/OD600 values during overnight growth of three different promoters expressing mRFP1 in E. coli BL21(DE3):

The plot shows the mean RFU/OD from three replicates of each construct expressed in E. coli BL21 (DE3). The OD was measured at 600 nm and RFP fluorescence was measured at Ex ƛ 574, Em ƛ 618, every 15 minutes for 13 hours. The RFU values were normalised by the OD and the triplicates averaged. All values have been blank-corrected. A total of 52 recordings were made per well, with three wells per construct.
RFU/OD660 values during overnight growth of three different promoters expressing mRFP1 in E. coli DH5⍺:

The plot shows the mean RFU/OD from three replicates of each construct expressed in E. coli DH5⍺. The OD was measured at 660 nm and RFP fluorescence was measured at Ex ƛ 574, Em ƛ 618, every 15 minutes for 13 hours. The RFU values were normalised by the OD and the triplicates averaged. All values have been blank-corrected. A total of 52 recordings were made per well, with three wells per construct.
RFU/OD660 values during overnight growth of three different promoters expressing mRFP1 in E. coli BL21(DE3):

The plot shows the mean RFU/OD from three replicates of each construct expressed in E. coli BL21 (DE3). The OD was measured at 660 nm and RFP fluorescence was measured at Ex ƛ 574, Em ƛ 618, every 15 minutes for 13 hours. The RFU values were normalised by the OD and the triplicates averaged. All values have been blank-corrected. A total of 52 recordings were made per well, with three wells per construct.
Qualitative results:
Non-quantitative data of the iGEM-provided coloured constructs were also obtained through pelleting 5 mL of overnight induced culture at 10000 xg for 10 minutes. These pellets were then transferred to 2 mL Eppendorfs and spun at 19, 900 xg in a conventional table-top microcentrifuge and imaged as shown.

5 mL of overnight bacterial culture pellets. In both BBa_J23102 and BBa_J23106 replicates 1 and 2 were transformed into BL21(DE3) (left and centre) while replicate 3 was transformed into DH5⍺ (right). However, for BBa_K199118 all 3 biological replicates are shown in BL21(DE3). All Eppendorfs are shown under normal light (in white) and UV light (blue) for visualisation purposes only. Biological replicates of BL21(DE3) cells for T7 promoter.
These results do not visually show the difference in fluorescence between DH5⍺ and BL21(DE3). However, it is visible particularly for BBa_K199118 the difference in expression between the 3 performed biological replicates.
CONCLUSION
The normalisation of fluorescence measurements to OD showed that the constitutive promoters, as well as the T7 promoter, started with a very high fluorescence-to-OD ratio, which decreased with time and then remained constant. This means that as the bacteria kept growing, the relative fluorescence measurements increased linearly with them. The strong constitutive promoter, BBa_J23102, showed the highest fluorescence-to-OD ratio followed by the weak constitutive promoter J23106 as we would expect and lastly the T7 BBa_K199118 which showed the lowest fluorescence-to-OD values despite possessing the highest plasmid copy number. This was true in both tested E. coli strains DH5⍺ and BL21(DE3). Additionally, this trend remained true in both OD600 as well as OD660 nm.
Data between OD600 and OD660 apparently varies between the two different tested E. coli strains. In DH5⍺, measurements at 600 nm are lower than measurements at 660 nm. Compared to BL21(DE3). Therefore we can conclude that a potential false increase in apparent cell density was only significant for the BL21(DE3) strain and not in the DH5⍺. This means that in our results, measuring optical density at 660 nm was only more appropriate for E. coli BL21(DE3) cells.
In conclusion, new normalised data for mRFP1 fluorescence has been characterised for three existing parts (BBa_J23102, BBa_J23106, and BBa_K199118) and for BBa_K092300 cloned into pBbB2c. This means that the relative fluorescence units can now be compared with higher accuracy and precision across measurements and even between different laboratories.
REFERENCE
Hecht, A., Endy, D., Salit, M. and Munson, M. S. (2016) ‘When Wavelengths Collide: Bias in Cell Abundance Measurements Due to Expressed Fluorescent Proteins’, ACS Synthetic Biology. American Chemical Society, 5(9), pp. 1024–1027. doi: 10.1021/acssynbio.6b00072.
Hamburg 2019
Group: Hamburg iGEM 2019
Author: Marie-Theres Thieme, Marcel Zimmeck
We characterized the activity of the promoters we used in our project, the two constitutive promoters from the Anderson Family, BBa_J23100 and BBa_J23102. We measured the expression of GFP downstream of the promoters.
The parts were cloned into E. coli DH5α competent cells. The fluorescence measurements were performed using flow cytometry and plate reader measurements. The results of the flow cytometry measurement are shown in Figure 1.
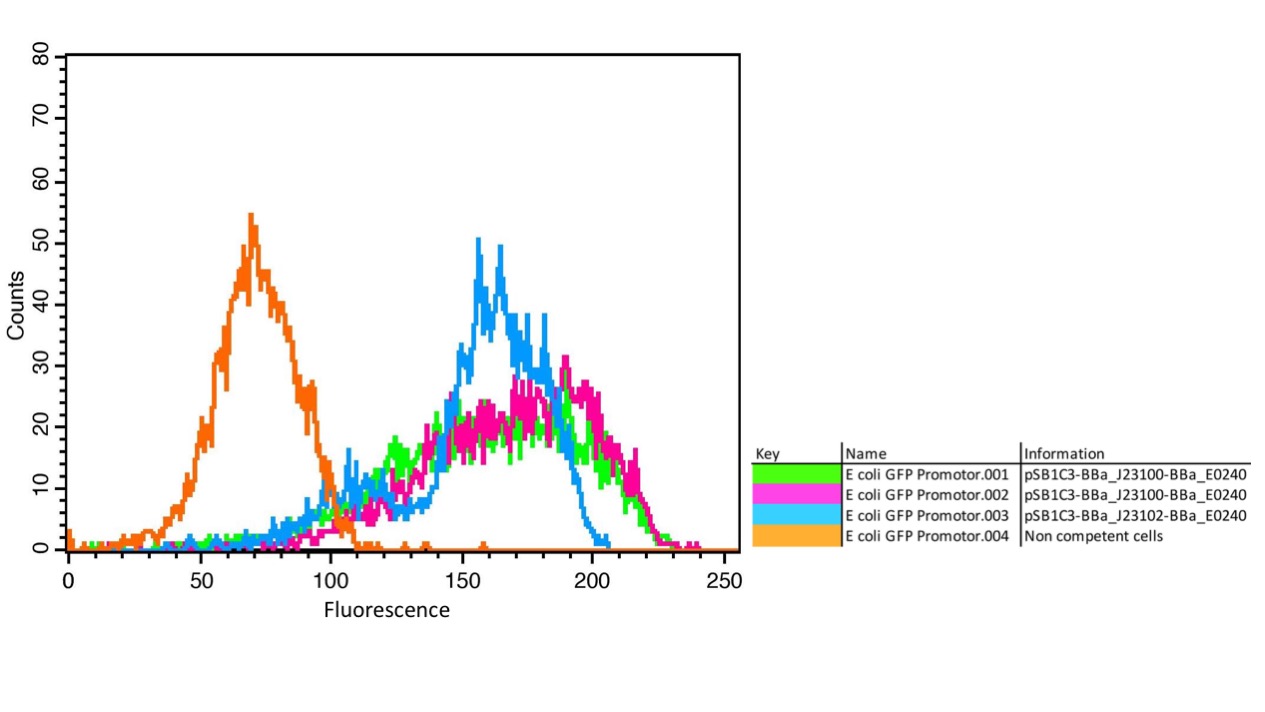
The results confirm the different strengths of the constitutive promoters. BBa_J23100 expresses a stronger fluorescence signal than BBa_J23102. As a negative control we used non-competent cells to measure background emission.
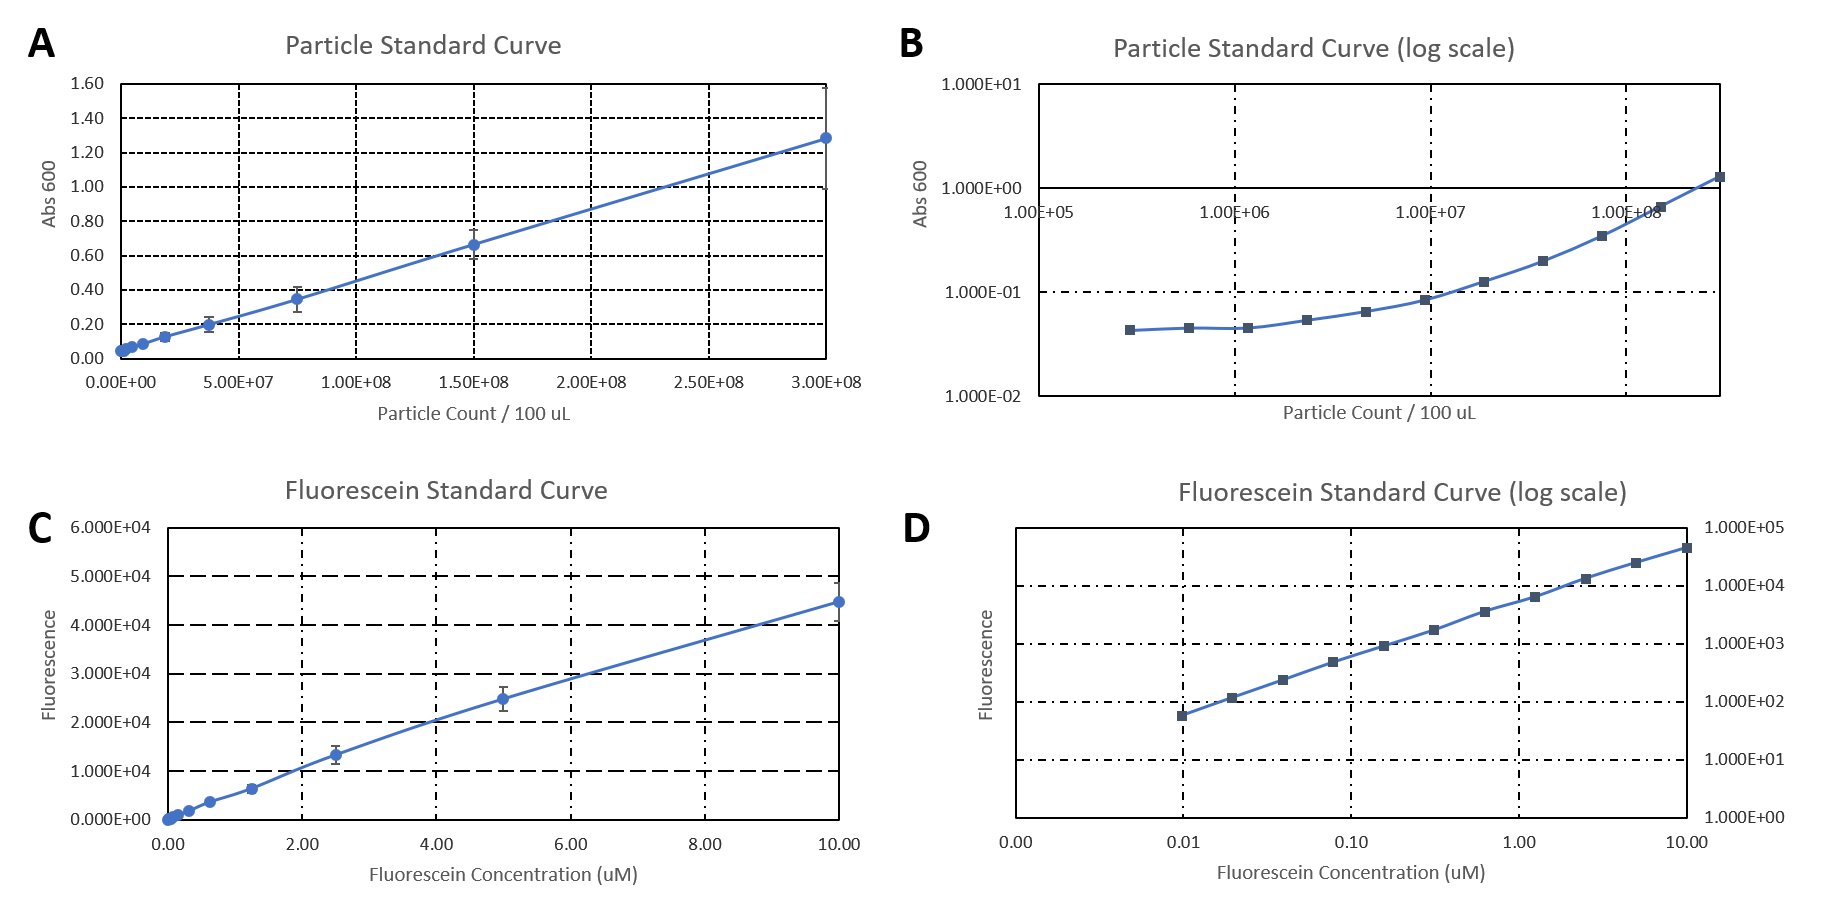
The data used to calibrate the plate reader measurements are shown in Figure 2. The results of our measurement of GFP on the plate reader are shown in Figure 3.
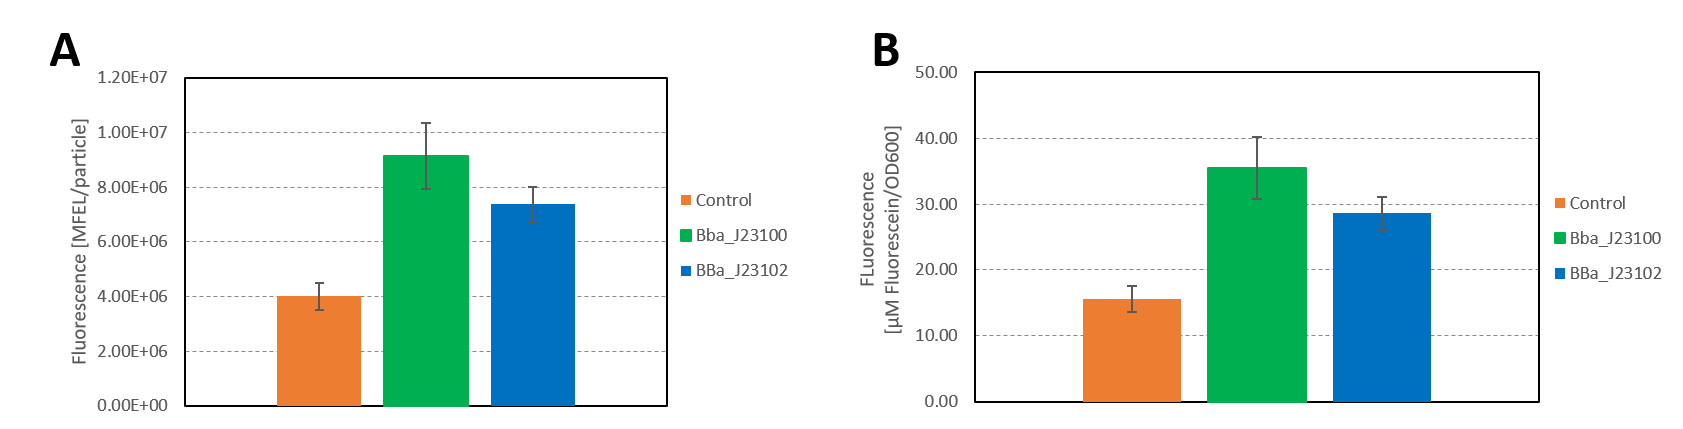
The results confirm the previous results from the FACS measurement. The promoter BBa_J23100 expresses a stronger fluorescence signal when compared to BBa_J23102.
We calculated the strengths of these promoters relative to the control:
BBa_J23100: 2.28
BBa_J23102: 1.84
The relative strength of BBa_J23102 when compared to BBa_J23100 is 0.8. In comparison, the values in the registry is 0.856.
Additionally, we sequenced the plasmids used in our measurement. The reported sequence matched the Anderson promoter BBa_J23100. The reported sequence for the promoter BBa_J23102 showed three point mutations, which could have impacted the strength of the promoter. The following mutations occurred: 6A>G, 22G>A, 27T>A. This explains the decrease in the relative promoter strength of BBa_J23100 compared to BBa_J23102.
UT Austin iGEM 2019: Characterization of metabolic burden of the Anderson Series
Description
The 2019 UT Austin iGEM team transformed the Anderson Series promoters into our 'burden monitor' DH10B strain of E. coli, which contains a constitutive GFP cassette in the genome of the cell. GFP expression fluctuates depending on the number of ribosomes available. Using this strain, we characterized the relative burden (percent reduction in growth rate) of each Anderson Series part. Our results showed a range of growth rate reductions for each of these parts due to ribosomal reallocation from the genome of the host cell, towards the expression of RFP. Anderson Series parts with strong promoters are depicted with darker red colors and Anderson Series parts with weak promoters are depicted with lighter pink colors to show relative RFP expression. We saw a positive correlation between relative promoter strength and metabolic burden; parts with stronger promoters expressed less GFP and had a lower growth rate than parts with weaker promoters. The regression line for the graph below was constructed by measuring the burden of 5 parts that were created by the 2019 UT Austin iGEM team that each contained an Anderson Series promoter (BBa_J23104 or BBa_J23110), an RBS of varying strength, and a BFP reporter. For more information on characterization of these parts through the burden monitor, visit our team’s wiki page: [1]


Importance of Characterizing Burden
Although often we cannot avoid using a specific burdensome part, knowing in advance that it is burdensome, and that it has a high chance of mutating into a non-functional genetic device, can help with troubleshooting and coming up with alternatives. In the specific case of fluorescent protein-expressing devices, Fluorescence-activated cell sorting (FACS) can be used to filter out individual cells that meet a certain fluorescence threshold. This way, the cells expressing lower levels of the fluorescent protein are weeded out of the population.
iGEM Marburg 2023 - RhizoGene
Anderson promoter characterization in Agrobacterium
Anderson promoters play a vital role in synthetic biology and have been extensively studied in traditional chassis such as E. coli. These promoters have become the standard for constitutive expression in prokaryotic organisms, anchoring numerous iGEM projects. However, their performance in less traditional prokaryotic organisms has remained largely uncharted. One of the first important experiments of our project represented the characterization of Anderson promoter collection in Agrobacterium rhizogenes strain ARqua1, the first choice for our plant transformations. In contrast to their performance in E. coli, these promoters displayed unique behavior in Agrobacterium. Some promoters that exhibited robust expression in E. coli, such as J23104, showed only modest strength in Agrobacterium. Surprisingly, J23102, not J23100 as in E. coli, emerged as the top performer, with over double the expression levels.

Figure 1: Comparison of the relative Anderson promoter strength betweenAgrobacterium and E.coli

Figure 2: Time series measurement of Anderson promoters in Agrobacterium
These findings underscore the importance of characterizing fundamental components when establishing an organism as a synthetic biology platform. Our work uncovers a new dimension of Anderson promoters in Agrobacterium, igniting fresh possibilities and solidifying our commitment to advancing plant transformation. Our findings demonstrate that well-established components can adapt effectively to new environments, providing opportunities for future plant engineers.
//direction/forward
//promoter/anderson
//regulation/constitutive
//rnap/prokaryote/ecoli/sigma70
| negative_regulators | |
| positive_regulators |