
 1 Registry Star
Part:BBa_I13521:Experience
This experience page is provided so that any user may enter their experience using this part.
Please enter
how you used this part and how it worked out.
Applications of BBa_I13521
2020 iGEM FDR-HB_Peru team has added BamHI and BgIII restriction sites surrounding the RBS to insert more RFP parts into the plasmid. This is because in our previous experiment, having more RFP genes may have increased the intensity and the rate of expression of RFP.
Applications of BBa_I13521
2011iGEM SJTU-BioX team has modified RFP to obtain a new reporter.
Applications of BBa_I13521
2013 KIT-Kyoto iGEM team assessed influence of fluorescence proteins on the growth of E.coli. We used BBa_I13521, BBa_I13522 and BBa_I13600 in order to measure the growth.

We measured the turbidities of the transformants at hourly intervals and made the growth curves. We transferred the transformant prepared to 200 mL flasks. We measured the turbidities every 1 hour. The measurements were carried out for 12 hours.
Liquid LB 50mL
Sample 20μL
Ampicillin 75μL
37°C, 125rpm
Control:HST08
As the result, it was found that eCFP and mRFP have the effect of growth promotion relative to GFP.
Applications of BBa_I13521
For parts BBa_I13521 and BBa_I13522, their excitation and emission maxima were determined. BBa_B0034 was used as a negative control. These data were used later in following characterization experiments as set parameters. The host was E. coli Top Ten in all experiments.

The graph above shows the emission scan for RFP in part BBa_I13521. Since it was the best option in terms of fluorescence yield, 570 nm was set as the excitation wavelength. As it can be seen from the graph, maximum emission wavelength is 605 nm.
Meanwhile, the graph below shows the emission scan for GFP in part BBa_I13522. Since it was the best option in terms of fluorescence yield, 395 nm was set as the excitation wavelength. As it can be seen from the graph, maximum emission wavelength is 515 nm.
For the parts BBa_I13521 and BBa_I13522 which are mentioned above, confocal laser scanning microscope images were taken in the host Top Ten.

Characterization was performed by METU-TURKEY IGEM2010 Team
Thermostability Assay
For this BioBrick, the denaturation temperature was determined by heating the protein at a range of temperatures, and then measuring the fluorescence. This is a useful characterisation as it allows the selection of an appropriate reporter gene for the required temperature.
Stock solutions of mRFP were prepared by extracting the protein from cell lysate, and then 50μl aliquots of the solution were heated in a PCR thermocycler along a temperature gradient.
After two hours, 30μl was removed from each aliquot and diluted with 170μl of 20mM Tris buffer to give 200μl samples. The fluorescence of the samples was then measured on a 96-well plate. The corresponding curve was plotted on the graph below.

Results of the heat denaturation experiment. The temperature at which half of the protein is denatured is measured by looking at its fluorescence (PTm50) mRFP1: 82.2°C; GFPmut3b: 61.6°C; Dendra2: 89.1°C; sfGFP: 75.0°C.
The sigmoidal curves that were calculated gave us the following function which also created the coefficient K which happens to relate to PTm50 (temperature at which half of the protein is denatured measured by looking at its fluorescence):

This shows that the protein denatures at around 81°C
.This characterisation was performed by the Imperial College London 2011 Team.
Applications of BBa_I13521 by iGEM 2017 SCU-China
2017iGEM SCU-China team has modified RBS to test the translation rate of new designed RBSs.
We altered the RBS sequence of Part:BBa I13521 with designed RBSs which are predicted to be stronger than Part_B0034,thus constructing Part: BBa_K2276007,Part: BBa_K2276008 and Part: BBa_K2276010. Then we engineered strains that contain Part:BBa K2276007 and measure the fluorescence intensity and OD600 changes of it. Due to the limit of the experiment condition, we measured the change at the first 8hours and 10~16 hours after inoculated separately. Here is the result.


We can see that Part: BBa_K2276007 and Part: BBa_K2276010 have much strong expression than Part: BBa_I13521, which has nothing to do with the growth discrepancy of the E.Coli. In that way we comfirmed that our designed RBS is indeed much stronger than Part: BBa_B0034.
Measure Method
1. streak the plate with Bacterial Glycerol
2. pick single clones from the plate and incubate overnight
3. 12ml tubes containing 1ml liquid LB is inoculated with the overnight cultures using a 1:100 dilution. We inoculate 9 tubes for each strain. And for each designed RBS, we have 3 strains as repeat.
4. Test the fluoresce strength every 2 hours after inoculation sampled from different tubes.
- Due to the limit of our experimental conditions, we can only perform continuous test within 8 hours.
User Reviews
UNIQ6e8c4708983d6e0d-partinfo-00000003-QINU
|
•••••
melissali |
Very visible to the naked eye (vs. CFP, YFP were not very visible without UV excitation). |
UNIQ6e8c4708983d6e0d-partinfo-00000005-QINU
UNIQ6e8c4708983d6e0d-partinfo-00000006-QINU
UNIQ6e8c4708983d6e0d-partinfo-00000007-QINU
|
•••••
UNIPV-Pavia iGEM 2011 |
NB: All tests were performed in E. coli MGZ1 in M9 supplemented medium at 37°C in low copy plasmid pSB4C5. This strain constitutively expresses TetR, so pTet promoter can be induced with aTc.
PTet promoter was assembled upstream of different mRFP coding sequences, containing an RBS from the Community collection; these are the measurement devices used:
The assembled RBSs are here reported with their declared efficiency:
For an inducible device, the RBS variation has the purpose to stretch the induction curve, thus modulating its PoPs-OUT range. The complex RBS-promoter acts as a whole regulatory element and determines the amount of translated protein. RBSs have been reported to have an un-modular behavior, since the translational efficiency is not independent on the coding sequences, but variates as an effect of different mRNA structure stability [Salis et al., Nat Biotec, 2009]. It is not possible to separate the effects of the sole promoter and of the sole RBS on the total amount/activity of gene product (in this case study, mRFP). For this reason, every combination 'Promoter+RBS' was studied as a different regulatory element. Regulatory elements were characterized using mRFP reporter protein for different RBSs in terms of Synthesis rate per Cell (Scell) and R.P.U.s (Relative Promoter Units) as explained in measurements section.
The Hill function relating the induction to the Scell is reported below: Scell=α * ( δ + (1-δ)/(1+(K/Induction)η) ) Operative parameters of the promoter are derived from the estimated Hill equations obtained by nonlinear least squares fitting (lsqnonlin Matlab routine) of the Hill function expressed in RPUs:
The protocols for the characterization of pTet promoter are reported in the pTet measurement section. The data collected from the mRFP measurement systems were processed as described in data analysis section. The induction curves were obtained by fitting a Hill function as described in modelling section and the estimated parameters for pTet are reported in the pictures and in table below. This promoter is widely studied and characterized usually using the strong RBS BBa_B0034. Here we have characterized its transcriptional strength as a function of aTc induction (ng/ml) for different RBSs. Three different induction curves were obtained and are reported in figure: 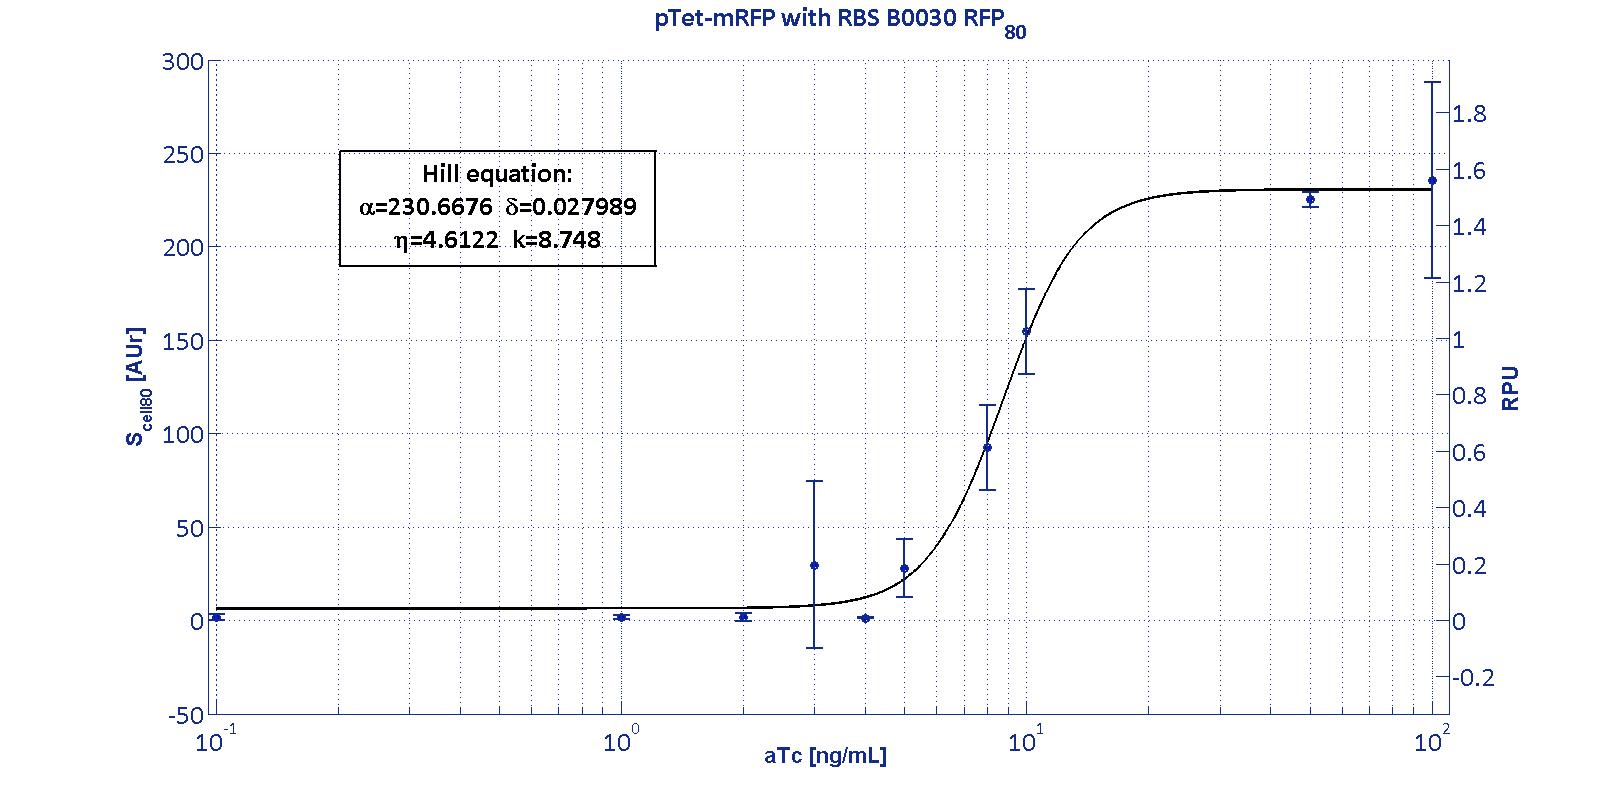
The estimated parameters of the Hill curves described in the figures are summarized in the table below:
The measurement system pTet-B0031-mRFP-TT couldn't be assayed because its fluorescence output is under the detectability threshold of our measurement instrument. For this reason, the parameters of the corresponding Hill curve couldn't be estimated and are reported as 'Not Determined' ND. α parameter (representing the maximum trascriptional rate in the studied range of induction) varies as expected with the RBS variation and also the δ and η parameters are quite different among the RBS variations. The kpTet parameter is quite constant among the RBS variations, thus suggesting that in this case the RBS variation doesn't substantially affect the switch point of the Hill curve, even if the amplitude and the maximum slope are not quite maintained (for the η parameter, maybe fitting problems). The operative parameters are summarized in the table below:
From these parameters, it is evident that whilst the switch-point is almost maintained for all the RBSs, the linear boundaries are similar for RBS30 and RBS32 but for RBS34 are moved on the right of one order of magnitude. |


UNIQ6e8c4708983d6e0d-partinfo-0000000A-QINU