Chassis/Cell-Free Systems/Commercial E.coli S30/Optimum DNA
Contents
Commercial E. coli S30
| Cell-Free Systems | Chassis description | Temperature dependence | DNA quantity dependence | Product stability | Peak time | Expression lifespan | Expression capacity |
DNA quantity dependence

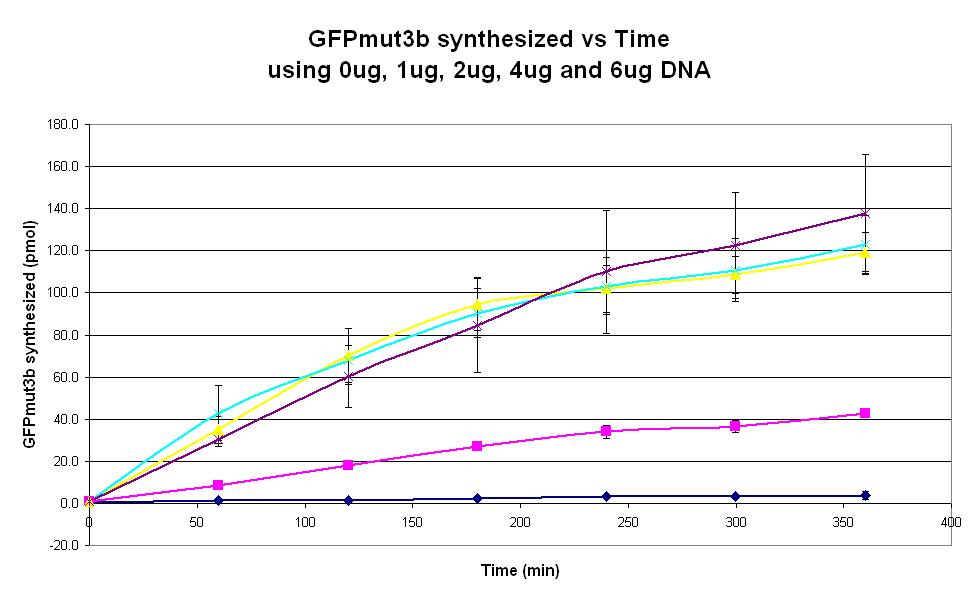
Graph 2. Graph of GFPmut3b synthesized(pmol per min) against time (minutes) using 0ug (dark blue), 1ug (pink), 2ug (yellow), 4ug (light blue) and 6ug (purple). The simple constitutive gene expression device BBa_I13522 has been used. Each of the four coloured lines show average measurements based on two replicates of the experiment. The error bars represent the standard deviation of the measurements.
Experimental protocol
Aims
- To determine the DNA quantity dependence for the commercial E. coli S30 chassis.
- This is done by measuring the fluorescence of the expression system over a 6 hour period, for a range of DNA quantities from 0ug to 6ug.
Equipment
- Fluorometer + PC
- 37°C incubator
- Fluorometer plate (black)
- Sticky seal tape
- Gilson pipettes 200, 20, 10
- Eppendorf Tubes x 7
- Stopwatch
- Foil
Reagents
- Commercial S30 E.coli extract. Including:
- 175µl Amino Acid Mixture Minus Cysteine, 1mM
- 175µl Amino Acid Mixture Minus Methionine, 1mM
- 175µl Amino Acid Mixture Minus Leucine, 1mM
- 450µl S30 Extract, Circular (3 × 150µl)
- 750µl S30 Premix Without Amino Acids
- Nuclease Free water x1ml
- DNA pTet-GFP from midiprep
Preparation
- First collect all equipment and reagents and ensure that the fluorometer and the PC connected has a data collection protocol installed.
- Place the 96well plates into the 37°C incubator.
- For the cell extract, get the following out of the cell extract kit:
- A.A's from kits
- Premix tube
- S30 tubes
- To prepare the commercial E.coli Cell Extract, carry out the following Procedure, two times:
- First prepare a complete amino acid mixture for the extract solution: Add the 25µl volume of two amino acid minus mixtures into an labeled eppendorf to give a volume of 50µl. Each amino acid minus mixture is missing one type of amino acid.
- Take an eppendorf tube and add the 50µl of the E.coli complete amino acid mixture.
- Add 200µl of S30 Premix (Without Amino Acid) into the eppendorf tube.
- Then add 150µl of S30 Extract Circular too.
- The final volume of cell extract is: 400µl
- Incubate cell extract mixture in the 37°C incubator.
- Prepare the different DNA concentrations for pTet construct(concentration of pTet DNA = 500ng/µl):
- Concentration 1 = 1µg: Add 4µl of DNA in 36µl nuclease free water.
- Concentration 2 = 2µg: Add 8µl of DNA in 32µl nuclease free water.
- Concentration 3 = 4µg: Add 12µl of DNA in 28µl nuclease free water.
- Concentration 4 = 6µg: Add 16µl of DNA in 16µl nuclease free water.
- This will give a total volume of 40µl of each DNA concentration. Put each DNA into a seperate, labeled eppendorf tube and place them in the 37°C incubator.
Plate loading
- Take the plate out of the incubation.
- Begin by loading 40µl of the in vitro expression system into the right wells.
- Tap down the top of the plate to bring down any solution to bottom of the well.
- Then add 20µl of purified DNA sample to each well, as indicated on the schematic. Be careful not to add to wells that DO NOT NEED DNA.
- Add 20µl of nuclease free water into the two negative control wells, as shown in the schematics.
- Put 60µl of water into some empty wells in the middle of each plate. These will be used to check for evaporation.
- After the DNA and the cell extract mixtures have been put into their respective wells, load the program on the PC to measure the fluorescence in the right wells.
- After the measurement, place the sticky tape across the plate and place the plate in the 37oC incubator.
- Before placing in the incubator, wrap aluminium foil around the plate to prevent photobleaching.
- Measure the temperature every hour, for 6 hours.
- Using the [http://2007.igem.org/Imperial/Wet_Lab/Results/Res1.3 GFPmut3b calibration curve], plot a graph of GFPmut3b synthesized against time for all 5 DNA quantities used.
Results
Our raw data and data analysis can be found here: File:S30 DNA Data.xls
