Part:BBa_K2825002
PcaU inducible promoter with high sensitivity
Inducible promoter device for protocatechuic acid (PCA). The PcaU transcription factor represses its own transcription as well as a target transcript when PCA is not present by binding to the operator region. When PCA is present, PcaU releases the region and transcription of the target transcript occurs.
This version of PcaU is derived from evolutionary engineering courtesy of Jha et. al. See design section for details
Usage and Biology
PcaU is an IclR transcription factor originally obtained from a PCA catabolism operon in Acinetobacter baylyi. (Jha et al., 2018). PcaU was then optimized for sensitivity and specificity in response to PCA in Pseudomonas putida through directed evolution.
Characterization
PcaU has been inserted into the pGLO plasmid, in which it expresses GFP when induced by PCA. Fluorescent intensity scales hyperbolically with PCA concentration. Above 10mM concentration, PCA was toxic to BL21 E. coli containing the PcaU reporter. We used a logarithmic scale in the chart below to clearly indicate the relationship between PCA concentration and fluorescence.

The lower range of PcaU sensitivity is in single micromolar concentrations. When measuring PCA concentrations this dilute in a multi well plate, wells on the edge of the plate show increased error. For accurate results, fill outer wells with water and use inner wells only. The figure below used 32 wells in the center of a 48 well plate (n=8). Washing wells in PBS will also reduce error. We used a logarithmic scale in the chart below to clearly indicate the relationship between PCA concentration and fluorescence.

PcaU is functional in DH5a E. coli, but is more sensitive in BL21 DE3 E. coli. We used a linear scale in the chart below to show the equal uninduced fluorescence of these cells.

For parts submission, we mutated an EcoR1 site in the noncoding region from GAATTC to GAAATC. The chart below shows that the mutation did not affect sensitivity. We used a linear scale in the chart below to show the equal uninduced fluorescence of these cells.

Sequence and Features
- 10COMPATIBLE WITH RFC[10]
- 12COMPATIBLE WITH RFC[12]
- 21COMPATIBLE WITH RFC[21]
- 23COMPATIBLE WITH RFC[23]
- 25COMPATIBLE WITH RFC[25]
- 1000INCOMPATIBLE WITH RFC[1000]Illegal SapI site found at 171
References
1. Jha, R. K., Kern, T. L., Fox, D. T., & M. Strauss, C. E. (2014). Engineering an Acinetobacter regulon for biosensing and high-throughput enzyme screening in E. coli via flow cytometry. Nucleic Acids Research, 42(12), 8150–8160. http://doi.org/10.1093/nar/gku444
Experment
iGem 2020 RDFZ-China constructed pcau sensor based on existing part pcau.Pcau sequence activator will express a protein can be stablize and activate by PCA, and the Pcau protein with PCA can activate the downstream pPCA promoter. pPCA promoter is designed have very low expression when PCA is not present.
we build pcau activator and eGFP report sequence on puc57 plasmid, a high-copy number plasmid.
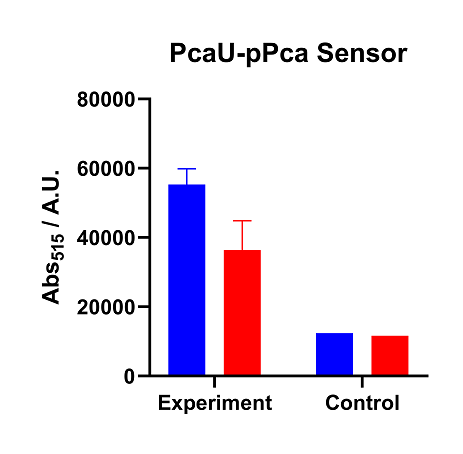
Sensor activity of PcaU-pPCA system under different emission light.
The data of figure are tested data of Pcau expressor, construct with pPCA downstream promoter. Two groups of our repeat data show Pcau sensing system have good reaction with the join of PCA and activate downstream promoter. Because the intensity of fluorescence signal increases when PCA is joined. But we can also see the leakage of GFP is also very serious, because compare to our negative empty pUC57 plasmid, Pcau-pPCA plasmid have over three to four times fluorescence intensity even PCA is not joined, denoting unwanted expression of the downstream sequence. This may be the result of having our reporter genes on a high copy plasmid, which increases the overall leakage, which is not what we want.
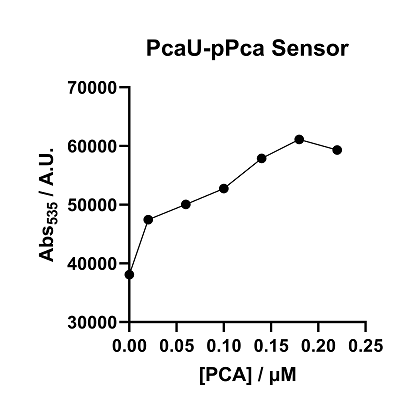
The data of figure are the tested data of PcaU-pPCA-GFP under emission light 535nm. We make a serial dilution of PCA to do further tasking on PcaU-pPCA control system. We found similar property that when PCA molecular is not added, the fluorescence intensity/bacterial concentration of pcauU-pPCA is about 36000. And the GFP protein expression of the sensing systems has increased since the concentration of PCA increase, and the value of F/A is increased when reflected in the image. The data shows pPCA promoter can be controlled by the pcau activator and the concentration of PCA can be regulated and controlled by the concentration of PCA.
Previous study's characterization: PcaU inducible promoter with high sensitivity (by iGEM23_WHU-China)
In a previous study, the inducer sensitivity and dynamic range were tested with different RBS and (-35/-10) sites.

(A) Three constructs used for pcaU and promoter show varying levels of signal and dynamic range against 34DHB; (B) Above experiment repeated with new clones carrying three pcaU constructs and transcription response against inducer 34DHB measured in a single cell format using a flow cytometer; (C) Yellow filtered photos of the 488 nm illuminated cell suspensions of equal cell density.
It also tests the intensity with the flow cytometry method.

(A) Dose-response plot; (B) Flow cytometry analyses of the cell population grown under different conditions.
In addition, the study utilizes a library screening for an improved promoter region.

(A) Improved dynamic range observed in a few clones with mutated intergenic region;(B) Multiple sequence alignment of sequences from three improved clones shows variation in all four blocks (spacer between pcaU operator and -35 position, -35 sequence, -10 sequence, and the transcription initiation site) ;(C–F) Flow cytometry analyses of the reference clone and three evolved clones arranged in decreasing overlap between the induced (black outline with vertical gridlines) and uninduced (gray outline with horizontal gridlines) fluorescence distribution.
References
- Jha RK, Kern TL, Fox DT, M Strauss CE. Engineering an Acinetobacter regulon for biosensing and high-throughput enzyme screening in E. coli via flow cytometry. Nucleic Acids Res. 2014 Jul;42(12):8150-60.
//classic/regulatory/other
//function/regulation/transcriptional
//function/sensor
//promoter
//regulation/positive
| None |


