
Part:BBa_K1483002
α-Galactosidase
This part is [http://appft1.uspto.gov/netacgi/nph-Parser?Sect1=PTO1&Sect2=HITOFF&d=PG01&p=1&u=/netahtml/PTO/srchnum.html&r=1&f=G&l=50&s1=20140220553.PGNR. patented] and should therfore only be used for research purposes.
Encodes for an enzyme, that is capable of cleaving off galactose from B-group blood antigens, thereby turning them into H-antigens. Can be used to convert erythrocytes from blood type A to O. The part is designed in the RFC25 standard, thus enabling fusion to other proteins and tags.
Improvements from 2021 TAS_Taipei
We improved a part from the 2014 Tuebingen team: α-Galactosidase (α-Gal) from Bacteroides fragilis (Part:BBa_K1483002).
α-Galactosidase is an enzyme that catalyzes the cleavage of the galactose off of B type blood antigens such that the remaining sugar can be classified as a H antigen, which the anti-A and anti-B antibodies are unable to recognize and thus does not elicit an immune response in the human body [1]. Therefore, the enzyme can convert B blood types to universal O type.
Unsuccessful Expression of Past Part
We obtained the amino acid sequence of the α-Galactosidase protein from the iGEM DNA Repository Plate (BBa_K1483002), as entered into the iGEM parts collection database by the Tuebingen iGEM team in 2014.
In order to test protein expression of the enzyme, we added a strong promoter and strong ribosome binding site (RBS; BBa_K880005) upstream of the protein amino acid sequence to create a part BBa_K3717003, as well as a T7 promoter and strong ribosome binding site (RBS;BBa_K525998) upstream of the protein amino acid sequence to create a part BBa_K3717001.
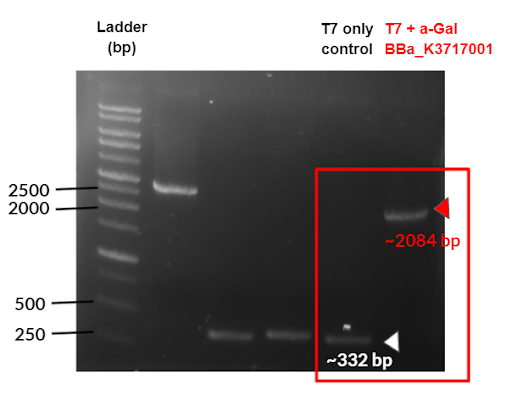
Figure 1. Colony PCR check for T7 promoter + α-Gal (Part: BBa_K3717001) using VF2 and VR primers. Uncut plasmid (T7 only control) has a band at the expected part size of 332bp, indicated by white triangle. Confirms successful ligation as a band is produced at the expected size of 2084bp, indicated by the red triangle.

Figure 2. Colony PCR check for strong promoter (K88) α-Galactosidase (α-Gal) (Part: BBa_K3717003) using VF2 and VR primers. Uncut plasmid (K88 only control) has a band at the expected part size of 355 bp, indicated by white triangle. Confirms successful ligation as a band is produced at the expected size of 2107 bp, as indicated by the red triangle.
We tested protein expression of these two composite parts by transforming our plasmids into BL21 E. coli cells. We grew cultures at 37°C overnight, diluted those cultures, and then grew to OD600 0.5~0.6 at 37°C. We then induced expression with 0.5 mM IPTG and allowed cultures to grow overnight at room temperature. We took samples pre-induction and post-induction and examined them by SDS-PAGE.

Figure 3. SDS Page of cell lysate for each strain: T7 promoter α-Galactosidase (α-Gal) (Part: BBa_K3717001) and strong promoter (K88) α-Galactosidase (α-Gal) (Part: BBa_K3717003). Green triangles indicate expected size for α-Gal (65.7 kDa). We found that the sequences for the target proteins do not contain a start codon, thus have no expression, as shown by the triangles.
Our SDS-page (Fig. 3) did not show any overexpression bands for the enzymes of interest. The results indicate that there were no target proteins at their expected band sizes: 65.7 kDa band for both T7 promoter + α-Gal and K88 promoter + α-Gal in the induced sample. As the SDS page is of cell lysis samples, other bands present are due to innate proteins present in the bacteria cell.
Upon comparison of the amino acid sequence from Tuebingen’s part (BBa_K1483002) with full sequences that were offered by other studies online, we discovered that the enzyme sequences were missing a few amino acids, also including the start codon, which explained the non-expression of the proteins (Fig. 4).

Figure 4. Top sequence: First 24 amino acids of Team Tuebingen's 2014 α-Galactosidase part BBa_K1483002. Bottom sequence: First 60 amino acids of TAS_Taipei'sα-Galactosidase part BBa_K3717006; the first 15 amino acids include a 6x His tag and linker used for purification. Based on the alignment of the two sequences, Tuebingen's part is missing the first 21 amino acids of the α-Galactosidase protein.
Successful Expression of New Improved Part
We improved their part by adding the missing base sequences, including the start codon, and attached a 6x Histidine tag through a flexible Glycine-Serine linker. We derived the sequence of α-Galactosidase from Bacteroides fragilis then optimized the sequence for E. coli protein expression. This formed two new α-Galactosidase basic parts: α-Gal with N-Terminal 6x Histidine Tag (BBa_K3717006) and α-Gal with C-Terminal 6x Histidine Tag (BBa_K3717015).

Figure 5. Open reading frame for α-Galactosidase with N-Terminal 6x Histidine tag (BBa_K3717006)

Figure 6. Open reading frame for α-Galactosidase with C-Terminal 6x Histidine tag (BBa_K3717015)
We used these parts to create two new composite parts: BBa_K3717009 for N-Terminal His tag and BBa_K3717012 for C-Terminal His tag, through the attachment of a T7 promoter + RBS (BBa_K525998) upstream of the open reading frame (ORF) and a double terminator (BBa_B0015) downstream of the ORF.

Figure 7. Design of α-Galactosidase with T7 Promoter, strong RBS, N-Terminal 6x Histidine tag and Double Terminator Construct (Part:BBa_K3717009)

Figure 8. Design of α-Galactosidase with T7 Promoter, strong RBS, C-Terminal 6x Histidine tag and Double Terminator Construct (Part:BBa_K3717012)
We tested protein expression of the composite parts by transforming our plasmids into BL21 E. coli cells. We grew cultures at 37°C overnight, diluted those cultures, and then grew to OD600 0.5~0.6 at 37°C. We then induced expression with 0.5 mM IPTG and allowed cultures to grow overnight at room temperature. We harvested cells by centrifugation and lysed cell pellets through either sonication or with xTractor Lysis Buffer [2] supplemented with 20 mM imidazole. We purified our histidine-tagged proteins using Ni sepharose affinity chromatography. We then utilized SDS-PAGE to confirm the sizes of purified proteins.
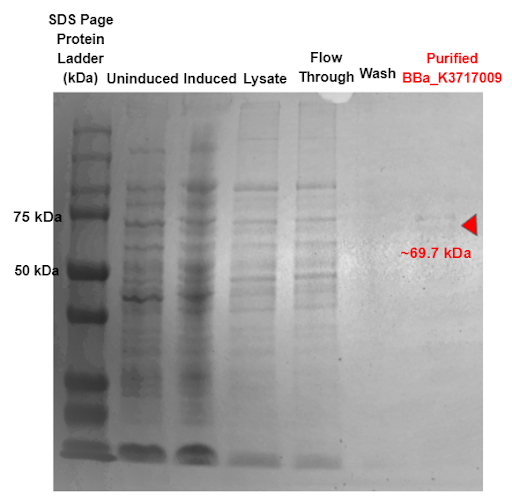
Figure 9. SDS-PAGE of purified proteins with the T7 promoter α-Galactosidase expressing construct (BBa_K3717009). Red triangles indicate expected size for the part.
Our results in Figure 9 indicate a protein band at 69.7 kDa, which is the molecular weight of our α-Galactosidase ligase enzyme with the 6x His tag and GS linker attached. This shows that our α-Galactosidase (Part: BBa_K3717009) was expressed and purified.
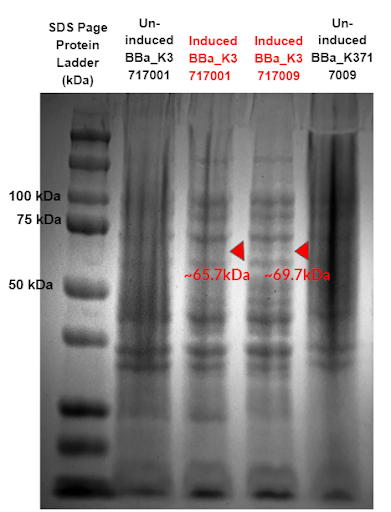
Figure 10. SDS-Page comparing protein expression of two constructs using our α-Galactosidase sequence (BBa_K3717009) and Tuebingen’s α-Galactosidase sequence (BBa_K3717001). Red triangles indicate expected sizes for the parts.
Results from the gel (Fig. 10) show a band expressed at an expected size of 69.7 kDa for our new α-Galactosidase constructs, while no band expressed at an expected size of 65.7 kDa for Tuebingen’s α-Galactosidase constructs. This confirms our improvement of Tuebingen’s part BBa_K1483002 that was unable to express due to a lack of a start codon.
Successful Function of New Improved Part
We buffer exchanged α-Galactosidase (α-Gal) into 0.1 M Sodium Phosphate buffer (pH 7.4) by dialysis and concentrated the solution to 0.5 mL using centrifugal ultrafiltration. We confirmed the functionality of the enzyme using 3 assays: colorimetric tests, thin-layer chromatography, and mass spectroscopy.
To test the efficiency and efficacy of the enzyme, we injected the enzyme into a solution containing a colorimetric substrate that imitated the structure of an A antigen, with the product creating a color that can be measured using a 405 nm absorbance.
A colorimetric substrate for α-Galactosidase (α-Gal) was obtained from Sigma Aldrich (Fig 11). This substrate contains a 4-nitrophenol leaving group, which turns yellow upon successful cleavage in solution. The concentration of 4-nitrophenol was quantified at absorbance 405 nm using a 96 well plate based assay [3]
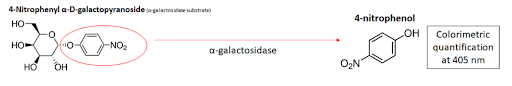
Figure 11. Colorimetric substrate for α-Gal.
We performed small-scale colorimetric tests to verify the function of the enzyme. To each well, we added 50 μL of 10 mM substrate, 10 μL of enzyme, 30 μL of water, and 10 μL of 10x Glycobuffer 1 (50 mM CaCl2, 500 mM sodium acetate, pH 5.5), a buffer recommended by New England Biolabs to ensure optimal enzyme activity [4]. Following 2 hours of reaction at room temperature, we diluted the well contents in 1.9 mL of water and took absorbance readings at 405 nm. Results indicate that α-Gal successfully cleaved its substrates (Fig 12). Moreover, we demonstrated the specificity of the enzyme through the lack of enzyme activity on the other substrate.

Figure 12. Small-scale colorimetrics tests verify the functionality and specificity of our purified enzymes. a) 96-well plates following enzyme reaction. b) absorbance readings of diluted well contents. c) buffers and solutions used in substrate and control wells.
To quantify the activity of the enzyme, we performed enzyme reactions at various substrate concentrations and measured the absorbance at different time intervals over a constant time period (Fig 13). Results from at least 3 independent trials for each enzyme were averaged and used to calculate Michaelis–Menten constants for enzyme efficiency (see enzyme model in modeling). The colorimetric substrate tests show that the functionality of our α-Galactosidase part is successful.
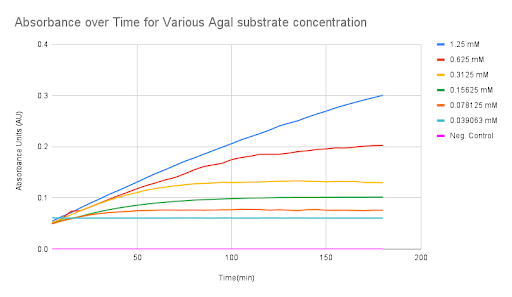
Figure 13. Absorbance over time for various α-Gal substrate concentrations
Thin Layer Chromatography
In order to evaluate the enzymatic activity of α-Gal, we used melibiose as the substrate for enzyme reactions followed by detection through normal-phase thin-layer chromatography (TLC), which utilizes the competition of the solute and mobile phase for binding sites to separate compounds based on affinity. α-Gal can cleave the bonds in melibiose, causing the dissolution of melibiose into its constituent monosaccharides, glucose and galactose (Fig 14).
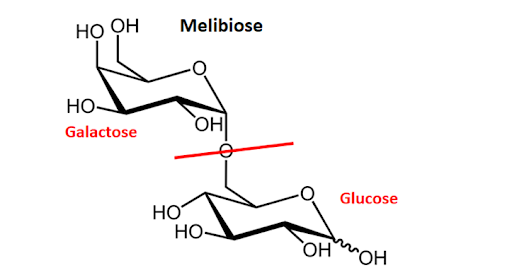
Figure 14. Molecular structure of melibiose. Enzymatic cleavage of glycosidic linkage results in glucose and galactose monosaccharides.
We detected the cleavage of the disaccharides through TLC. To determine if cleavage occurred, we devised a method to test if the disaccharides were present in solution, or if only galactose and glucose product was present, indicating complete cleavage.
To test our method, we spotted controls of melibiose, lactose, as well as glucose and galactose samples onto TLC plates then run with a mobile phase of ethyl acetate : ethanol : acetic acid : boric acid (5:2:1:1, v/v/v/v) (Fig 15). We visualized the plate with a spraying reagent consisting of sulfuric acid : ethanol (1:1, v/v), followed by heating at 140°C for 5 minutes. We observed bands both in ambient light and at 365 nm, and we measured Rf values as the solute front (orange line) divided by the solvent front (yellow line). Based on our experiments, we were able to determine that glucose and galactose migrate significantly further up the plate compared to lactose and melibiose, with hRf values of 55.9 ± 2.8 for glucose and galactose, 33.3 ± 1.3 for lactose, and 33.1 ± 1.4 for melibiose.
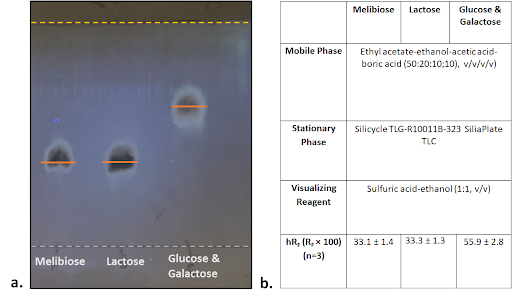
Figure 15. Simultaneous TLC of melibiose, lactose, and glucose with galactose controls. a) Visualized plate at 365 nm. b) TLC parameters used and averaged hRf values calculated.
With our TLC detection method in place, we proceeded to test the functionality of α-Gal. We incubated 10 μL of 10 mg/mL melibiose with 5 μL of enzyme or water (negative control) and 5 μL of 0.1 M citrate-phosphate buffer (pH 5.8) at room temperature for a total reaction time of 2 hours [5]. We then spotted the control and enzyme reaction sample on TLC plates and developed them using the predetermined (see above) TLC parameters and visualization steps (Fig 15). Our results demonstrate successful cleavage of its substrate by α-Gal, as indicated by the band with a hRf that corresponds approximately to the measured hRf of glucose and galactose.
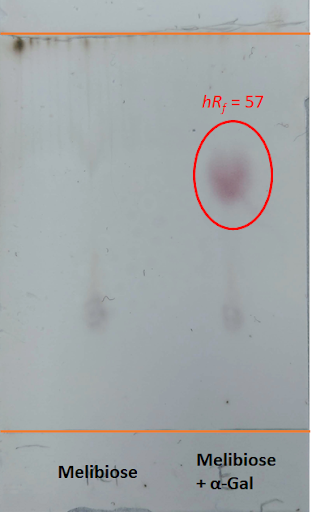
Figure 16. TLC plate of melibiose treated with water and α-Gal under ambient light. There is clear cleavage of melibiose into glucose and galactose from the enzyme reaction.
Mass Spectroscopy Trisaccharide Antigen Tests
Given that the colorimetric results were positive, we wanted to further test the enzyme’s specificity by using trisaccharides as substrates. These trisaccharides contain three monosaccharides that have identical chemical structures to the A and B antigens found on RBCs. To test a proof of concept functionality of α-Gal in cleaving the B-antigen trisaccharide, we carried out a reaction of the enzyme and its trisaccharide dissolved in 1X GlycoBuffer [4], deionized water, and purified BSA for 1 hour at 37°C. The B-antigen trisaccharides were kindly supplied by Professor Dr. Todd Lowary from the Institute of Biological Chemistry at Academic Sinica [6].
For the enzyme tests, a non-specific trisaccharide served as a negative control and the B-antigen trisaccharide specific to α-Gal served as the experimental unit (Table 1).
Table 1. Experimental setup for enzyme-antigen tests

After the reaction, the reaction solution was passed through C18 columns to minimize impurities from the reaction solution. We then evaluated the flow through solution with a mass spectrometer to measure peaks in molar mass in order to determine the compounds present in the reaction solution. The original molar mass of the B-antigen is 672.32g/mol; therefore, after cleavage, two fragments with molar masses of 510.27g/mol and 162.05g/mol are expected to form (Fig 16).
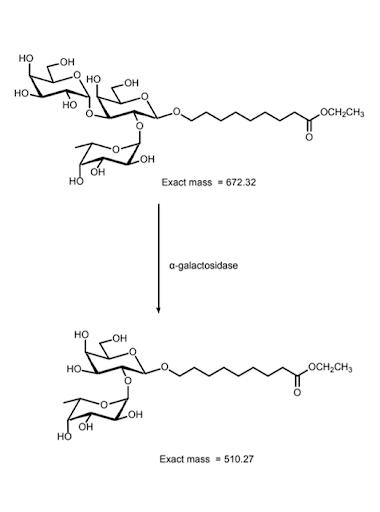
Figure 17. Molecular structure and mass of B-antigen trisaccharides and subsequent products following enzymatic cleavage.
The results shown by the mass spectrometer confirm the functionality of α-Galactosidase. The experimental unit shows the presence of the cleaved fragment from the reaction with the B-antigen trisaccharide, indicated by the peak at 533 g/mol in the mass spectrum (Fig 18). The negative control confirms the specificity of α-Gal, as the A-antigen trisaccharide was not cleaved, indicated by the peak at 736 g/mol (Fig 19). Throughout all readings of the mass spectrum, the molar mass of the peaks have been increased by 23 g/mol due to a sodium adduct. Unrelated peaks/background noise can be attributed to compounds present in the buffer solution.

Figure 18. α-Gal cleaves B-antigen trisaccharide. Mass spectrum of α-Gal and B-antigen trisaccharide reaction solution (experimental unit, flow through). The peak at 533g/mol shows the presence of the cleaved fragment from the reaction of the α-Gal enzyme and B-antigen trisaccharide.

Figure 19. Negative Control: Mass spectrum of α-Gal and A-antigen trisaccharide reaction solution (negative control, flow through). The negative control confirms the specificity of α-Gal, as the A-antigen trisaccharide was not cleaved, indicated by the peak at 736g/mol
Mass spectroscopy results from the reaction between α-Galactosidase with B-antigen trisaccharide substrate demonstrate its ability to cleave its specific trisaccharides, demonstrating the proof of concept that the enzyme is able to cleave the B blood group antigens.
References
1. Rahfeld, Peter, and Stephen G. Withers. “Toward Universal Donor Blood: Enzymatic Conversion of A and B to O Type.” Journal of Biological Chemistry, vol. 295, no. 2, Jan. 2020, pp. 325–34. DOI.org (Crossref), https://doi.org/10.1074/jbc.REV119.008164.
2. XTractorTM Buffer & xTractor Buffer Kit User Manual. (n.d.). 10. Held, Paul. “Kinetic Analysis of β-Galactosidase Activity Using the PowerWave™ HT and Gen5™ Data Analysis Software .” BioTek, 16 Feb. 2007.
3. Held, Paul. “Kinetic Analysis of β-Galactosidase Activity Using the PowerWave™ HT and Gen5™ Data Analysis Software .” BioTek, 16 Feb. 2007.
4. Biolabs, New England. “Typical Reaction Conditions for α-N-Acetylgalactosaminidase (P0734).” New England Biolabs: Reagents for the Life Sciences Industry, https://international.neb.com/protocols/2013/01/10/typical-reaction-conditions-p0734.
5. Takasaki, S., and A. Kobata. “Purification and Characterization of an Endo-Beta-Galactosidase Produced by Diplococcus Pneumoniae.” Journal of Biological Chemistry, vol. 251, no. 12, June 1976, pp. 3603–09. DOI.org (Crossref), https://doi.org/10.1016/S0021-9258(17)33387-2.
6. Meloncelli, Peter J., and Todd L. Lowary. “Synthesis of Abo Histo-Blood Group Type I and II Antigens.” Carbohydrate Research, vol. 345, no. 16, 16 Sept. 2010, pp. 2305–2322., https://doi.org/10.1016/j.carres.2010.08.012.
Sequence and Features
- 10COMPATIBLE WITH RFC[10]
- 12COMPATIBLE WITH RFC[12]
- 21COMPATIBLE WITH RFC[21]
- 23COMPATIBLE WITH RFC[23]
- 25COMPATIBLE WITH RFC[25]
- 1000INCOMPATIBLE WITH RFC[1000]Illegal BsaI.rc site found at 412
| None |