Part:BBa_K774006
Mammalian-Bacterial promoter with eCFP reporter: CArG promoter sequence + BBaK216005 + BBa_E0420
-Fluorescence studies
-Flow cytometry
-Transfection into mammalian cells
Our hybrid promoter hopes to add to the systems already in the registry by creating a hybrid promoter that combines the bacterial promoter PyeaR and the mammalian CArG element , in the orientation mammalian to bacterial, both of which respond to exogenous nitrogenous species. Combining the two would allow a more modular NO sensor that can be used in mammalian and bacterial cells interchangeably. The hybrid promoter has been attached to the reporter: enhanced Cyan Fluorescent Protein (eCFP). The hybrid promoter has been characterised by observing expression of flourescent protein, and found to have increased transcription in response to increasing concentrations of potassium nitrate.
E. coli containing this part were then grown in media at 0 mM, 5 mM, 10 mM, 15 mM and 20 mM potassium nitrate concentrations over night before being lysed. The lysed product was then run through a fluorometer in order to gain data of the intensity of expression at different concentrations of substrate.
NOTE: All data for the fluorometer has had the equivalent 0 mM reading subtracted from it in order to nulify the affects of light scattering due to cell debris
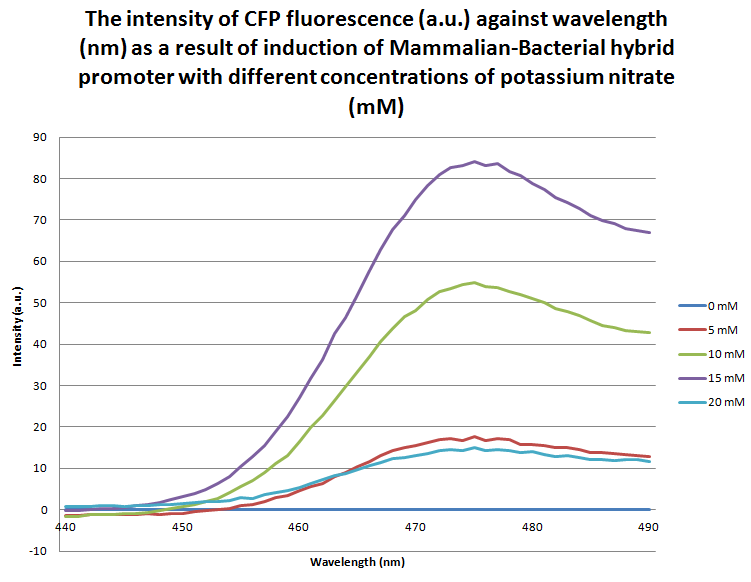
The graph above shows the flourescence measured from the expression of eCFP due to the response of the mammalian-bacterial promoter to different concentrations of potassium nitrate. The wavelength reading which corresponds to eCFP is between 440-500nm. The graph clearly demonstrates that between 0mN and 15mM there is a proportional relationship between fluorescence intensity and potassium nitrate concentration. It can be noted that at a 20mM concentration the intensity of fluorescence sharply decreases back down to the level of 5mM potassium nitate concentration. This may be due to the cell overexpressing eCFP up to the point at which the excess protein begins to form inclusion bodies which can no longer fluoresce; alternatively, this could be due the potassium nitrate concentration reaching the critical concentration at which it becomes toxic to the cell. This data differs to the readings taken from the bacterial-mammalian promoter ligated to eCFP, as well as the hybrid promoters to RFP, which may suggest there is a difference in the molecular mechanisms that these promoters function by; however at this point the change in intensity at 20mM is inconclusive and is an area which we would like to look into further.
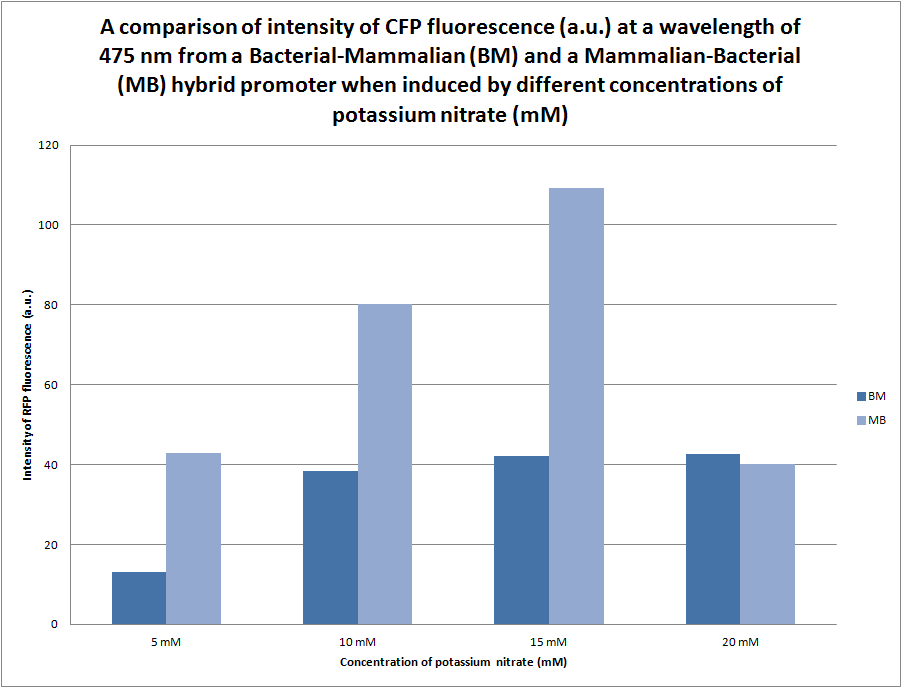
We were initially unsure of the effect that the orientation of the bacterial (PyeaR) and the mammalian (CaRG) genes would have in gene expression, therefore we synthesised two hybrid promoters in the orientation bacterial-mammalian and mammalian-bacterial. The graph above compares the intensity of fluorescence of the two hybrid promoters (BBa_K774004 and BBa_K774006) ligated to eCFP. There is a distinct difference between the intensity of fluorescence produced by the bacterial-mammalian promoter and the mammalian-promoter which is something that we would like to look into further. It is particularly interesting that at an intensity of 109a.u. the mammalian-bacterial promoter returns to the same level of intensity as the apparent maximum of the bacterial-mammalian promoter at 40a.u.
Flow Cytometry
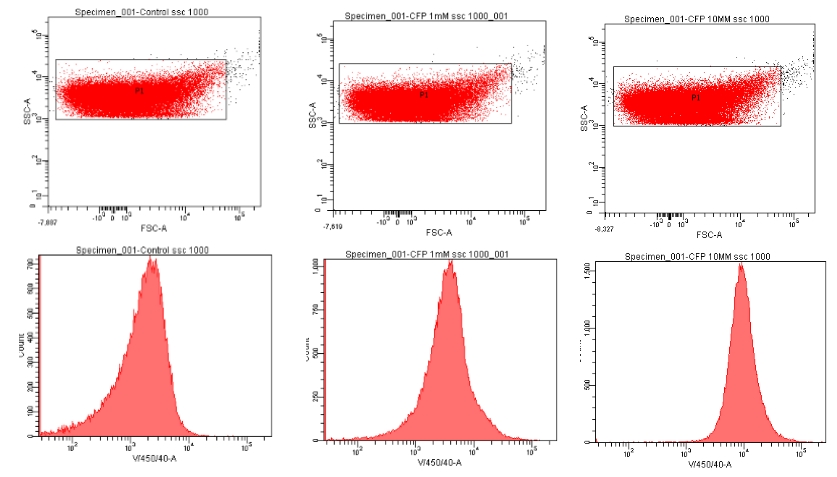
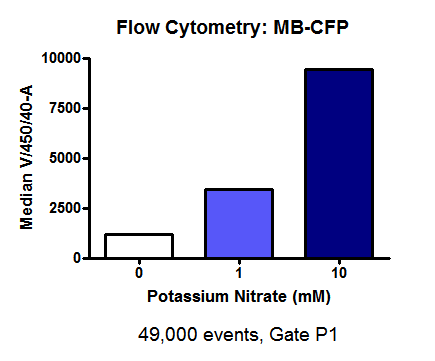
Flow cytometry was used with part BBa_K774006 to quantify the number of cells which fluoresced (eCFP) in response to induction by potassium nitrate.
Three tubes of media were inoculated with E. coli transformed by the M-B + eCFP BioBrick (BBa_K774006). Each tube then had potassium nitrate added to it at different concentrations; 0 mM, 1 mM and 10 mM respectively. The E. coli were grown over night and then spun down, fixed in 4% PFA, spun down again and re-suspened in 500ul PBS. The samples were then analysed in an BA Aria II flow cytometer.
[http://2012.igem.org/Team:NRP-UEA-Norwich/Protocol Full Protocol]
Flow cytometry data for M-B eCFP transformed E. coli that were grown in either 0 mM, 1 mM or 10 mM potassium nitrate. Top row: Scatter plot of raw data and gating strategy utilised. Bottom row: eCFP Fluorescence profiles of samples.
As the graph indicates, the number of cells which fluoresce is proportional to the concentration of potassium nitrate that the cells are exposed to. Suggesting that our hybrid promoter is functional as expected.
Flexibility of the hybrid promoter: Mammalian Cells
The hybrid promoterswere created to increase the flexibility of chassis a promoter can be used in. To fully characterise the functionality of B-M and M-B, it was therefore important that the promoter could in fact work within mammalian and bacterial chassis. As the above studies show, M-B and B-M both function in bacterial cells.
To incorporate B-M and M-B into a mammalian system, transformations were not possible, instead a transfection was carried out. Unlike the growth studies, where growing colonies were sufficient to prove that the DNA within plasmids were incorporated, reporter proteins: CFP and RFP were attached to allow visual characterisation.
To transfect the cells we used lipid based transfection. To do this, media, transfection reagent, nitric oxide donor, DNA and cells were required. Below is the full list of reagents used:
. DMEM (Dulbecco’s Modified Eagle Medium) without serum to transfect and later treated with DMEM with serum and 10% Fetal Calf Serum. Cells are transfected without serum as serum interferes with the process but cells can die without serum so later is treated with serum.
. M-B +CFP was the DNA used. More than one sample was used. From nanodropping the concentrations of DNA were found to be both 500nm/µL. To transfect, 6.5 µL of DNA was used. The exact DNA we used was labelled MB2-C11a and MB2-C12a. The DNA was obtained from different colonies from the same plate.
. SNAP (S-Nitroso-N-Acetylpenicillamine) at a final concentration of 500µM. SNAP is the nitric oxide donor. Unlike bacterial cells where potassium nitrate could be used as a direct source. SNAP is metabolised by cells to produce NO which then induces the BioSensor.
. LipoD293 which is the transfection agent. This creates a membrane around the DNA which then binds to the mammalian cell and allows entrance of DNA into cell. This is much like endocytosis.
. The chassis used was MCF7 which is a human breast cancer cell line. The cells (30 µL) were seeded into a 6 channel slide at a concentration of 3 x 10⁵ cells/ml.
In the process of transfection, LipoD293 was mixed with DNA at left for 15mins. Meanwhile, the media was removed from the cells and washed with serum free DMEM (100 µL). The transfection mixture was then added to the relevant channels on the slide. Below is how our channels were labelled.
For the full transfection protocol please click [http://2012.igem.org/Team:NRP-UEA-Norwich/Experiments here]
After the transfection, the media was changed to media containing serum and also SNAP was added. The cells were then viewed and the following images were obtained.
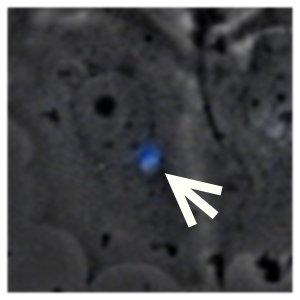
Close up image of what appears to be eCFP fluorescence from a transfected MCF7 cell. The figure appears to show low levels of fluorescence in the cells as there are small blue circles appearing in the cells indicative of CFP expression. MCF7 cells do endogenously express endothelial cell nitric-oxide synthase (ecNOS), which can produce low levels of NO. Perhaps it is endogenous NO production which is inducing the M-B promoter to express low levels of eCFP.
The images show what looks like exclusion bodies which have a greater concentration of fluorescent proteins than within cells. In the control without SNAP, there are none of these exclusion bodies found. In the control photo with SNAP and also the transfected cells without SNAP added, there are a few exclusion bodies. However, in the photos that showed transfected cells with SNAP added, there are a large number of these.
We do not know for certain what these may be, but a possibility is that the transfection was successful and the MB promoter does work. It may be that due to MB attachment to fluorescent proteins, the cells are producing exclusion bodies to rid the cells of these. In the control with SNAP, the cancer cells react to NO in the human body. These may be exclusion bodies formed from cells in general in reaction of NO. As to the transfected cell with exclusion bodies, there are very few of these. MB may be very sensitive to NO. As NO is naturally produced by cancer cells to induce angiogenesis, these may be for that reason.
Another possibility is that NO has induced the cells to apoptose and this has lead to vesicles forming containing the fluorescent proteins (Yu, et al., 1999). In non transfected cells, there is less fluorescent proteins compared to the transfected cells and hence there are more fluorescing vesicles.
Following transfection, to test the cytotoxicity of NO, the number of cells after addition of SNAP was calculated. The MCF7 cells were seeded into 6 well plates again at a concentration of 2.5 x 10⁵ cells/ml. SNAP was then added at 500µM 2 days after plating. The cells were counted 24 hours after the addition of SNAP. For the full cell count protocol please click [http://2012.igem.org/Team:NRP-UEA-Norwich/Protocol#Cell_Counting here].
From previous studies such as that by Lala and Chakraborty, 2001 have shown that NO can lead to cytostasis and apoptosis. Our assay further confirmed this.
Sequencing
BLAST Analysis
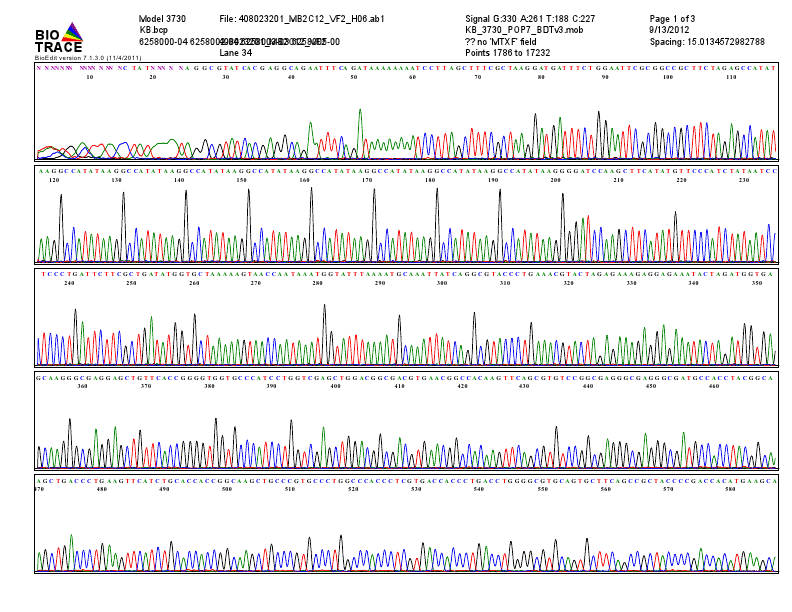
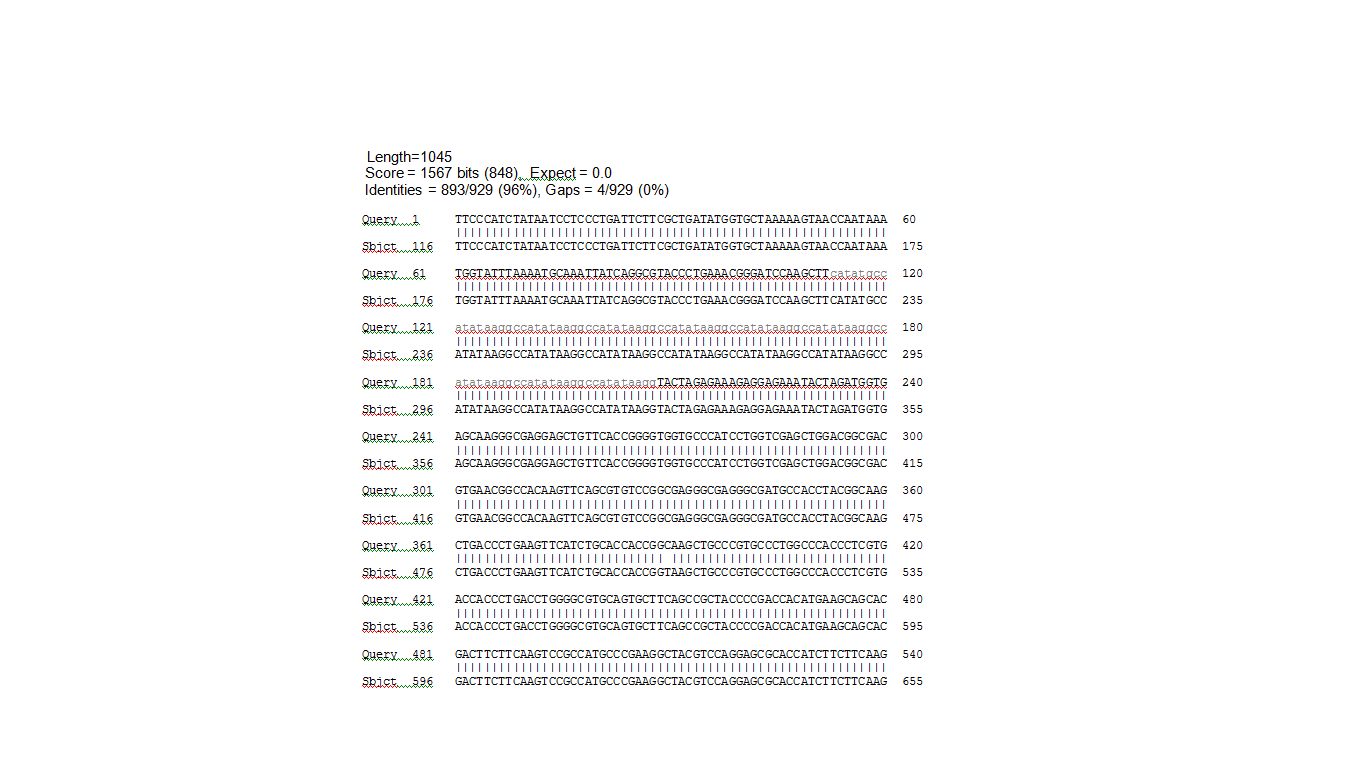
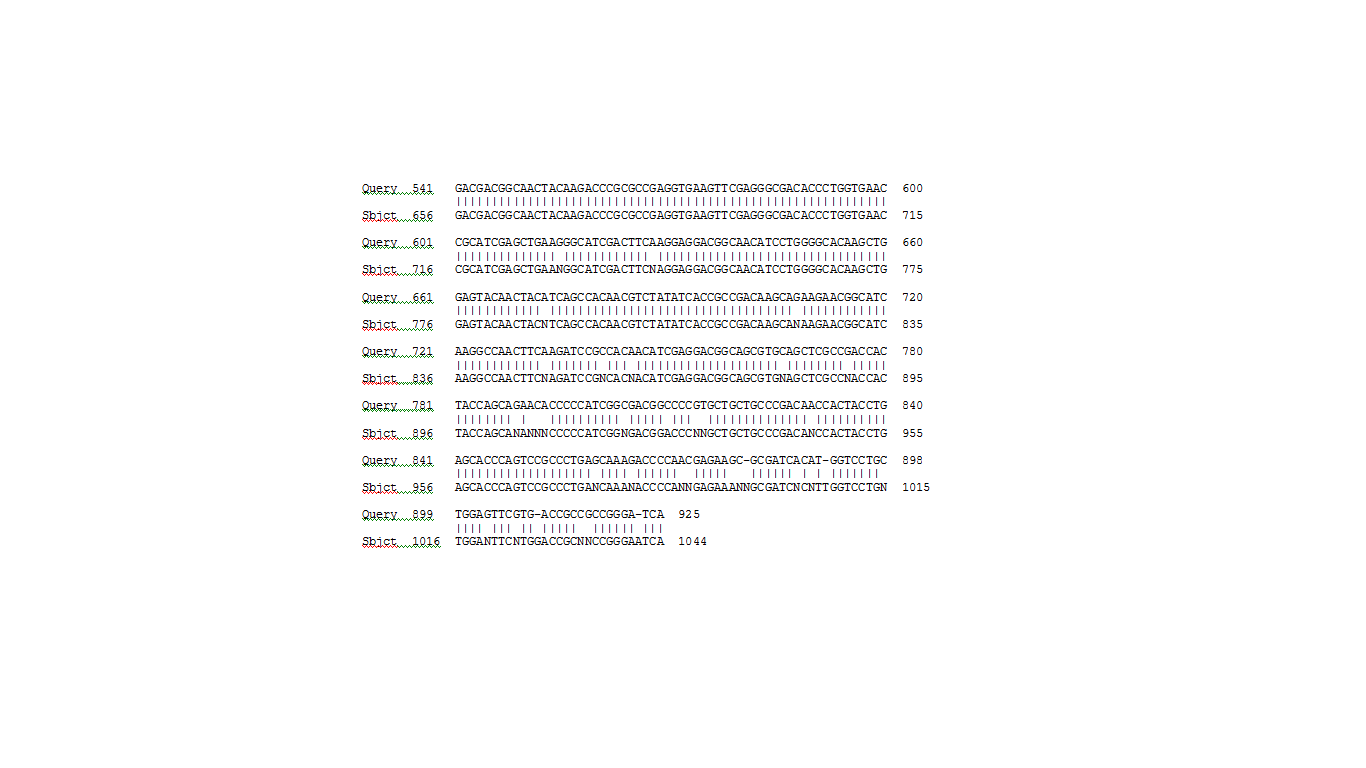
To review the success of the sequencing of the BioBrick sample, the predicted DNA sequence was compared to the sequence data using a Pairwise BLAST analysis ([http://blast.ncbi.nlm.nih.gov/Blast.cgi bl2seq]). The predicted DNA sequence was entered as the Query and the data from the sequencing analysis was entered as the Subject. The summary information at the top of the image identifies how many bases are identical between the two sequences. Lines joining the two sets of sequences indicate identical bases, and the absence of a line indicates a difference between the two sequences.
References
Civerolo, K.L. and Dickerson, R.R. (1998) Nitric oxide soil emissions from tilled and untilled cornfields, Agricultural and Forest Meteorology, 90; 307-311
Davidson, E., (2012), Sources of Nitric Oxide and Nitrous Oxide following Wetting of Dry Soil, Soil Sci. Soc. Am. J. 56; 95–102
Lala, P.K. and Chakraborty, C. (2001) 'Role of nitricoxide in carcinogenesis and tumour progression', The Lancelet, 2;149–156.
Lin H.Y., Bledsoe P.J., Stewart V., (2007), Activation of yeaR-yoaG Operon Transcription by the Nitrate-Responsive Regulator NarL Is Independent of Oxygen- Responsive Regulator Fnr in Escherichia coli K-12▿, Journal of Bacteriology, 189: 7539 - 7548
Lipschultz, F., Zafiriou, O.C. Wofsy, S.C., Elroy, M.B., Valois, F.W. and Watson, S.W. (1981) Production of NO and N2O by soil nitrifying bacteria, Macmillan Journals, 294; 641-643
Pasqualini, R., Koivunen, E., Kain, R., Lahdenranta, J., Sakamoto, M., Stryhn, A., Ashmun, R.A., Shapiro, L.H., Arap, W. And Ruoslahti, E. (2000) Aminopeptidase N is a receptor for tumour-homing peptides and a target for inhibiting angiogenesis, The Journal of Cancer Research, 60; 722-727
Scott S.D., Joiner M.C., Marples B., (2002), Optimizing radiation-responsive gene promoters for radiogenetic cancer therapy., Gene Therapy, 9: 1396-1402
Worthington J., Robson T., Scott S., Hirst, D., (2005), Evaluation of a synthetic CArG promoter for nitric oxide synthase gene therapy of cancer, Gene Therapy, 12: 1417–1423
Xu, W., Liu, L.Z., Loizidou, M., Ahmed, M. And Charles, I.G. (2002) The role of nitric oxide in cancer, Cell Research, 12; 311-320
Yu, W., Simmons-Menchaca, M., Gapor, A., Sanders, B.G. and Kline, K. (1999) 'Induction of Apoptosis in Human Breast Cancer Cells by Tocopherols and Tocotrienols', Nutrition and Cancer, 33;26-32.
Usage and Biology
- 10COMPATIBLE WITH RFC[10]
- 12COMPATIBLE WITH RFC[12]
- 21INCOMPATIBLE WITH RFC[21]Illegal BamHI site found at 91
- 23COMPATIBLE WITH RFC[23]
- 25COMPATIBLE WITH RFC[25]
- 1000COMPATIBLE WITH RFC[1000]
| None |

