Part:BBa_K774004
Bacterial-Mammalian promoter with eCFP reporter: BBaK216005 + CArG promoter sequence + BBa_E0420
Aim: Our hybrid promoter hopes to add to the systems already in the registry by creating a hybrid promoter that combines the bacterial promoter PyeaR and the mammalian CArG element , both of which respond to exogenous nitrogenous species. Combining the two would allow a more modular NO sensor that can be used in mammalian and bacterial cells interchangeably. The hybrid promoter has been attached to the reporter: enhanced Cyan Fluorescence Protein (eCFP). The hybrid promoter has been characterised by observing expression of flourescent protein, and found to have increased transcription in response to increasing concentrations of potassium nitrate.
This image (right) shows competent cells transformed with part: BBa K774004 and grown in media containing potassium nitrate (as a source of nitrates in order to induce promoter activity) at concentrations of 0 mM, 10 mM, 50 mM and 100 mM (from right to left). The E. coli was grown for 6 hours and then added to eppendorf tubes and spun down in a centrifuge in order to produce a pellet. The four samples were then viewed under a UV box to assess for fluorescence; as the photograph to the right shows that the sample at 0 mM potassium nitrate did not fluoresce, however those at 10, 50 and 100 mM potassium nitrate did fluoresce. They also appeared to fluoresce at the same strength, suggesting that 10 mM was equal to or above the maximum sensitivity level of this part.
E. coli containing this part were then grown in media at 0 mM, 5 mM, 10 mM, 15 mM and 20 mM potassium nitrate concentrations over night before being lysed. The lysed product was then run through a fluorometer in order to gain data of the intensity of expression at different concentrations of substrate.
NOTE: All data for the fluorometer has had the equivalent 0 mM reading subtracted from it in order to nulify the affects of light scattering due to cell debris

The graph above shows the flourescence measured from the expression of eCFP due to the response of the bacterial-mammalian promoter to different concentrations of potassium nitrate. The wavelength reading which corresponds to eCFP is between 440-500nm. The graph clearly demonstrates that between 0mM and 15mM there is a proportional relationship between fluorescence intensity and potassium nitrate concentration. There appears to be a sharp increase in fluorescence intensity between 5mM and 10mM, and the rate at which intensity increase gradually decreases so that there is only a small increase between 15mM and 20mM.

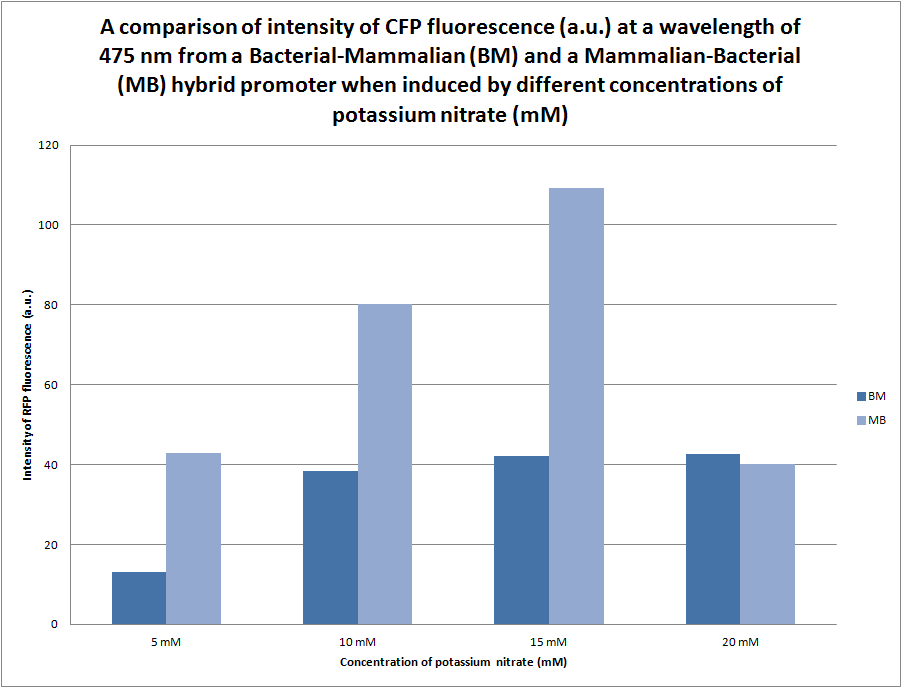
We were initially unsure of the effect that the orientation of the bacterial (pYEAR) and the mammalian (CaRG) genes would have on gene expression, therefore we synthesised two hybrid promoters in the orientation bacterial-mammalian and mammalian-bacterial. The graph above compares the intensity of fluorescence of the two hybrid promoters (BBa_K774004 and BBa_K774006) ligated to eCFP. There is a distinct difference between the intensity of fluorescence produced by the bacterial-mammalian promoter and the mammalian-bacterial promoter; which is something that we would like to look into further. It is particularly interesting that at an intensity of 109a.u. the mammalian-bacterial promoter returns to the same level of intensity as the suggested maxiumum of the bacterial-mammalian promoter at 40a.u.
Sequencing

BLAST Analysis
To review the success of the sequencing of the BioBrick sample, the predicted DNA sequence was compared to the sequence data using a Pairwise BLAST analysis ([http://blast.ncbi.nlm.nih.gov/Blast.cgi bl2seq]). The predicted DNA sequence was entered as the Query and the data from the sequencing analysis was entered as the Subject. The summary information at the top of the image identifies how many bases are identical between the two sequences. Lines joining the two sets of sequences indicate identical bases, and the absence of a line indicates a difference between the two sequences.
For this sample, some differences are observed between the preicted sequence and the sequencing data. There is a suggested mutation at bp 506 of the Subject trace, but close inspection of the sequencing data shows that there is some lack of clarity at that position. Further changes between the two sets of sequences are due to "N's" in the sequencing dats, which is due to unresolved data. Overall, the sequencing data looks reasonable but, to resolve the inconsistencies, the sequencing analysis should be repeated.
- 10COMPATIBLE WITH RFC[10]
- 12COMPATIBLE WITH RFC[12]
- 21INCOMPATIBLE WITH RFC[21]Illegal BamHI site found at 101
- 23COMPATIBLE WITH RFC[23]
- 25COMPATIBLE WITH RFC[25]
- 1000COMPATIBLE WITH RFC[1000]
| None |


