
Part:BBa_K3206014
His-tagged eGFP under Bba_J23100 Promoter
The part BBa_K3206012 has been designed to be under the promoter Bba_J23100. Purified protein can then be used to formulate a standard curve of the fluorescence level of the protein concentration.
Sequence and Features
- 10COMPATIBLE WITH RFC[10]
- 12INCOMPATIBLE WITH RFC[12]Illegal NheI site found at 7
Illegal NheI site found at 30 - 21INCOMPATIBLE WITH RFC[21]Illegal BamHI site found at 777
Illegal BamHI site found at 783
Illegal BamHI site found at 789 - 23COMPATIBLE WITH RFC[23]
- 25COMPATIBLE WITH RFC[25]
- 1000COMPATIBLE WITH RFC[1000]
Newcastle 2019 Characterisation
Aim:
Newcastle 2019 have characterised the strength of the constitutive promoter BBa_J23100. The activity of BBa_J23100 was determined using eGFP as a reporter. A standard curve of the fluorescence level of eGFP was determined using eGFP with a His6-tag under the BBa_J23100 promoter. This allowed us to purify the eGFP protein to determine fluorescence at protein level. Our goal was to calculate absolute values of eGFP protein concentration in cells.
Figure 1.
A) Standard Curve of the mean fluorescence level of purified eGFP protein diluted to concentrations from 0 to 8.25 µM. Linear regression equation of Y = 302.4x + 72.79 and an R2 value of 0.9951.
B) The optical density (OD600) of E. coli Top10 cells assembled with eGFP over 24 hours
C) The fluorescence intensity of E. coli Top10 cells assembled with eGFP over 24 hours
D) Protein concentration in mg/ml of eGFP assembled in E. coli Top10 cells over 24 hours. Protein concentration was determined by converting fluorescence figures from B using the equation Y = 302.4x + 72.79.
E) Colony forming units (CFU) per mL (CFU/mL) of eGFP assembled in E. coli Top10 cells over 24 hours
F) The Number of eGFP proteins per cell over 24 hours. E. coli Top10 cells were assembled with eGFP
Excitation wavelength = 488 nm. Emission wavelength = 507 nm. Measured in Greiner black welled 96 well plate in a ThermoFisher Varioskan Lux Microplate Reader
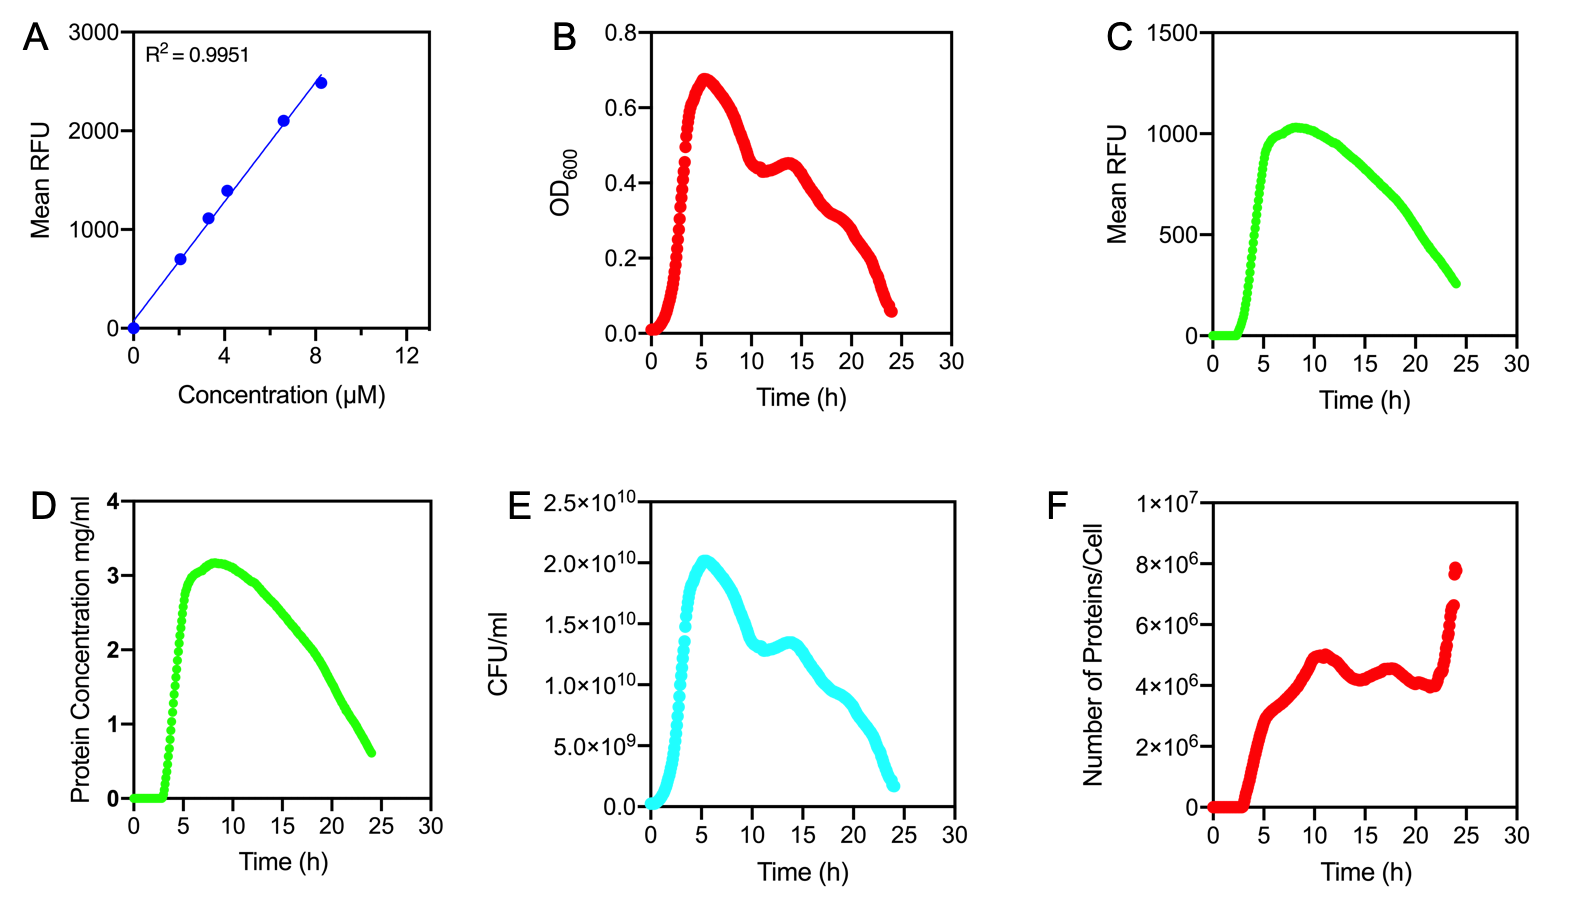
Results Figure 1A shows the standard curve of diluted purified eGFP at increasing concentrations. An R2 value of 0.9951 was achieved, showing the standard curve was a good fit. The OD600 showed a growth curve with an exponential phase and death phase however, the lag and stationary phase was not observed (Figure 1B). This was unexpected as we could expect the curve to be similar to that of a typical E. coli growth curve. This may be due to an issue with the plate reader and cell clumping at the lower optical densities. However, the fluorescence level reflected a similar pattern to a typical E. coli growth curve (Figure 1C). The fluorescence values into protein concentration in mg/ml (Figure 1D). The graph shows that the maximum protein concentration is approximately 3mg/ml after 10 hours. The protein concentration (mg/ml) showed a similar pattern as observed in the fluorescence level. The number of viable cells in our culture can be measured over the 24 hour period. Using these values combined with the protein concentration in mg/ml, we are able to calculate the mg of protein per CFU (mg/CFU) by dividing the protein concentration (mg/ml) over the CFU/ml value at the equivalent time (Figure 1E). Whilst mg/CFU is much better than a relative fluorescence value, our goal was to calculate absolute values of eGFP protein concentration in cells - the Number of Proteins per Cell. We divided the mg/CFU values by the molecular weight (MW) of the protein in mg. The MW of eGFP is 28.179 kDa, which is 28179•1.66 x 10⁻²¹ in mg. This resulted in figure 1F showing the Number of eGFP proteins per cell over 24 hours. However, there was a spurious increase in the number of protein per cell, this may be due to the issue in OD600 readings as seen in figure 1B.
Conclusions: In conclusion, we achieved the goal to calculate absolute values to measure promoter strength of BBa_J23100 using eGFP fluorescent expression as a reporter. A standard curve of the number of proteins per cell over time was achieved. The results showed that protein expression was high per cell reflecting the strength of the promoter. We have accurately measured proteins with internal standards. However, this experiment should be repeated as there were issues with measuring the optical density.
For more detail see - https://2019.igem.org/Team:Newcastle/Results/bronzecharacterisation
| None |