Part:BBa_K1939003
Mutant RBS with mCherry reporter gene
This composite part contains an RBS with a single point mutation (C to A transversion) and the encoding region for the mCherry fluorescent reporter protein. This particular RBS mutation results in lower translational efficiency with mCherry fluorescence that is 93.48% of the native RBS.
Usage and Biology
The ribosome binding sites (RBS) of archaea are not well characterized. By creating and characterizing a library of RBS sequences, researchers will be able to express proteins of interest at variable levels of expression in Methanococcus maripaludis. Ribosome binding sites are typically 6-7 base pair sequences on a transcript that is complementary to the 3’ end of the 16S rRNA. After binding of the RBS to the ribosome, translation will be initiated. An RBS with higher affinity for the ribosome will result in higher rate of translation, and inversely, an RBS with lower affinity will result in lower rate of translation.
Characterization
Characterization of the RBS sequences was accomplished using the red fluorescent protein, mCherry as a reporter. Qualitative analysis was evaluated by visualization of the RFP and quantitative analysis was completed through use of a plate reader for reading fluorescence.
2013: Improving the Construct and Characterization of Fluorescent Reporters for use in Methanogens
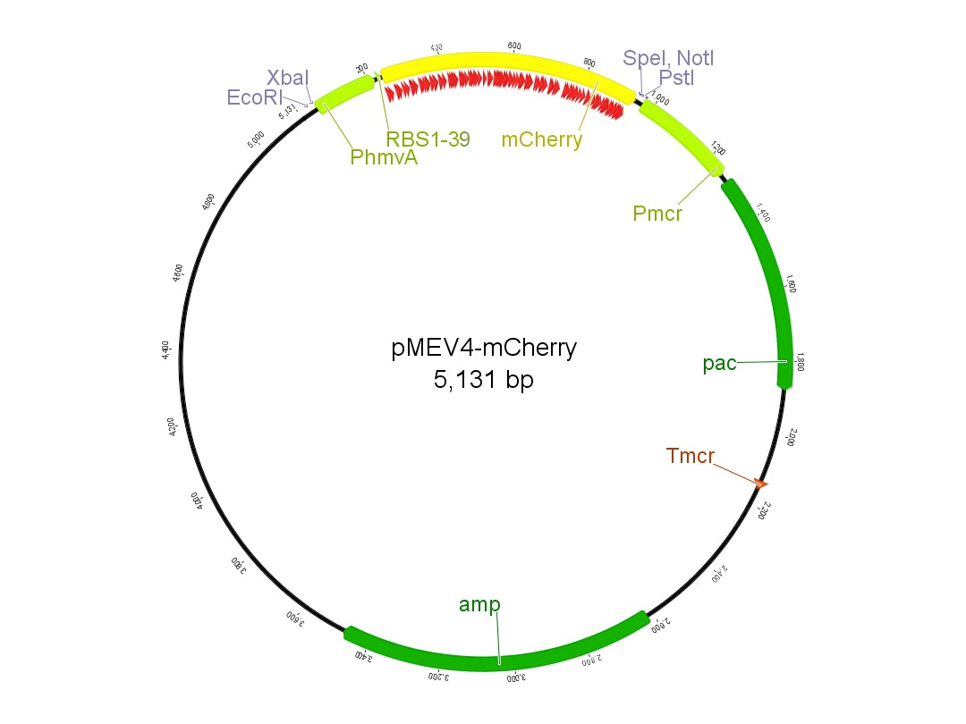
In 2013, the UGA-Georgia team submitted the part BBa_K1138002, named pAW50-mCherry. This construct, designed for use as a fluorescent reporter in methanogens, had a few issues. First, the part was not 100% biobrick compatible due to an internal restriction site in the mCherry gene. The characterization of the part was also inconsistent among samples, and overall unreproducible. To improve upon the previous part, we designed pMEV4-mCherry (BBa_K1383000, figure 1). The primary differences between this construct and the pAW50-mCherry of 2013 is that pMEV4-mCherry does not contain the internal restriction site and the selective resistance gene against puromycin, our antibiotic for use in M. maripaludis, has an independent promoter. Therefore, pMEV4-mCherry is 100% biobrick compatible, and can more reliably function under increased selective pressure. Improvements on characterization are elaborated more below.
2014: The Construct for Characterizing a Library of Ribosome Binding Site Sequences
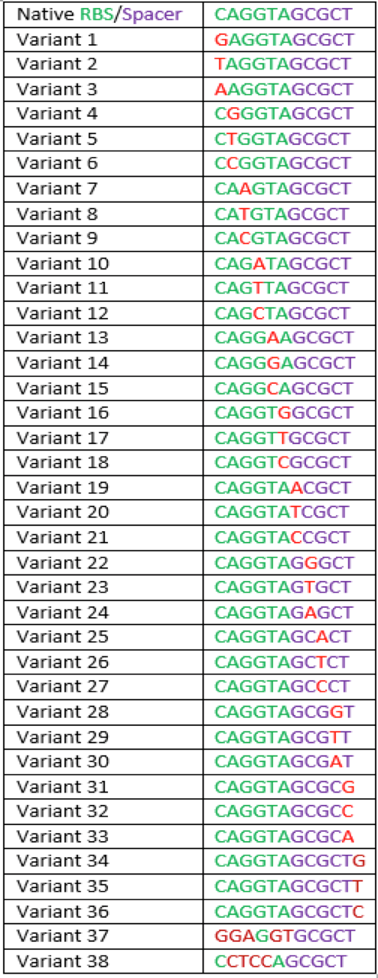
The region labeled 'RBS 1-39' in the pMEV4-mCherry vector (figure 1) is the site immediately upstream of the mCherry gene that will be subject to variation. Specifically, we will be mutating the 6 base pairs of the RBS, the 5 of the spacer, and the first base of the start codon. We begin with the 'native' RBS (BBa_K1383000, shown on this page), which is a known functional RBS sequence in methanogens and is typically used for creating synthetic parts. The RBS variants are created by making mutations on only one base at a time for every nucleotide different from the native (figure 2). We designed two additional RBS sequences based off the 16S rRNA data for M. maripaludis, termed theoretical 'perfect' and 'negative' (figure 2, #37 & #38, BBa_K1383001 & BBa_K1383002, respectively). These RBS sequences were designed to have the theoretical greatest and worst possible affinities for the 16S ribosome. Figure 3 illustrates the specific sequence for the part described on this page, the 'native' RBS.
2015: Quantitative Analysis
The part BBa_K1939000 yielded a 93.48% of fluorescence compared to that of the BBa_K1383000 (Native) (figure 4). For all mutations considered, but not all developed into parts, calculated fluorescence ranged from that of the theoretical negative to 165.85% of the native (table 1).This part is a C to A point mutation.
More information on our protocols on developing the parts and quantifying their fluorescence values can be seen on UGA-Geogia 2015 Experiments page.

Table 1: This table shows the percent of native expression for 8 different mutations of the native sequence as well as the native sequence. This table includes both pre-existing parts and what will become future parts.

Modeling
Since RBS prediction models for inferring translational efficiency have been availalbe for Bacteria but not Archaea, we are intereted in finding out if the bacterial model would be applicable to Archaea. In total, we have characterized 14 unique archaeal RBS mutants from our RBS library. This has allowed us to perform a preliminary correlation analysis between predicted data and our experimental results, and it was demonstrated that no such correlation existed at all (Figure 5). Therefore, Therefore, further studies are needed to validate a prediction model for translational efficiceny based on archaeal RBS.
<" ">
">
Figure 5. Correlation between predicted and experimental mCherry expression levels for different RBS mutants. Delta G values for mRNA folding were predicted by UTR designer, and the lower the values are, the more efficient the translation usually is for Bacteria. However, as shown in this graph, the delta G values are not correlated at all with our experimental results obtained from M. maripaludis, an archaeon.
2016: Further Characterization and Usage
For the 2016 year, BBa_K1939003 was further characterized with flow cytometry and was utilized in methods development and interlab experiments. The flow cytometer data allowed the team to characterize fluorescence with a different instrument of measurement (Figure 6). The utilization of BBa_K1939003 in the lysis experiment yielded an optimized extraction method (figure 7). For the interlab, BBa_K1939003 was included along with two other samples that were shipped to multiple teams for fluorescence measurement with either a plate reader or a flow cytometer (Figures 8 and 9). This resulted in more information about the reliability and reproduciblility of our data. It also afforded participating teams the opportunity to learn more about the usefulness of M. maripaludis and the mCherry reporter system. Finally, we were able to establish the first working procedure using formaldehyde fixation to measure fluorescence of mCherry from M. maripaludis cells.

Figure 6. Scatter plot of generated by flow cytometry fluorescence measurement of BBa_K1939003

Figure 7. Fluorescence values of BBa_K1939003 after receiving different lysing treatments. Key: SP- SDS + PIPES; TP- Triton + PIPES; P- PIPES alone; Pson- PIPES + sonication; F- Formaldehyde

Figure 8. Summary of the percentages of the fluorescence of L1C12 and L1C18 mutants against the fluorescence of L2C16 mutant among teams using flow cytometry.

Figure 9. Summary of the percentages of the fluorescence of L1C12 and L1C18 mutants against the fluorescence of L2C16 mutant among teams using plate reader.
Sequence and Features
- 10COMPATIBLE WITH RFC[10]
- 12COMPATIBLE WITH RFC[12]
- 21COMPATIBLE WITH RFC[21]
- 23COMPATIBLE WITH RFC[23]
- 25COMPATIBLE WITH RFC[25]
- 1000COMPATIBLE WITH RFC[1000]
| None |


