
File:ILacI Curves.png
Size of this preview: 800 × 519 pixels. Other resolution: 320 × 208 pixels.
Original file (864 × 561 pixels, file size: 90 KB, MIME type: image/png)
Measurement of the improved part of 2019 Fudan-TSI
File history
Click on a date/time to view the file as it appeared at that time.
| Date/Time | Thumbnail | Dimensions | User | Comment | |
|---|---|---|---|---|---|
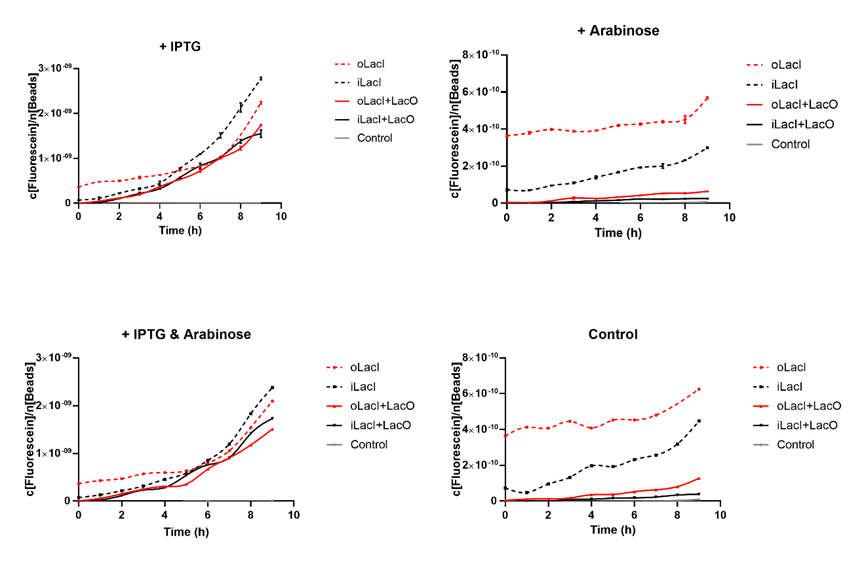
| current | 11:27, 10 October 2019 | | 864 × 561 (90 KB) | YY12138 (Talk | contribs) | The expression level of EGFP controlled by different versions of LacI and inducers, or under different promoters. The origin point indicates the time when different inducers are added (1 mM IPTG and/or 4 mM Arabinose). The title of the graph shows whic... |
| 11:18, 10 October 2019 |  | 864 × 561 (90 KB) | YY12138 (Talk | contribs) | Measurement of the improved part of 2019 Fudan-TSI | |
| 11:15, 10 October 2019 |  | 864 × 561 (90 KB) | YY12138 (Talk | contribs) | Measurement of the improved part of 2019 Fudan-TSI |
- You cannot overwrite this file.
File usage
The following 3 pages link to this file: