
Difference between revisions of "Part:BBa K823030"
| Line 19: | Line 19: | ||
|} | |} | ||
| − | We | + | We compared this BioBrick with other promoters that are involved in spore crust formation such as P<sub>''cotV''</sub> and P<sub>''cgeA''</sub>. |
| + | |||
| Line 25: | Line 26: | ||
To test the activity we cloned this promoter into the lux-reporter vector pSBBS3C-''luxABCDE'' ([[Part:BBa_K823025|BBa_K823025]]) and measured the luminescence. | To test the activity we cloned this promoter into the lux-reporter vector pSBBS3C-''luxABCDE'' ([[Part:BBa_K823025|BBa_K823025]]) and measured the luminescence. | ||
| − | + | The results of the luminescence measurements are shown in the following figure, which also shows the activities of the related promoters P<sub>''cotV''</sub> ([[Part:BBa_K823033|BBa_K823033]]) and P<sub>''cgeA''</sub>. | |
{| style="color:black;" cellpadding="3" width="70%" cellspacing="0" border="0" align="center" style="text-align:left;" | {| style="color:black;" cellpadding="3" width="70%" cellspacing="0" border="0" align="center" style="text-align:left;" | ||
| Line 35: | Line 36: | ||
{| style="color:black;" cellpadding="0" width="90%" cellspacing="0" border="0" align="center" style="text-align:left;" | {| style="color:black;" cellpadding="0" width="90%" cellspacing="0" border="0" align="center" style="text-align:left;" | ||
|style="width: 70%;background-color: #EBFCE4;" | | |style="width: 70%;background-color: #EBFCE4;" | | ||
| − | <font color="#000000"; size="2"><p align="justify">The result of the measurement of | + | <font color="#000000"; size="2"><p align="justify">The result of the measurement of this BioBrick P<sub>''cotYZ''</sub> and of two related promoters P<sub>''cgeA''</sub> and P<sub>''cotV''</sub>. Promoters were fused to the lux operon ([[Part:BBa_K823025|pSBBS3C-''luxABCDE'']]) The left vertical axis displays the luminescence divided by the OD<sub>600</sub> and the left one shows the OD<sub>600</sub>. On the horizontal axis the time is illustrated. The continues lines show the luminescence which correlates with the promoter activity and the dotted lines display the growth curve of each clone.</p></font> |
|} | |} | ||
|} | |} | ||
Revision as of 21:54, 26 September 2012
PcotYZ: B. subtilis promoter regulating expression of spore crust proteins
PcotYZ: Promoter of B. subtilis that is involved in spore crust formation. Hence it is activated in late sporulation. PcotYZ regulates the crust protein cotZ and cotY.
Usage and Biology
|

We compared this BioBrick with other promoters that are involved in spore crust formation such as PcotV and PcgeA.
Evaluation
To test the activity we cloned this promoter into the lux-reporter vector pSBBS3C-luxABCDE (BBa_K823025) and measured the luminescence.
The results of the luminescence measurements are shown in the following figure, which also shows the activities of the related promoters PcotV (BBa_K823033) and PcgeA.
|

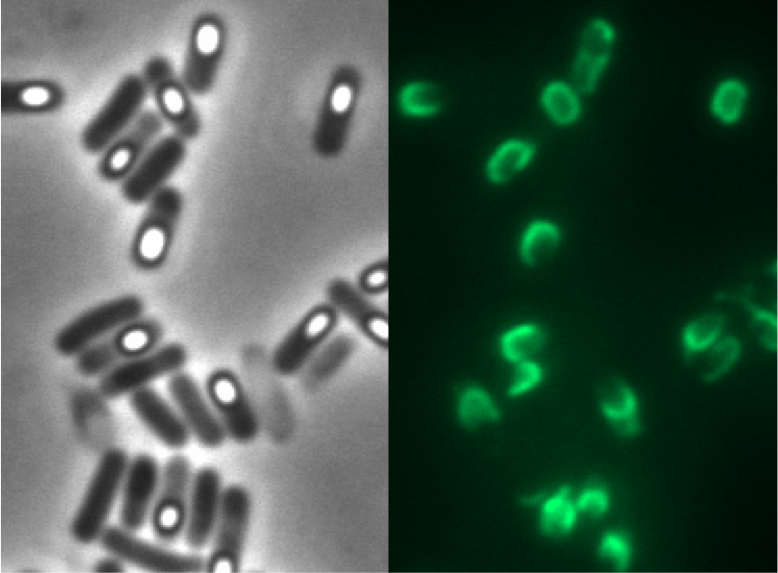
This part was used to display fusion proteins on B. subtilis spores with BBa_K823049.
See all the details about the LMU-Munich 2012 project here: http://2012.igem.org/Team:LMU-Munich/Spore_Coat_Proteins
Sequence and Features
- 10COMPATIBLE WITH RFC[10]
- 12COMPATIBLE WITH RFC[12]
- 21COMPATIBLE WITH RFC[21]
- 23COMPATIBLE WITH RFC[23]
- 25COMPATIBLE WITH RFC[25]
- 1000COMPATIBLE WITH RFC[1000]