Part:BBa_K628006
Protegrin-1 Kill Switch
This part functions as a protegrin-1 (antimicrobial peptide), pBad strong (arabinose-sensitive inducible promoter) controlled E. coli kill switch.
Usage and Biology
Protegrin-1 coding region under the influence of a pBad-strong promoter. Protegrin-1 is an '18-residue beta-sheet peptide isolated from porcine leukocytes with antimicrobial activity against a broad range of microorganisms.' (Steinberg et al 1997) It has its effect by pore membrane disruption (Lam et al 2006) and possibly also by effects such as activation of membrane-damaging proteases (Bierbaum 1985) and has anti-microbial activity against E. coli (Aumelas 2004).
The presence of the pBad strong promoter allows the expression of protegrin-1 to be induced quickly, but at various rates by differing concentrations of arabinose.
The kill switch functions by producing protegrin-1 intracellularly, and concerns were raised about whether antimicrobial peptides would function integrating into the inner phospholipid bilayer leaf, rather than the outer leaf like they do in nature. Protegrin-1 integrates into membranes containing zwitterionic phospholipids, which promote electrostatic interactions between protegrin-1 and the bilayer. As these are present in both the outer and inner leaflets of prokaryotic bacterial membranes, we believe this antimicrobial effect, and therefore, the functionality of the kill switch, should still be present despite the kill switch activating intracellularly. More information on this issue can be found on our wiki: http://2011.igem.org/Team:St_Andrews/switch
Sequence and Features
- 10COMPATIBLE WITH RFC[10]
- 12INCOMPATIBLE WITH RFC[12]Illegal NheI site found at 125
Illegal NotI site found at 164 - 21INCOMPATIBLE WITH RFC[21]Illegal BamHI site found at 65
- 23COMPATIBLE WITH RFC[23]
- 25COMPATIBLE WITH RFC[25]
- 1000COMPATIBLE WITH RFC[1000]
Characterization
For any details, including experimental protocols, please consult our website: http://2011.igem.org/Team:St_Andrews
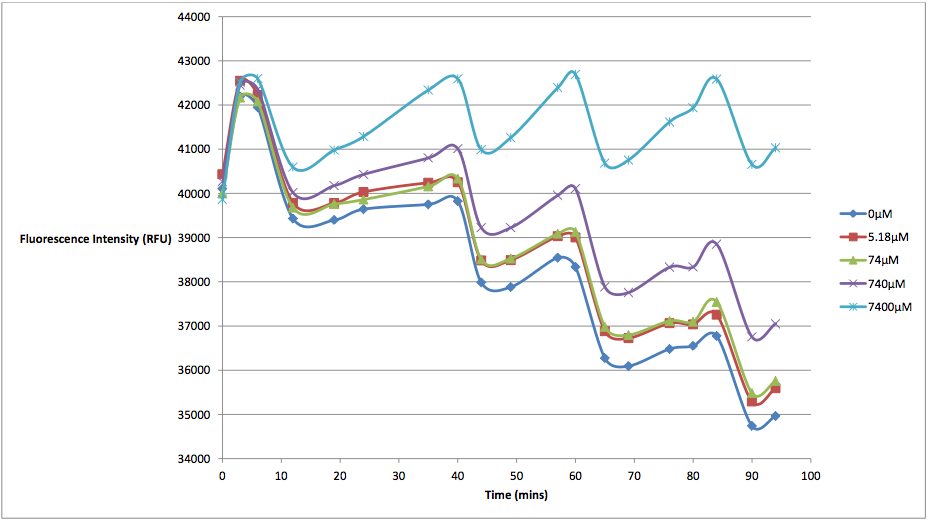
Figure 1 - This graph shows fluorescence readings at 600 nm (485 nm exciting) of K628006-transformed E. coli in solutions of various arabinose concentrations.
The above graph measures the fluorescence readings of E. coli transformed with K628006 across multiple arabinose concentrations. The y-axis represents the scale of the fluorescent output of each E. coli population, while the x-axis denotes the time of each reading. The graph doesn't look very aesthetically pleasing, and in fact, may lead some to believe that our readings of fluorescence decreased over time, and subsequently, so did cell death. However, this is due to the fact that the dye used to stain the cells reduced in fluorescing power over time, resulting in what looked like decreasing cell death. In order to show the relationship between the effects of various arabinose concentrations on fluorescence, we decided to subtract the fluorescent value of our control (E. coli transformed with K628006 in a 0 uM solution) from the rest of our values at every reading. This would remove the focus from the decreasing values, and instead place emphasis on the difference between individual arabinose concentrations. What we find is a much more interesting graph:
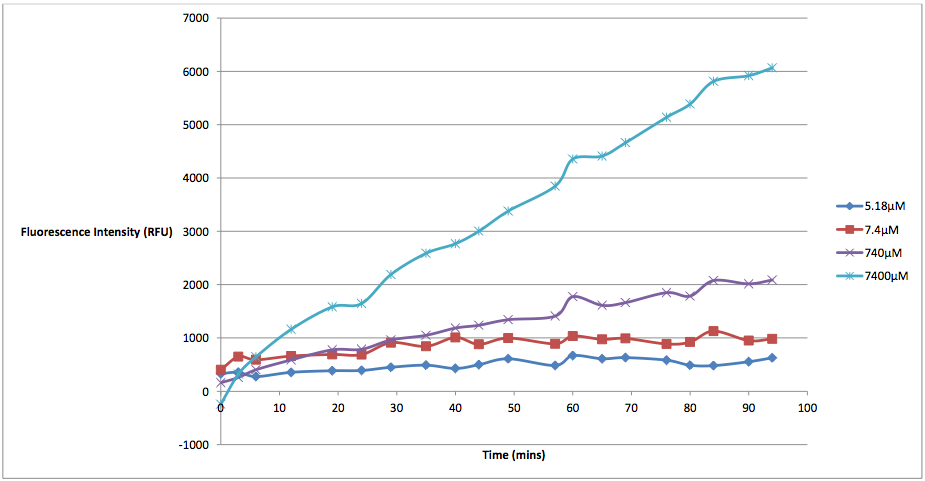
Figure 2 - This graph shows the fluorescence readings at 600 nm (485 exciting) of K628006-transformed E. coli in solutions of various arabinose concentrations. The value of the 0 uM control has been subtracted from the fluorescence values of each other arabinose concentration at every 5 minute reading, in order to show the scale of difference between each reading.
This graph makes the relationship between arabinose and K628006 much more clear. As we can see from the graph, lower concentrations of arabinose cause less cell death than higher ones. The presence of arabinose within the same solution as our transformed E. coli triggered the pBAD strong promoter to induce transcription of the protegrin-1 coding region. As the concentration of protegrin-1 protein rose within the cells, these antimicrobial peptides integrated into the phospholipid bilayer, eventually causing membrane destabilization and pore formation. This allowed the propodium iodine dye to enter the cells, fluorescing near the 630 nm wavelength (we were forced to measure at 600 nm due to the constraints of our microplate reader). As we can see from the graph, higher levels of arabinose induced more protegrin-1 production, resulting in higher fluorescence values.
Alongside this process, arabinose would also be broken down into ribulose-5-phosphate epimerase by the 'ara operon', naturally present within the DNA of the E. coli and the original site of the pBAD promoter. This would cause the concentration of arabinose in each well to decrease slowly over time, the rate of which may differ between various strains of E. coli. Other groups looking to repeat this experiment would need to keep this fact in mind. Additional information on this process can be found on our Modelling page: http://2011.igem.org/Team:St_Andrews/modelling
The aim of a "characterization experiment" is to gather more data about the biobrick in question. Submitting a biobrick that has only been tested under a single condition does not reveal the full range of potential uses for that part. Not only that, but it forces other groups who wish to use that biobrick to waste valuable time further exploring a part that should have been characterized in the first place. With the number of parts being submitted increasing every year, there has been a noticeable lack of characterization in the Registry. It is important for the biobricks within the Registry to be tested under multiple conditions in order for the Registry to function as intended. We have included multiple arabinose concentrations at consecutive orders to magnitude in order to show the total cell death that each concentration will induce, as well as the rate at which that cell death occurs.
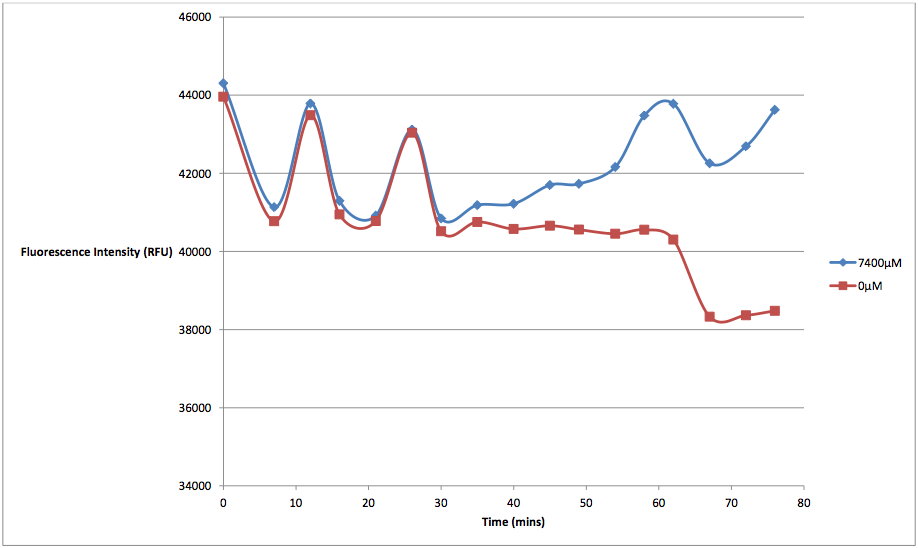
The relationship between the concentration of arabinose and the amount and rate of cell death seems linear in nature. We tested K628006 at multiple arabinose concentrations to see which would best induce activation of the pBAD strong promoter. While it might seem that the 7400 μM arabinose concentration resulted in the strongest kill switch response, the cell death of these readings is not due entirely to our kill switch. We discovered that arabinose in high concentrations would kill cells via non-kill switch related means. This was a problem that plagued the results of our original experiments, which were run with arabinose concentrations several orders of magnitude higher than they should have been. While we did not have time to identify how exactly excess arabinose caused cell death, we can speculate that there was probably an osmosis-based effect, by which the cells were placed in a hypertonic solution that interfered with various other cell regulatory functions. From the graph below, we can see that at concentrations of 7400 μM, supercompetent, non-transformed E. coli were fluorescing considerably higher levels than at 0 μM arabinose concentrations, indicating not only an increase in cell death, but that the arabinose was the cause:
Figure 3 - This graph shows the fluorescence readings at 600 nm (485 exciting) of non-transformed E. coli in solutions of 7400 μM and 0 μM arabinose.
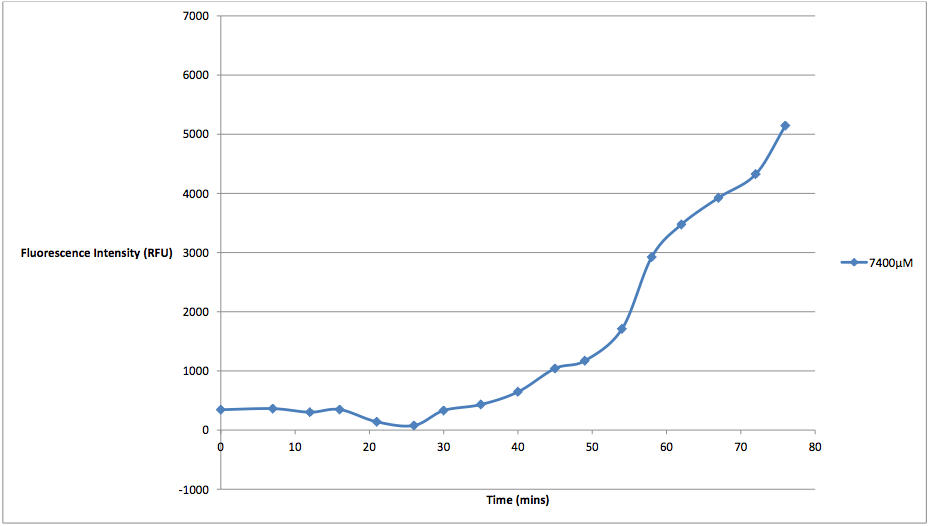
Figure 4 - This graph shows the fluorescence readings at 600 nm (485 exciting) of non-transformed E. coli in a solution of 7400 μM arabinose concentrations. The value of the 0 μM control has been subtracted from the fluorescence value of the 7400 μM arabinose concentration at every 5 minute reading, in order to show the scale of difference between the two concentrations' cell death.
Characterization IONIS_PARIS 2017
We decided to synthesize this part by IDT, amplify it by PCR and ligate it in PSB1C3 to sequence and send it to the registry, as according to the characterisation made by the iGEM Saint-Andrews, it works well. This part is important for us because we wanted to use this protein as a killswitch mechanism for Softer Shock. We did not have the time to further caracterise it but we thought that making it available for other teams and sequence it was great.
BBa_K628006 Sequencing - Authors: IONIS_PARIS 2017
The part has been sequenced with both forward and reverse primers by Ionis Paris Igem team 2017. But only the forward primer worked. The part was sent to the registry.

Protegrin-1 sequencing results compared to sequence in registry
Sequence BBa_K62800:
Forward primer:
CTTTGCNATGCCNTGGCAAGATAGTCCATAAGATTAGCGGATCCTACCTGACGCTTTTTATC GCAACTCTCTACTGTTTCTCCATACCGTTTTTTTGGGCTAGCTACTANANAAAGACAGGACCTACTANATGC GCGGCGGCCGCCTGTGCTATTGCCGCCGCCGCTTTTGCGTGTGCGTGGGCCGCTAATACTAGAGCCAGNCAT CAANTANAACGAAAGGCTCANTTGAAAGACTGGGCCTTTCGTTTTATCTGTTGTTTGNCGGTGAACGCTCNC NANNANAGTCACACTGGCTCACCTTCNGGTGGGCCTTTCTGCGTTTATATAATAATACTAGTANCGGCCGCT GCANNCCGGCAAAANAGGGCAAGGTGTCACCACCCTGCCCTTTTTCTTTAAAACCGAAAANATTACTTC
References
Steinberg et al (1997) 'Protegrin-1: a broad-spectrum, rapidly microbicidal peptide with in vivo activity Antimicrobial Agents and Chemotherapy', Aug 1997, 1738-1742, Vol 41, No. 8
Lam et al (2006) 'Mechanism of Supported Membrane Disruption by Antimicrobial Peptide Protegrin-1' J. Phys. Chem. B, 2006, 110 (42), pp 21282–21286
Bierbaum, G. & Sahl, H.-G (1985) 'Induction of autolysis of Staphylocci by the basic peptide antibiotics pep5 and nisin and their influence on the activity of autolytic enzymes.' Arch. Microbiol. 141, 249 ± 254
Aumelas et al. (2004) 'Synthesis and Solution Structure of the Antimicrobial Peptide Protegrin-1' European Journal of Biochemistry Volume 237, Issue 3, pages 575–583, May 1996
//collections/antimicrobial
| None |


