Part:BBa_K4391000
E. coli ATCC 25922 Aptamer
Escherichia coli is a gram-negative bacterial species found ubiquitously in the intestinal gut flora of animals, including humans, and can also survive and multiply in abiotic environments. Pathogenic E. coli variants can cause 3 main clinical syndromes:
1) sepsis/meningitis (meningitis/sepsis associated E. coli, or MNEC),
2) urinary tract infections (uropatogenic E. coli, or UPEC), and
3) intestinal and diarrheal diseases.
This makes quick, accurate detection of E. coli in contaminated food, water and human fluid (urine/blood) samples quite imperative. This basic part is a single stranded DNA (ssDNA) aptamer capable of binding to Escherichia coli strain ATCC 25922 with Kd values in the nanomolar range.
Biology and Usage
Aptamers have high potential as diagnostic and therapeutic tools, with many advantages when compared with antibodies including their smaller size–which improves access to biological environments ‘hidden’ from antibodies–their lack of immunogenicity, and the lower cost and higher reproducibility of nucleotide production. In addition, aptamers can be chemically modified to became more stable, labeled with fluorophores or other reporters, and can be easily truncated to eliminate redundant sequences.
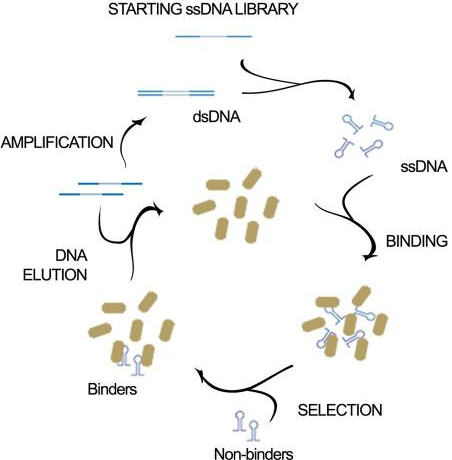
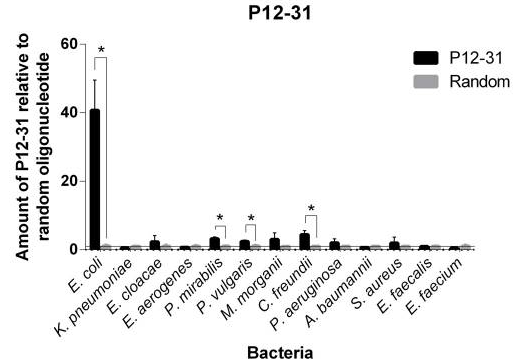
This aptamer is a single stranded DNA oligonucleotide (78 bp) which can bind to Escherichia coli ATCC 25922. It was inspired from the P12-31 aptamer generated using cell-based Systematic Evolution of Ligands by EXponential enrichment (cell-SELEX) by Cardoso et. al., which is shown in Figure 1. 12 bacterial strains were used in binding assays. The P12-31 aptamer has at least ten-fold stronger binding to E. coli than to the other twelve bacterial species tested, indicating that this aptamer is highly specific for E. coli, as shown in Figure 2.
Aptamer Kd determination was performed by qPCR of the aptamer bound to bacterial cells after the incubation of 106 bacterial cells with increasing concentration of the aptamer (6.25 nM, 12.5 nM, 25 nM, 50 nM, 100 nM, 200 nM and 400 nM), followed by washing steps. Kd value was determined by Linewaver-Burk analysis. The Kd = 87.03 ± 17.32 and Bmax = 0.56 ± 0.04 for P12-31.
Sequence and Features
- 10COMPATIBLE WITH RFC[10]
- 12COMPATIBLE WITH RFC[12]
- 21COMPATIBLE WITH RFC[21]
- 23COMPATIBLE WITH RFC[23]
- 25COMPATIBLE WITH RFC[25]
- 1000COMPATIBLE WITH RFC[1000]
Modelling
2D folding of Aptamer
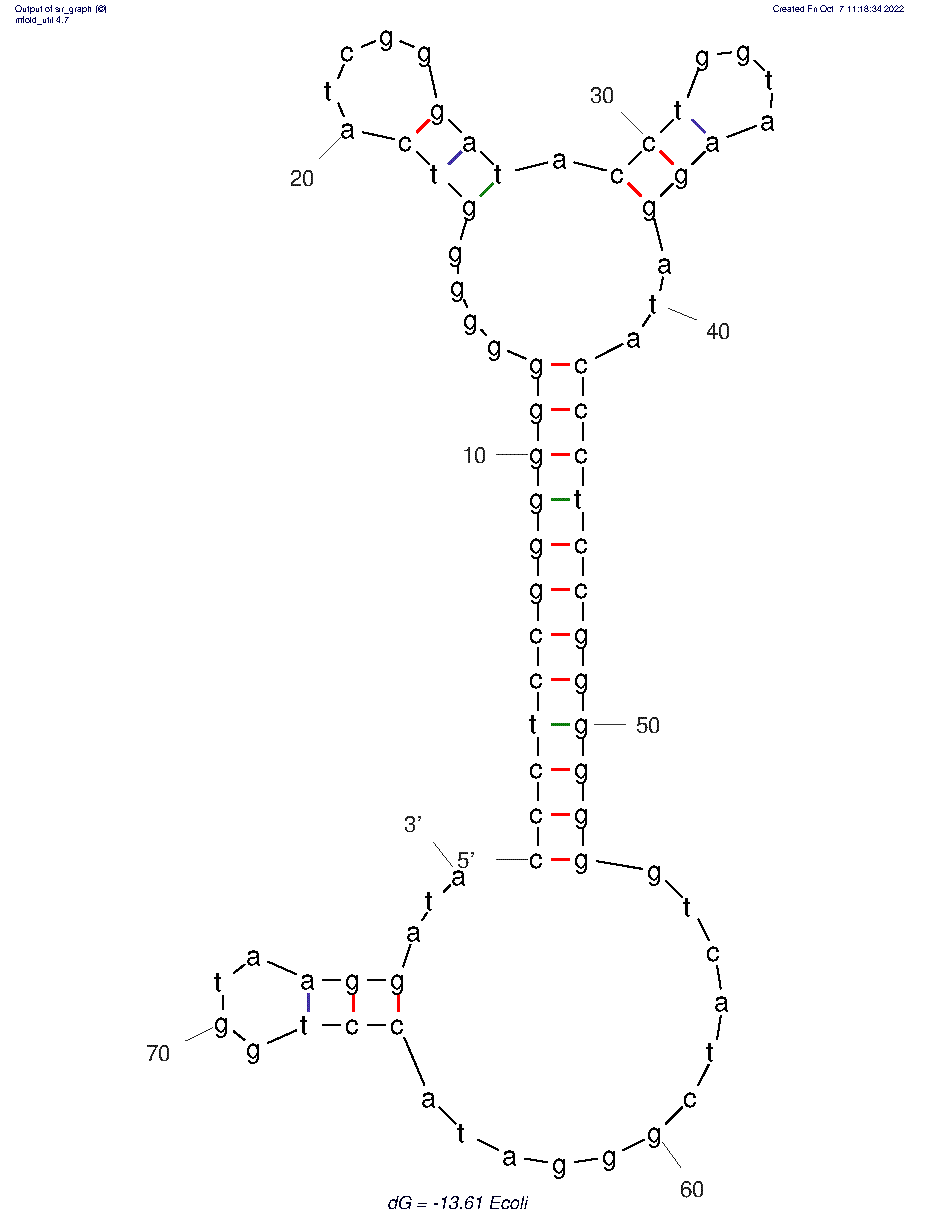
The 2D folded structure of the aptamer was generated using mFOLD (UNAFOLD web server). The input was the DNA aptamer sequence and default parameters 37°C, 1.0M Na+ and 0.0M Mg++, linear DNA, oligomer correction, 5 percent suboptimality. 3 structures were generated with structure 1 dG = -6.75 kcal/mol, structure 2 dG = -5.92 kcal/mol and structure 3 dG = -13.07 kcal/mol. Model-Fig-1 shows the least energy (most stable) structure 1.
3D structure of Aptamer
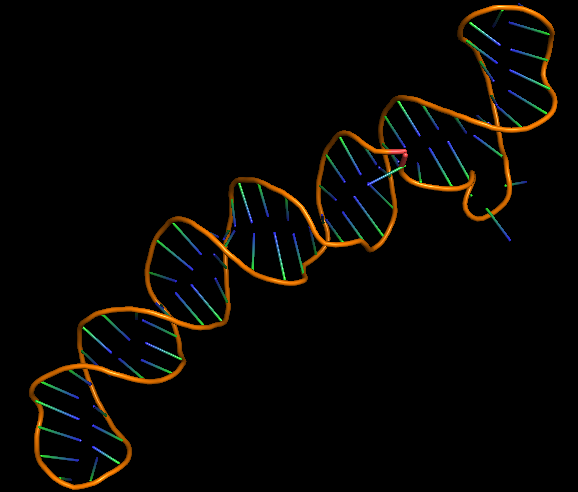
The 3D folded structure of the aptamer was generated using Xiao Lab 3dRNA/DNA - An RNA and DNA tertiary structure prediction method (http://biophy.hust.edu.cn/new/3dRNA/create). The input was the DNA aptamer sequence, the 2D structure in Vienna format, obtained from mFOLD and parameters molecule type DNA, Procedure Best, # of Predictions 5. No changes were made in Advanced options. Model-Fig-2 shows the most stable folded 3D structure.
Identifying Binding Target
Since the aptamer was selected using cell-SELEX, the exact target it binds to on E. coli is not known. Assuming the aptamer binds to an E. coli membrane/surface protein, attempt to identify a possible target was done in the following manner:
- The membrane proteins/peptides of E. coli were identified on RSCB PDB
- The proteins/peptide sequences were converted into vectors and subjected to k-mean clustering in KAMI-Kwick Aptamer-based Motif Identification, a software developed by 2022 iGEM team IISER_Mohali (https://2022.igem.wiki/iiser-mohali/software). 10 clusteres were obtained.
- The cluster centers were docked using HEX 8.0.0 software or HDOCK server.
- The best docked cluster center was identified - the cluster center sequence giving best docked model (highest confidence score on HDOCK or lowest binding energy on Hex) with aptamer.
- 10 random elements of the best docked cluster center were docked with the aptamer using HEX 8.0.0 software or HDOCK server.
- The protein with the best docking to the aptamer (least binding energy/best docking score) was identified.
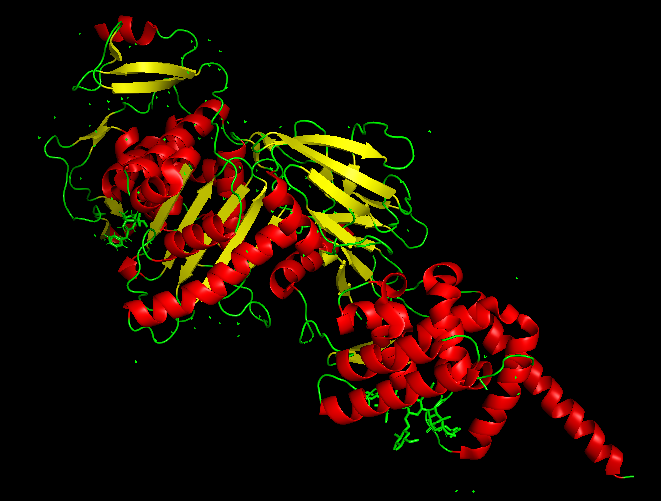
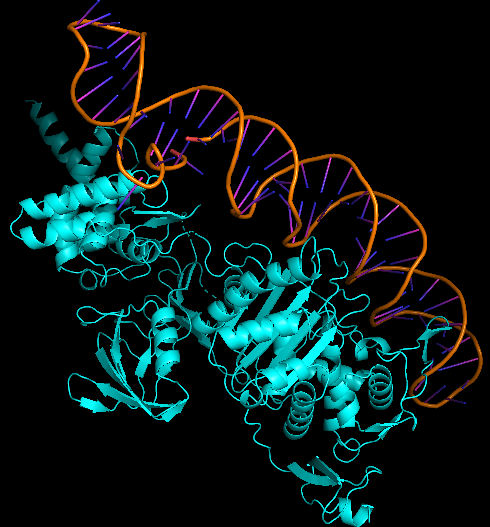
The best docked protein with the aptamer was identified as E. coli PBP1b (PDB ID 5HL9), shown in Model-Fig-3. This is most probably the protein that the aptamer binds to. Model-Fig-4 shows the best docking configuration (least energy) of 5HL9 and aptamer.
Molecular Dynamics Simulation
Model-Media-1. Molecular Dynamics Simulation of Aptamer binding with E. coli PBP1b (5HL9) (click to view)
To determine the binding efficacy and stability of the protein-DNA aptamer binding, molecular dynamics was performed using GROningen MAchine for Chemical Simulations (GROMACS 2022.3) (https://www.gromacs.org/). The ‘AMBER99SB-ILDN protein, nucleic AMBER94’ force field was used for the simulation of the systems. VMD 1.9.3 software was used for visualizing the systems. Model-Media-1 shows the Molecular Dynamics movie of Aptamer interacting E. coli PBP1b (PDB ID 5HL9).
Characterization
We ordered our DNA aptamers from IDT as 2 μmole DNA oligo in standard desalting conditions. We resuspended the lyophilized aptamer with 0.1 molar PBS.Then we measured the Cyclic voltammetry and impedance of the bare Glassy Carbon electrode before modifying it with GO/PANI solution. We then tested the sensitivity of aptamer to E. coli ATCC 25922.
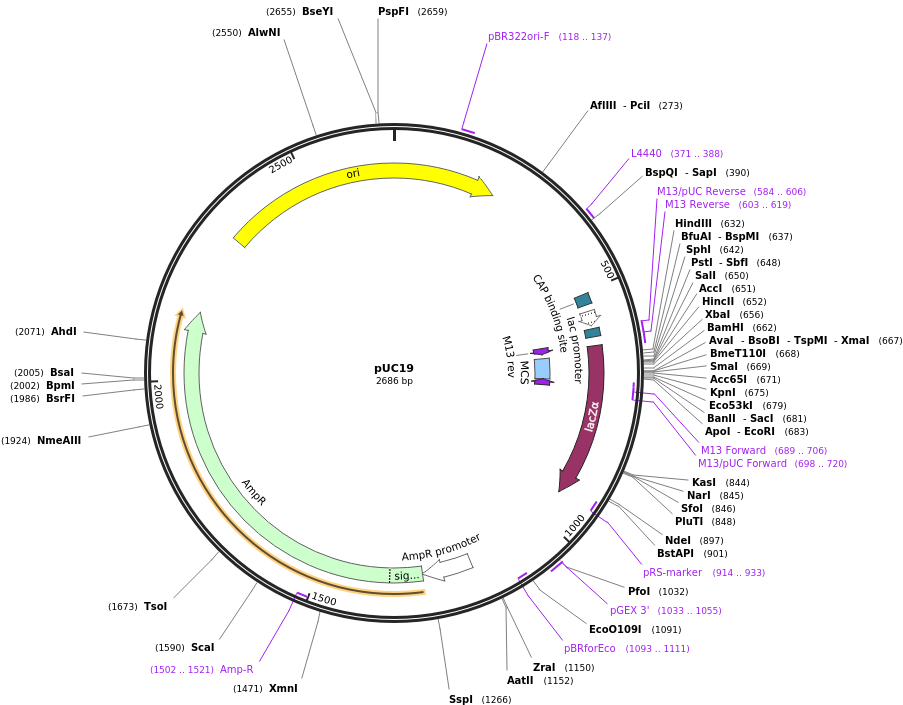
We have also cloned the aptamer into pUC19 vector (shown in Char-Fig-1) by restriction digestion using Xba1 and BamH1. This was followed by transformation into Escherichia coli DH5α.
Fixing of Aptamers on GO/PANI and electrochemical characterization
- Graphene oxide (GO) was prepared using a modified Hummer method.
- A conducting polymer Polyaniline (PANI) was mixed into a GO in order to improve its functionalities and charge conduction value that can form a suitable interaction with the aptamer molecule.
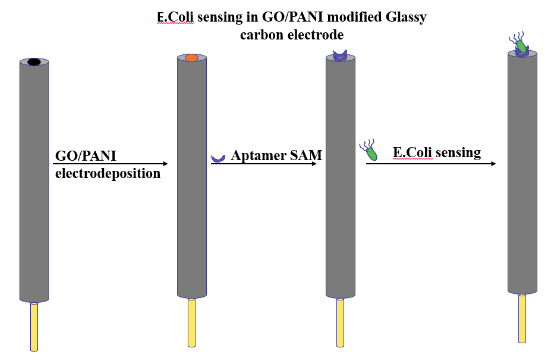
- GO/PANI was electrodeposited onto a glassy carbon (GC) electrode.
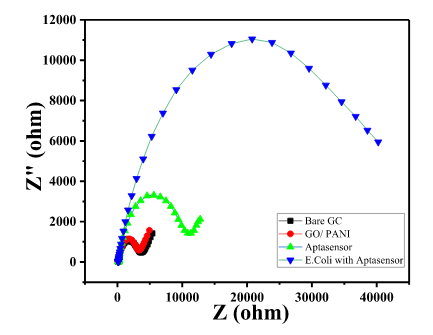
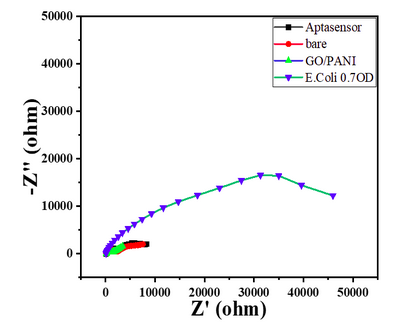
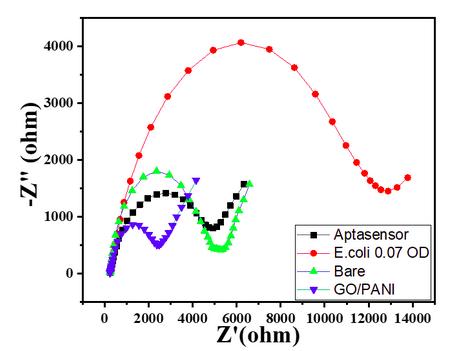
- Bare GC showed a small semicircle in the high-frequency region with the calculated RCT value of 3300 Ω, as shown in Char-Fig-3.
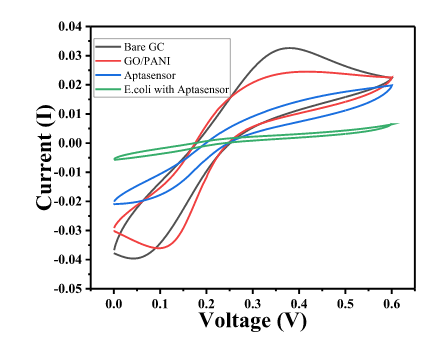
- The Cyclic Voltammetric (CV) and Electrochemical impedance spectroscopy (EIS) response of GC was measured in 1 mM Fe3+/Fe2+ solution in 0.1M PBS.
- EIS was measured in the frequency range from 100 kHz to 10 mHz, ∆E value of the CV is shown by Char-Fig-4
- The lyophilized aptamer was diluted with 0.1M PBS solution to 250nM aptamer and was used for Self-assembled monolayer (SAM) formation.
- 10µL of aptamer solution was drop cast on the modified GC and was kept for drying overnight (12h) at 4 °C.
- The SAM aptasensor was then dropcast with the E. coli and kept to dry and its electrochemical response was measured.
- The Nyquist plot of the electrode where the aptamer molecule shows an increase in the RCT value to 11000 (Char-Fig-3) showing the successful assembly of the aptamer layer on the modified GC.
- The nyquist response shows a huge increase in the R CT value to 40000 Ω showing the complete coverage of E. coli by the biosensor. Refer to Char-Fig-3
Sensitivity testing of E. coli Aptamer using Electrochemical measurements
- 2 different GCs were taken and modified with GO/PANI mixture. Further, they were deposited with the aptamer specific to E. coli ATCC25922.
- After successful immobilization of the aptamer, CV and Impedance was measured.
- Then we drop-casted one of the aptamers attached over modified GC with 8μL of the sample containing microbe of conc. 16 x 108 bacterial cells/ml (0.7 OD) and another with concentration of 1.6 x 10⁸ (0.07 OD) bacterial cells/ml.
- We performed EIS after the drop-casted solution dried up when left at 40ºC for 25 minutes.
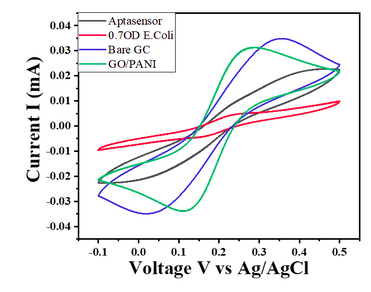
- For E. coli concentration of 0.7 OD, CV responses show a decrease in the current value with the given potential window (Char-Fig-5)
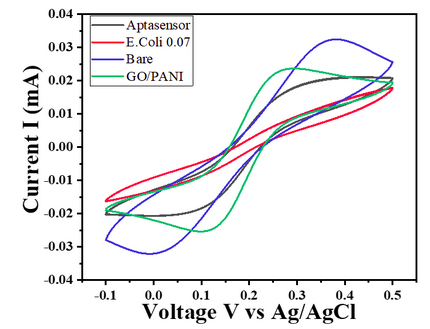
- Char-Fig-6 shows the CV of the 0.07 OD E.coli, showing a similar response as that of 0.7 OD E. coli.
- The CV curve for the 0.7 OD E. coli assembled aptasensor is more horizontal than the other concentration of 0.07 OD, showing the current is hindered more in 0.7 OD.
- Nyquist plot for 0.7 OD concentration of E. coli(Char-Fig-7) shows RCT value of 5000 Ω.
- 0.07 OD (Char-Fig-8) shows RCT value of 13800 Ω
References
[1] Marton S, Cleto F, Krieger MA, Cardoso J. Isolation of an Aptamer that Binds Specifically to E. coli. PLoS One. 2016 Apr 22;11(4):e0153637. doi: 10.1371/journal.pone.0153637. PMID: 27104834; PMCID: PMC4841571.
[2] Zhao, Y., et al., Automated and fast building of three-dimensional RNA structures. Scientific Reports, 2012. 2: p. 734.
[3] Mfold web server for nucleic acid folding and hybridization prediction. Nucleic Acids Res. 31 (13), 3406-15, (2003)
[4] Chergui, S., Rhili, K., Poorahong, S., & Siaj, M. (2020). Graphene Oxide Membrane Immobilized Aptamer as a Highly Selective Hormone Removal. Membranes, 10(9). https://doi.org/10.3390/membranes10090229
[5] Subramanian, P., Lesniewski, A., Kaminska, I., Vlandas, A., Vasilescu, A., Niedziolka-Jonsson, J., . . . Szunerits, S. (2013). Lysozyme detection on aptamer functionalized graphene-coated SPR interfaces. Biosensors and Bioelectronics, 50, 239-243. https://doi.org/https://doi.org/10.1016/j.bios.2013.06.026
[6] https://2021.igem.org/Team:Rochester/Experiments
[7] Gupta, Ritika, et al., Naked eye colorimetric detection of Escherichia coli using aptamer conjugated graphene oxide enclosed Gold nanoparticles, Sensors and Actuators B: Chemical. https://doi.org/10.1016/j.snb.2020.129100
[8] H.M. Berman, J. Westbrook, Z. Feng, G. Gilliland, T.N. Bhat, H. Weissig, I.N. Shindyalov, P.E. Bourne. (2000) The Protein Data Bank Nucleic Acids Research, 28: 235-242.
[9] hdock.phys.hust.edu.cn/
[10] http://hex.loria.fr/
[11] H. Bekker, H.J.C. Berendsen, E.J. Dijkstra, S. Achterop, R. van Drunen, D. van der Spoel, A. Sijbers, and H. Keegstra et al., “Gromacs: A parallel computer for molecular dynamics simulations”; pp. 252–256 in Physics computing 92. Edited by R.A. de Groot and J. Nadrchal. World Scientific, Singapore, 1993.
[12] H.J.C. Berendsen, D. van der Spoel, and R. van Drunen, “GROMACS: A message-passing parallel molecular dynamics implementation,” Comp. Phys. Comm., 91 43–56 (1995).
[13] S. Pronk, S. Páll, R. Schulz, P. Larsson, P. Bjelkmar, R. Apostolov, M.R. Shirts, and J.C. Smith et al., “GROMACS 4.5: A high-throughput and highly parallel open source molecular simulation toolkit,” Bioinformatics, 29 [7] 845–854 (2013).
| target |

