
Part:BBa_K2984019
L1c-Psad-YFP-RbcS2, Expression of YFP through light-inducible promoter
This part is a part of the Chlamy-HUB-Collection . This Level 1 construct is designed for comparison of locus dependent expression through fluorescence intensity measurements. The Construct consist of the PsaD promoter promoter a coding sequence for the yellow fluorescent protein mVenus and the Rbcs2 Terminator. The promoter is inducible by light.
Usage and Biology
This construct is designed for the expression of the yellow fluorescent protein (YFP) mVenus in C. reinhardtii and can be used to compare expression in dependency of the insertion locus. It is composed of the PsaD promoter, which stems from the photosystem one complex, the mVenus coding sequence and the Rbcs2 Terminator, taken from the Rubisco gene. This construct will make C. reinhardtii glow under a fluorescence microscope.
The YFP mVenus has an excitation peak at 515 nm and an emission peak at 528 nm (Kremers et al. 2006).
Sequence and Features
- 10INCOMPATIBLE WITH RFC[10]Illegal PstI site found at 1046
- 12INCOMPATIBLE WITH RFC[12]Illegal PstI site found at 1046
- 21INCOMPATIBLE WITH RFC[21]Illegal BamHI site found at 4
- 23INCOMPATIBLE WITH RFC[23]Illegal PstI site found at 1046
- 25INCOMPATIBLE WITH RFC[25]Illegal PstI site found at 1046
Illegal NgoMIV site found at 1523 - 1000COMPATIBLE WITH RFC[1000]
Characterization
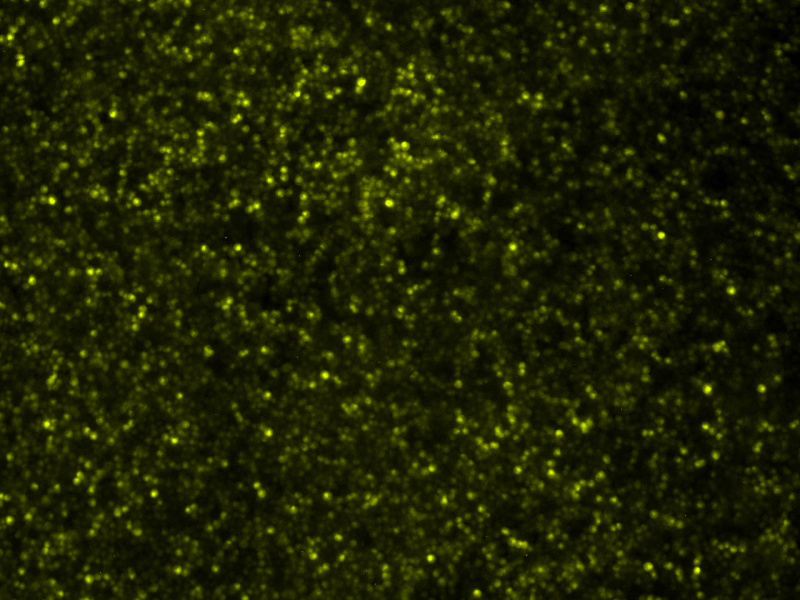
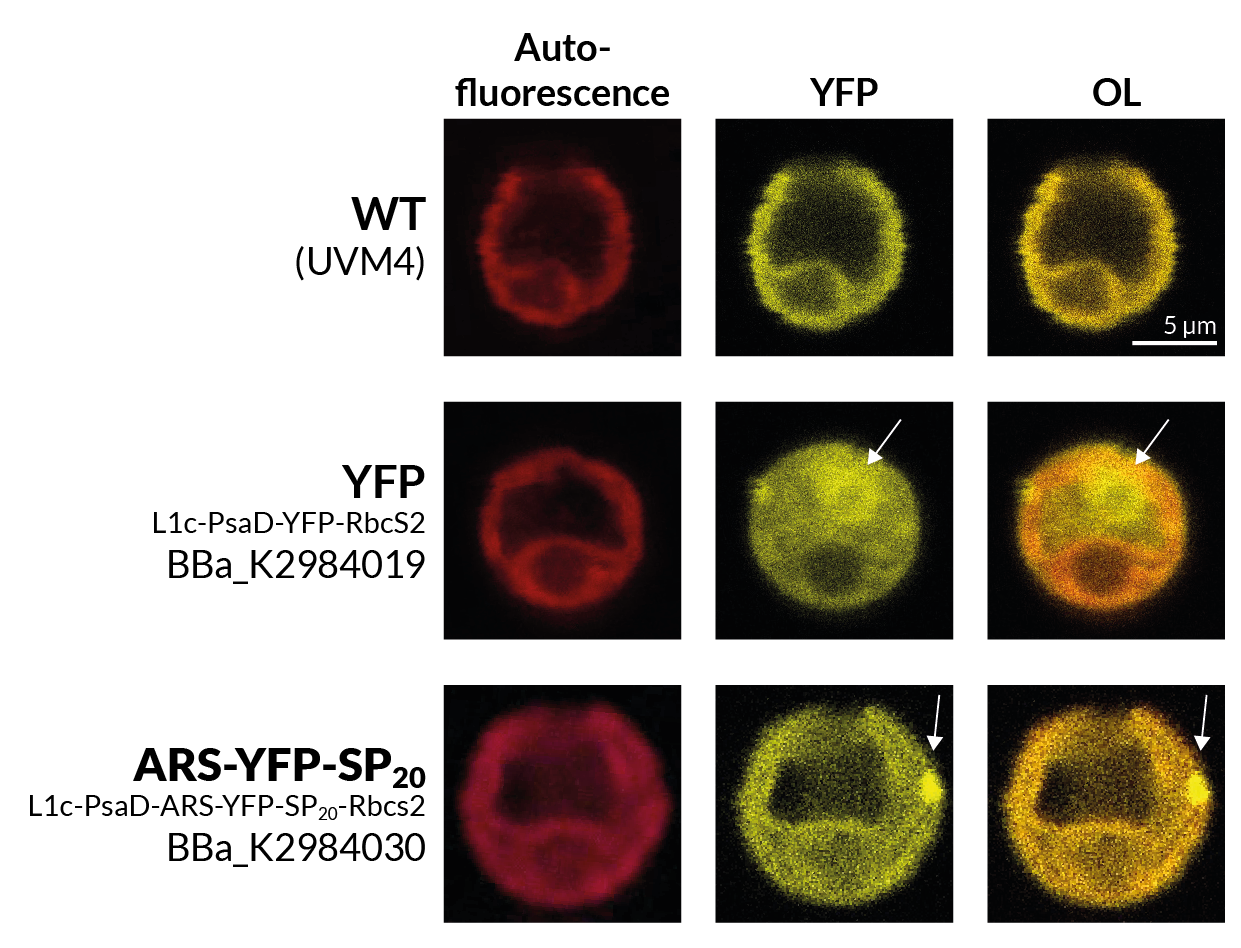
The first qualitative characterization we made was to check the mVenus fluorescence of C. reinhardtii that had been transformed with this construct under a fluorescence microscope.
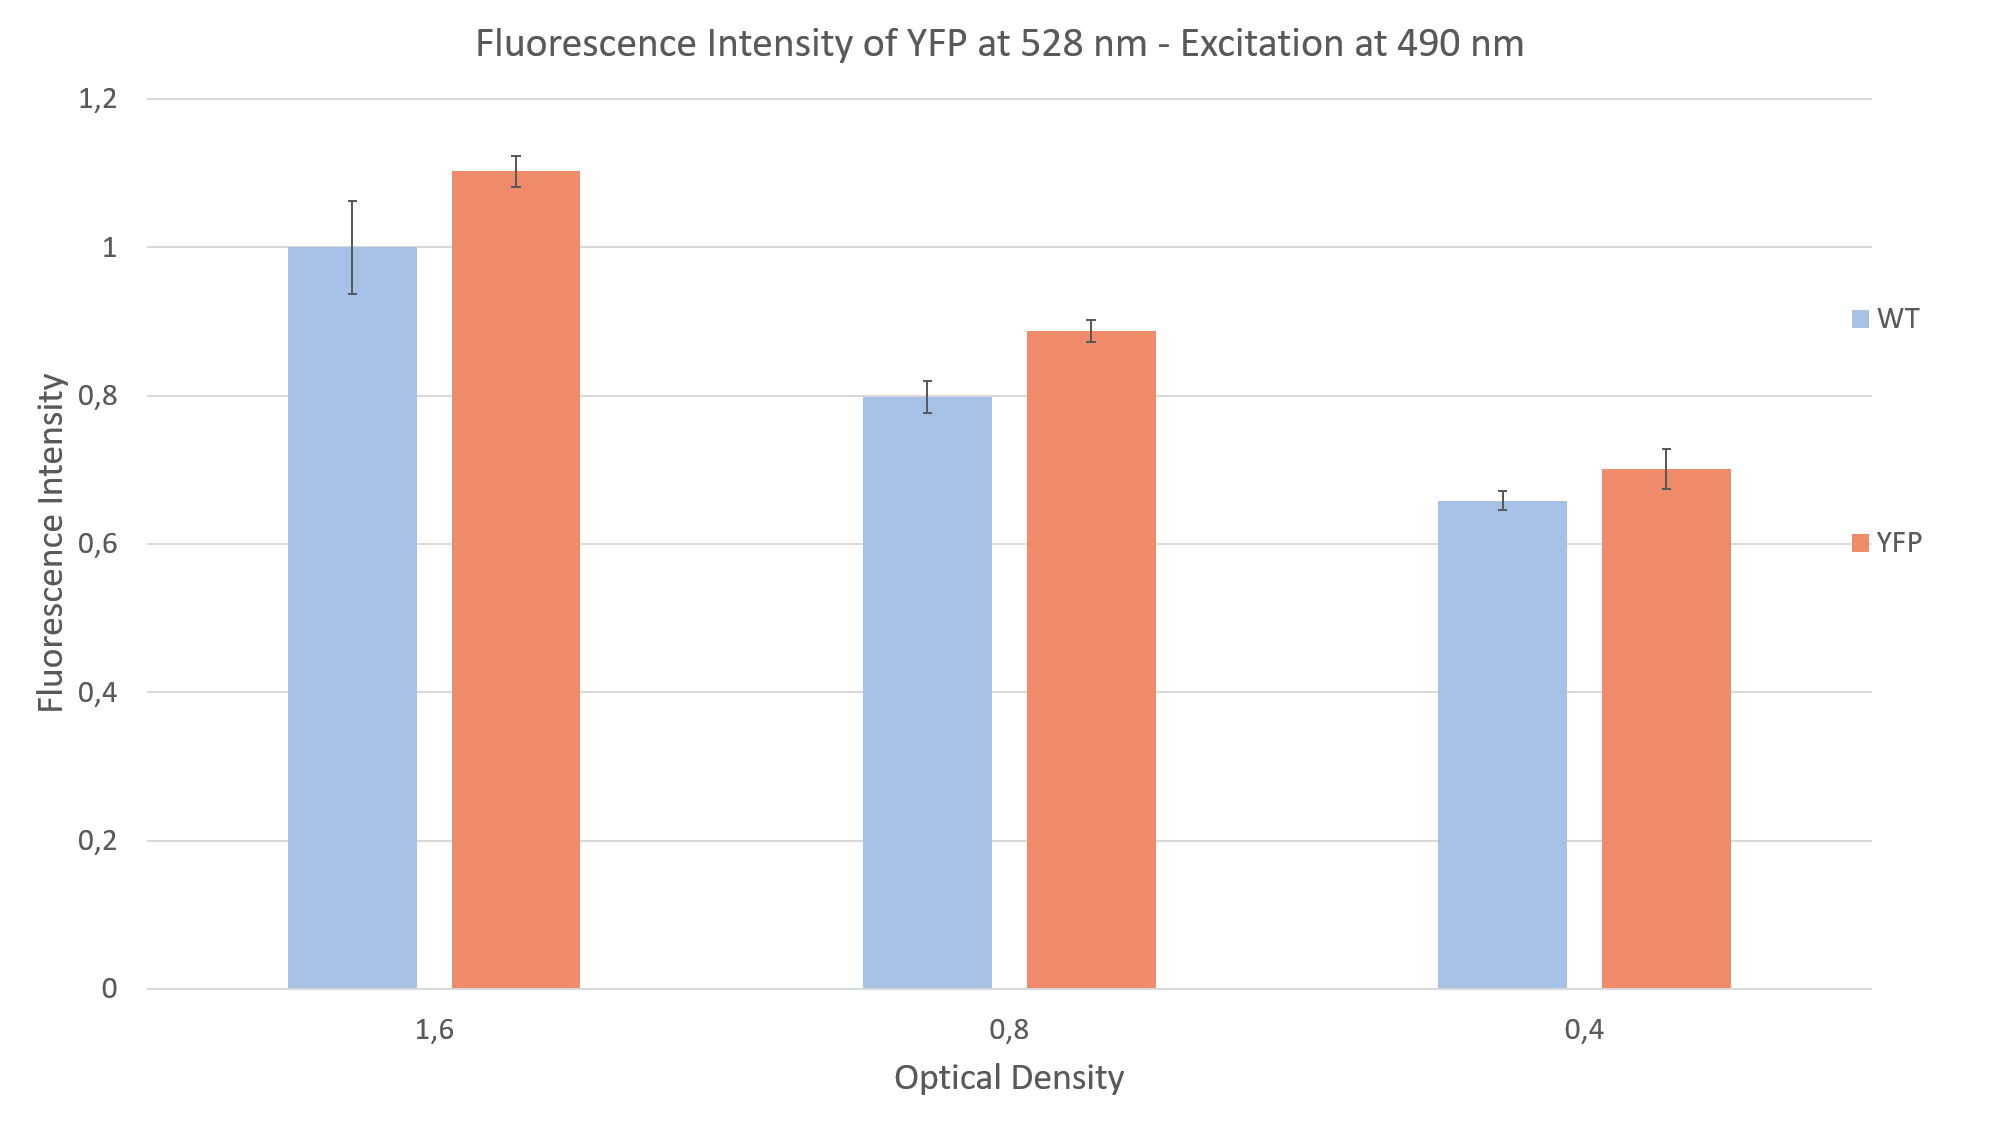
After seeing fluorescence under the microscope, we proceeded to measure the fluorescence intensity of our clone under a plate reader (Fig. 2). Measuring the fluorescence intensity of YFP in C. reinhardtii can be quite challenging, due to the strong interaction of the algae with light (photo systems, chlorophyll, pigments and light antennae). You can find more information about how to measure this part on the measurements siteof the Humboldt Berlin team 2019.
For the measurement we prepared YFP expressing clones and WT algae, to compare the fluorescence of both probes. This is imperative due to the strong autofluorescence of the algae. Additionally, we made sure to have the same optical density (cell concentration) in both YFP and WT probes. We did a sequential dilution in three steps with the probes and measured the fluorescence intensity for each probe. We excited at 490 nm and measured the emission at 528 nm. We were able to show that the fluorescence intensity of the YFP expressing clones was always above the autofluorescence of the wild type, as can be seen in Fig. 2.
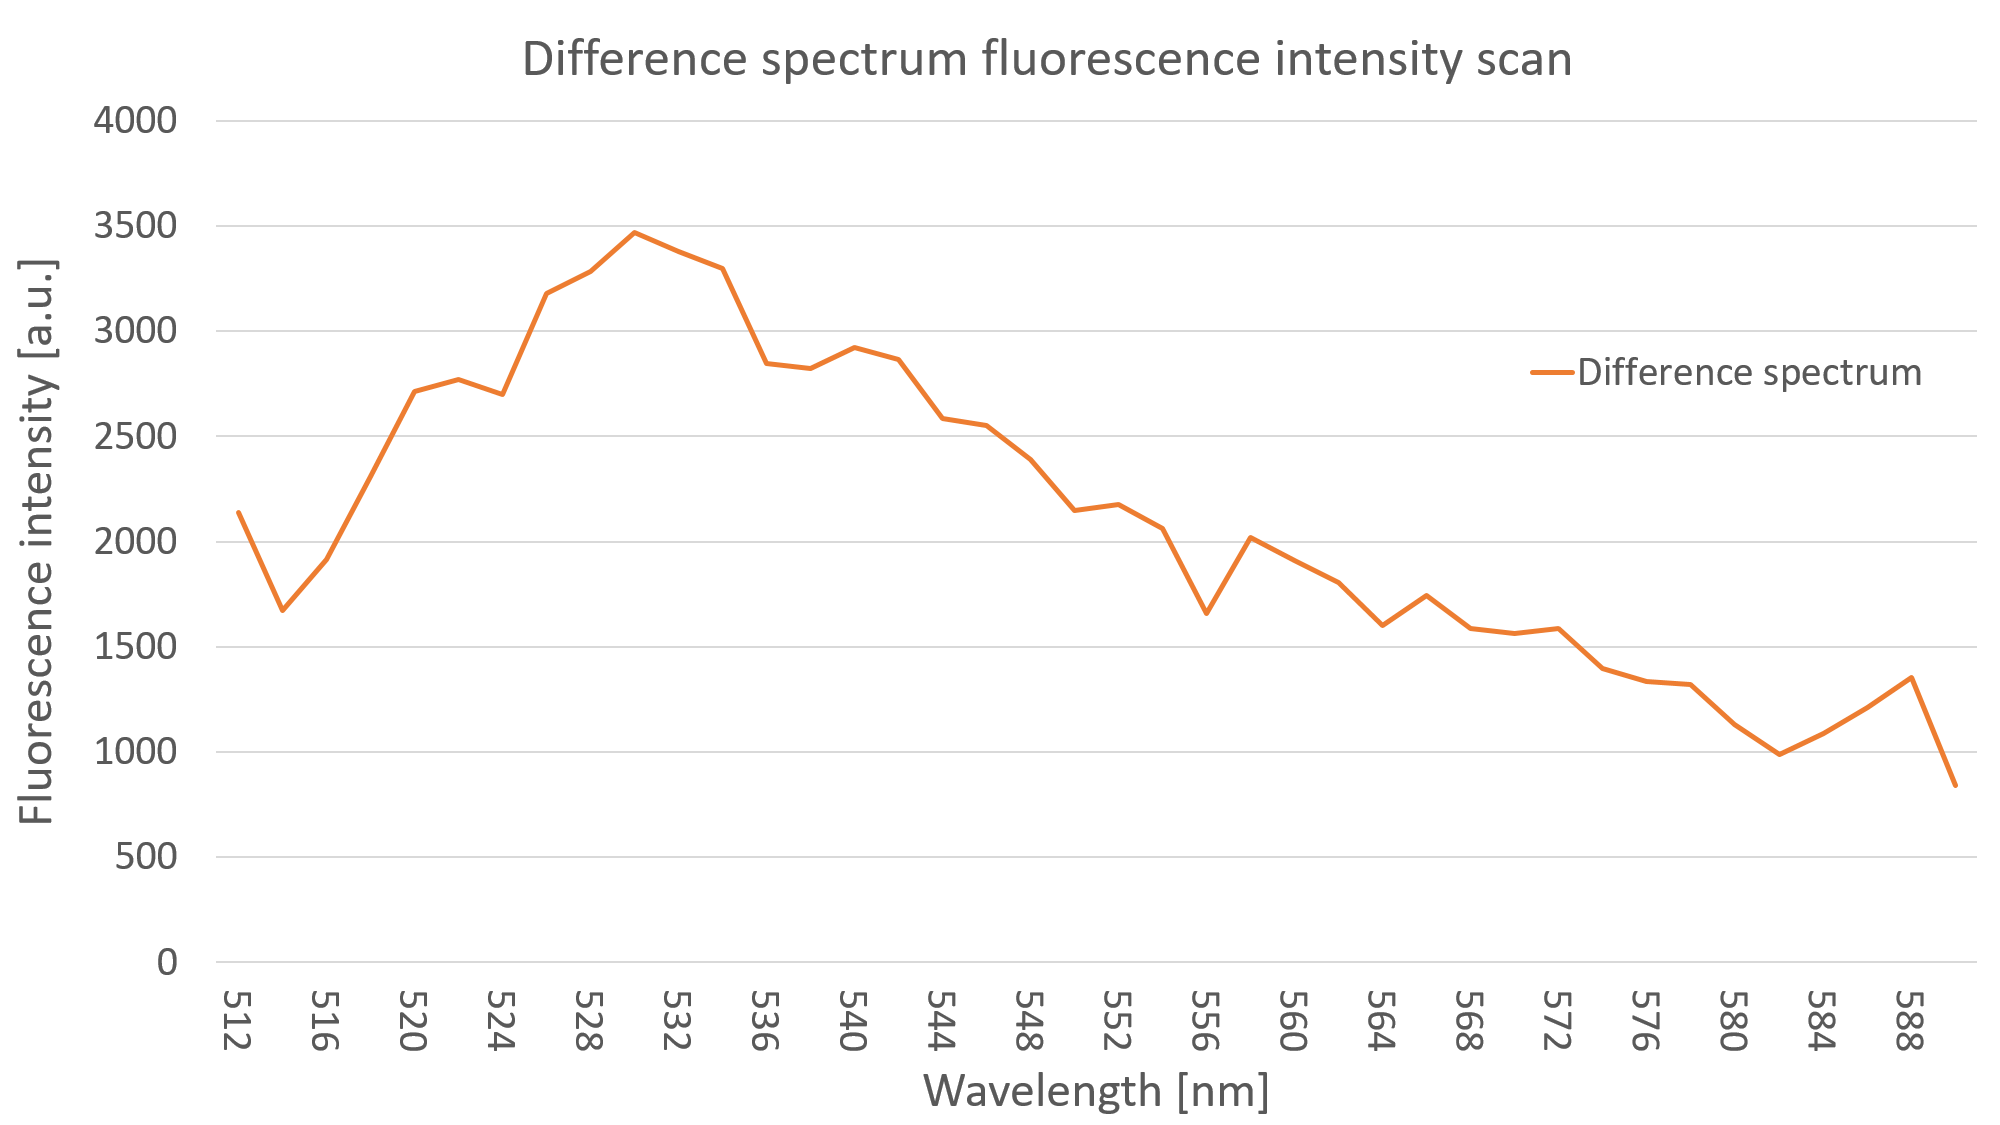
After measuring the fluorescence intensity we also measured the emission spectrum of mVenus in C. reinhardtii by doing an emission scan of both YFP expressing clones and WT algae. By doing a difference spectrum of the fluorescence emission spectra of the mentioned probes, we received the emission spectrum of YFP, as can be seen on Fig. 3.
Psad Characterization - Light induced expression of YFP
As further characterization of the PsaD promoter, we wanted to see if the part is influenced by light. Therefore, we prepared three different sets of algae 3 days in advance. The first two included C.reinhardtii algae which expressed this composite part. the third one inlcuded our wt algea strain UVM 4. The first and the second were grown under synchronous light conditons, meaning they were exposed to light for 14 hours and to darkness for 10 hours. The second set remained in darkness the hole time. All three were constantly shaken at speed of 110 round per minute while temperature was set to 21,4°C. The algea were grown in a black 96-well plate. After three days of growth we startet a time resolved fluorescence intensity measurement. The same parameters were used, as for the measurements above. We measured every 20 minutes for approximately 20 hours. Covering the transition from subjective day to night. During the phase of subjective night the plate remained in darkness inside the plate reader, or outside under a light source at subjective day. It is important to shake the plate with algae between measurements to avoid the aggregation of algae on the bottom of the wells, which ultimately affects the measurement of the YFP.
In the following the first and second set are described as YFP-sync and YFP-dark alluding to the different growth conditions. The thrid set is refferd to as YFP-wt . Figure 5 is showing the result for the YFP-sync time resolved measurement. The blue plot represents the flourescence intensity while the red line shows the course of the optical density. The grey backround indicates subjective night. It can be seen that the flourescence shows a clear rise with the beginning of the day phase. The optical density however seems to show no reaction to the change of light intensity (as expected).

One argument might be, that the flourescence signal (and therfore the mVenus expression) rises due to synchronisation of the cells. To verify the effect of light onto the expression of the mVenus we prepared the YFP-dark set, as can be seen on Fig. 6. Hereby we aimed to verify that the effect is caused by the light induction and not by syncronization of the algae.

Compared to the fluorescence intensity (FL) of YFP-sync, the same rise is observable with begin of the light phase (figure 6). In contrast to figure 6 the optical desity (OD) of the YFP-dark set shows a short rise in value, follwed by a decrease shortly after. The fluctuation of the optical density does not seem to correlate with the fluorescence intensity. Even though the rise of OD and FL appear at the same time, the FL remains higher. As we described above Chlamydomonas reinhardtii shows a strong autoflourescence. To assess the impact of the autofluorescence we measured our wildtype strain UVM 4 as well. The result is depicted in figure 7:

The wildtype FL only changes slightly during the time of measurement. With beginning of the lightphase a small dip can be observed. Which seems to be corresponds do the rise of the OD. It is notable that the OD for of the wildtype meaurement as well as the YFP-dark measurement (figure 6) show the same type fluctuation at the beginning of the light-phase. We are uncertain how to interpret these fluctuations and think they might be artefacts.
These measurements seem to confirm that the PsaD promoter is light inducible.
References
- Kremers, G. J., Goedhart, J., van Munster, E. B., & Gadella, T. W. (2006). Cyan and yellow super fluorescent proteins with improved brightness, protein folding, and FRET Förster radius. Biochemistry, 45(21), 6570-6580.
| chassis | C. reinhardtii |
| emission | 528 nm |
| excitation | 515 nm |