Part:BBa_K2571001
Bifunctional gamma-glutamate-cysteine ligase/Glutathione synthetase
Usage and Biology
Glutathione (GSH) is an important antioxidant that is a sulfur compound; a tripeptide composed of three amino acids (cysteine, glycine and glutamic acid) and a non-protein thiol (Pizzorno, 2014; Lu, 2013). Similar to cysteine, glutathione contains the crucial thiol (-SH) group which benefits to its efficiency as an antioxidant (“Glutathione”, 2005). As a substrate for glutathione S-transferase, which reacts with a number of harmful chemical species, such as halides, epoxides, and free radicals to form harmless products (“Glutathione”, 2005). GSH is generally found in the thiol-reduced from which is crucial for detoxification of ROS and free radicals which cause oxidative stress. (Lu, 2013; Burton & Jauniaux, 2011).
Figure represents the predicted three-dimensional structure Bifunctional gamma-glutamate-cysteine ligase from Streptococcus Thermophilus . The protein structure of Bifunctional gamma-glutamate-cysteine ligase was constructed by using Amber 14. It is demonstrated in the ribbon diagram which is done by interpolating a smooth curve through the polypeptide backbone. The colors indicate the amino acids in the protein structure. While constructing, the codon bias rule is obeyed to express the enzyme in Escherichia Coli KO11.
During bioethanol production, furfural, HMF and reactive oxygen species (ROS) occur which are converted to less toxic alcohols by oxidoreductases (Ask et al, 2013). Reactive Oxygen Species are dangerous substances that distort protein based matters by taking electrons (Lu, 2013). The chemical structure of the protein-based substances are altered and become dysfunctional because of ROS (Lu, 2013; Burton & Jauniaux, 2011). Furthermore, one of the most significant protein-based substance, DNA get attacked by OH radicals (Burton & Jauniaux, 2011). These attacks cause severe damages to the DNA such as cross-linkages, chromatin folding and strand breakages (Burton & Jauniaux, 2011). However, the reduced form GSH can protect the chemical structure of the proteins by giving extra electrons to the ROS and free radicals (Lu, 2013). This is accomplished by GSH peroxidase-catalyzed reactions (Lu, 2013). When GSH give away its electron, it oxidizes to GSSG (disulfide-oxidized Glutathione ). Then, GSSG is reduced to GSH at the expense of NADPH by Glutathione reductase.
However, the detoxification of ROS and conversion of furfural and HMF result in a more oxidized intracellular environment that deteriorates the antioxidant defense system of the cell (Ask et al., 2013).
Characterization
Allergen Characterization:
Our parts can be used in ethanol production and we used it in the lab for mass production, it was important to construct an allergenicity test. The allergenicity test makes a comparison between the sequences of the biobrick parts and the identified allergen proteins in the database. If the similarity between the biobricks and the proteins is high, it is more likely that the biobrick is allergenic. In the sliding window of 80 amino acid segments, greater than 35% means similarity to allergens. Higher similarity implies that the biobricks have a potential for negative effect to exposed populations. For more information on the protocol see the “Allergenicity Testing Protocol” in the following page http://2017.igem.org/Team:Baltimore_Bio-Crew/Experiments
Our biobrick part, BBa_K2571001 showed less than 35% match in the 80 amino acid alignments by FASTA.
Gel Characterization:
GSH basic part is inserted into the pSB1C3 backbone. The construct in pSB1C3 is for submission to the registry and is cultivated in DH5 alpha.
FucO and VR primers are as below:
FucO left: GTGATAAGGATGCCGGAGAA
VR: ATTACCGCCTTTGAGTGAGC
Biochemical Characterization:
We inserted our basic part K2571001 which is a protein coding region, in pSB1A3 backbone with a strong promoter, an RBS and a double terminator in order to test the function.
We designed our biochemical characterization experiments in order to evaluate the effects of our circuits on life span, cell mass, and ultimately the bioethanol yield of ethanologenic E. coli strain KO11. We carried out two experimental assays simultaneously.
In both of our biochemical assays, we had four cultured groups of KO11 ethanologenic strains of E.coli to test.
1. KO11 un-engineered,
2. KO11 with only FucO,
3. KO11 with only GSH,
4. KO11 with Bio-E (both FucO and GSH).
First Assay:
Throughout our first assay, each group was grown in LB broth mediums containing 2% glucose and antibiotics.
To culture group #1 (KO11 un-engineered), we only added Chloramphenicol at a final concentration of 40 µg/mL since KO11 un-engineered only had resistance to Chloramphenicol in its genome; and to the mediums of the groups numbered 2, 3 and 4; we added Chloramphenicol at a final concentration of 40 µg/ml and 100 µg/ml Ampicillin. The reason was; groups 2, 3 and 4 had plasmids which carried Ampicillin resistance due to their backbone (pSB1A3). Thus, with the addition of antibiotics to the mediums, selectivity was assured.
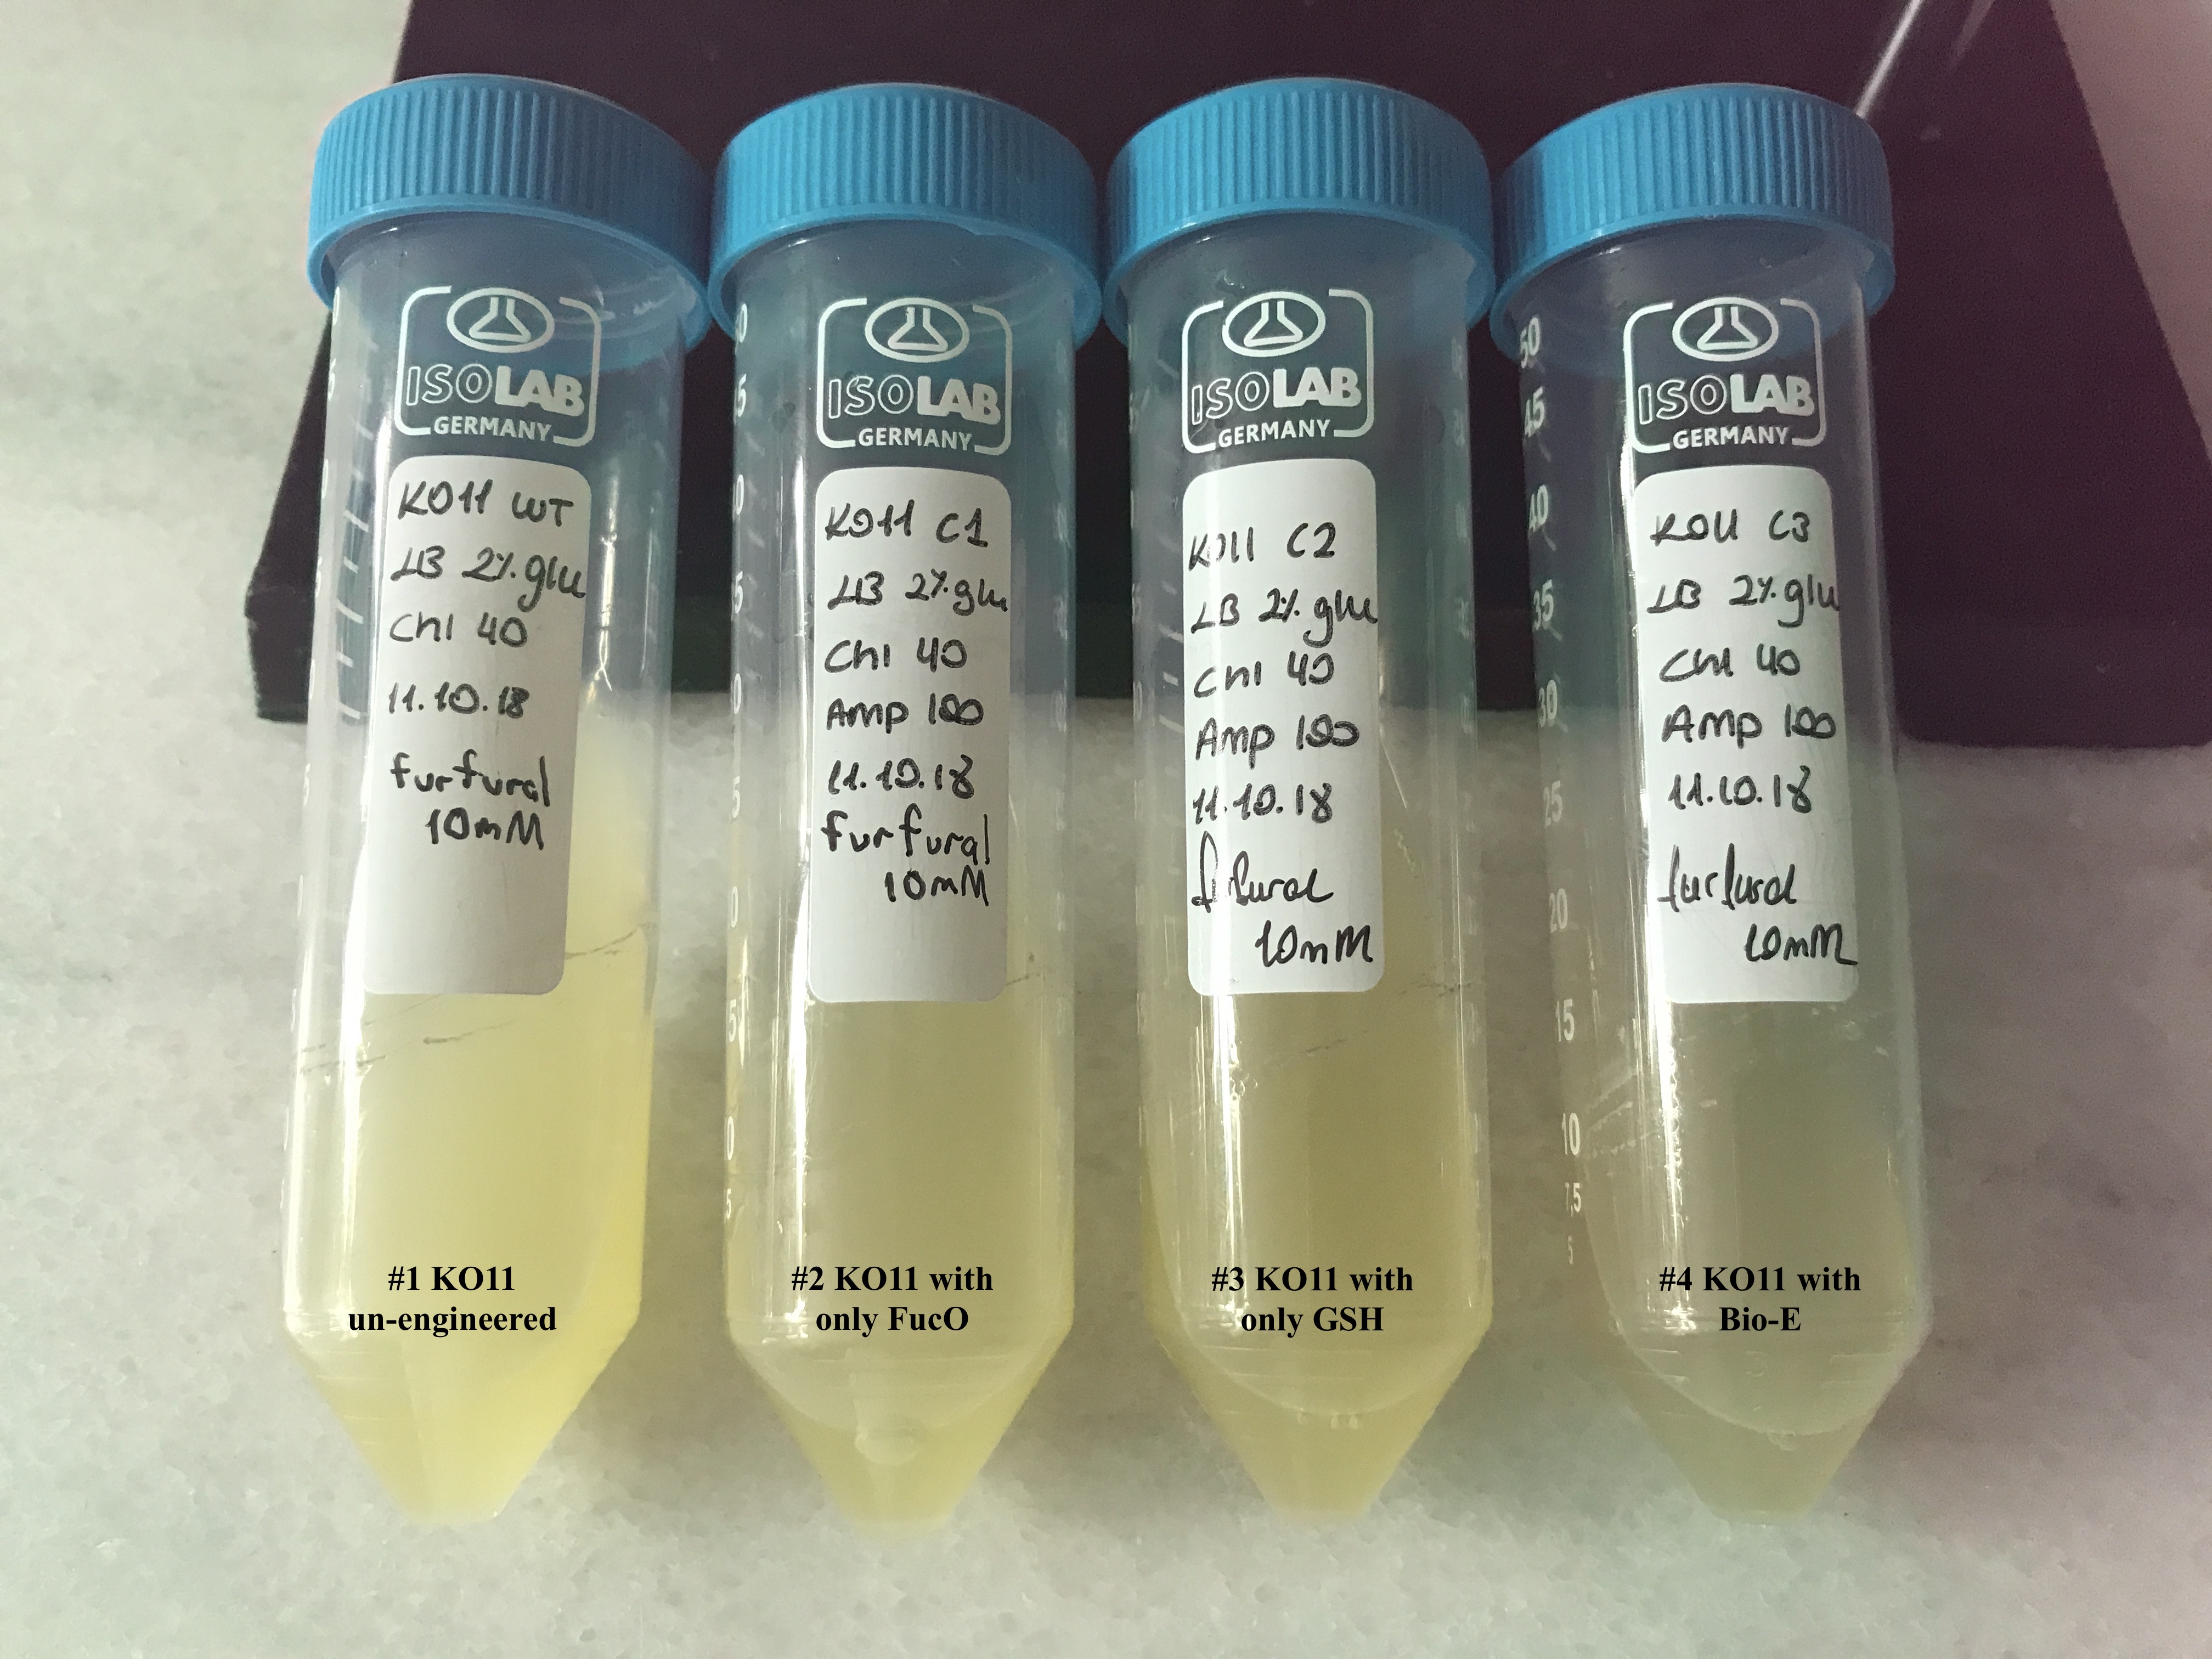
Cultures were grown overnight, and refreshed in the morning as two sets (First set: 10 mM furfural, 2nd set: 20 mM furfural). After approximately two hours of incubation for both of the sets’ falcon groups (when they reached OD 0,6), furfural was added to their mediums.
First Set (10 mM furfural):
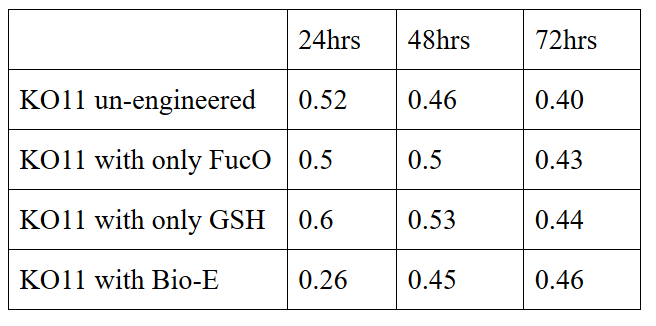
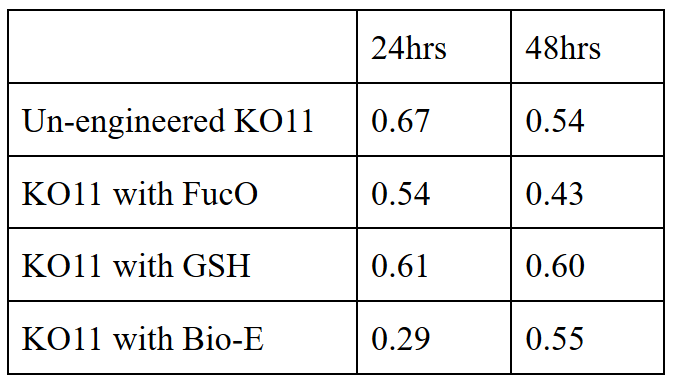
We added furfural at a final concentration of 10 mM to the first four test groups’ mediums and took OD measurements at Abs 600 nm with 1/10 dilution in 24 hour time intervals.
10 mM furfural OD measurements: Abs 600 nm (1/10 dilution):
Analysis of data:
Our data demonstrated that group #1 (un-engineered) had a decrease in cell mass throughout the time verifying the inhibition of cell growth in the presence of furfural in the field. Group #2 (KO11 with only FucO) obviously gave better results with respect to un-engineered KO11. However, although the cell mass of the KO11 group with only FucO was stable in the first 48 hours, it was decreased after the 48th hour. This proves that only the presence of the gene FucO in the bacteria wasn’t enough to avoid cell mass decrease in the long term and is in need of another gene for increased tolerance. Also, only GSH’s presence isn’t enough since the group of KO11 with only GSH experienced decrease in cell mass. Group #4 (KO11 with Bio-E (both FucO and GSH)) gave measurement results as we hypothesized by continuing cellular growth in the first 48 hours and maintaining it even after the 48th hour, though at a lower rate.
Second Set (20 mM furfural):
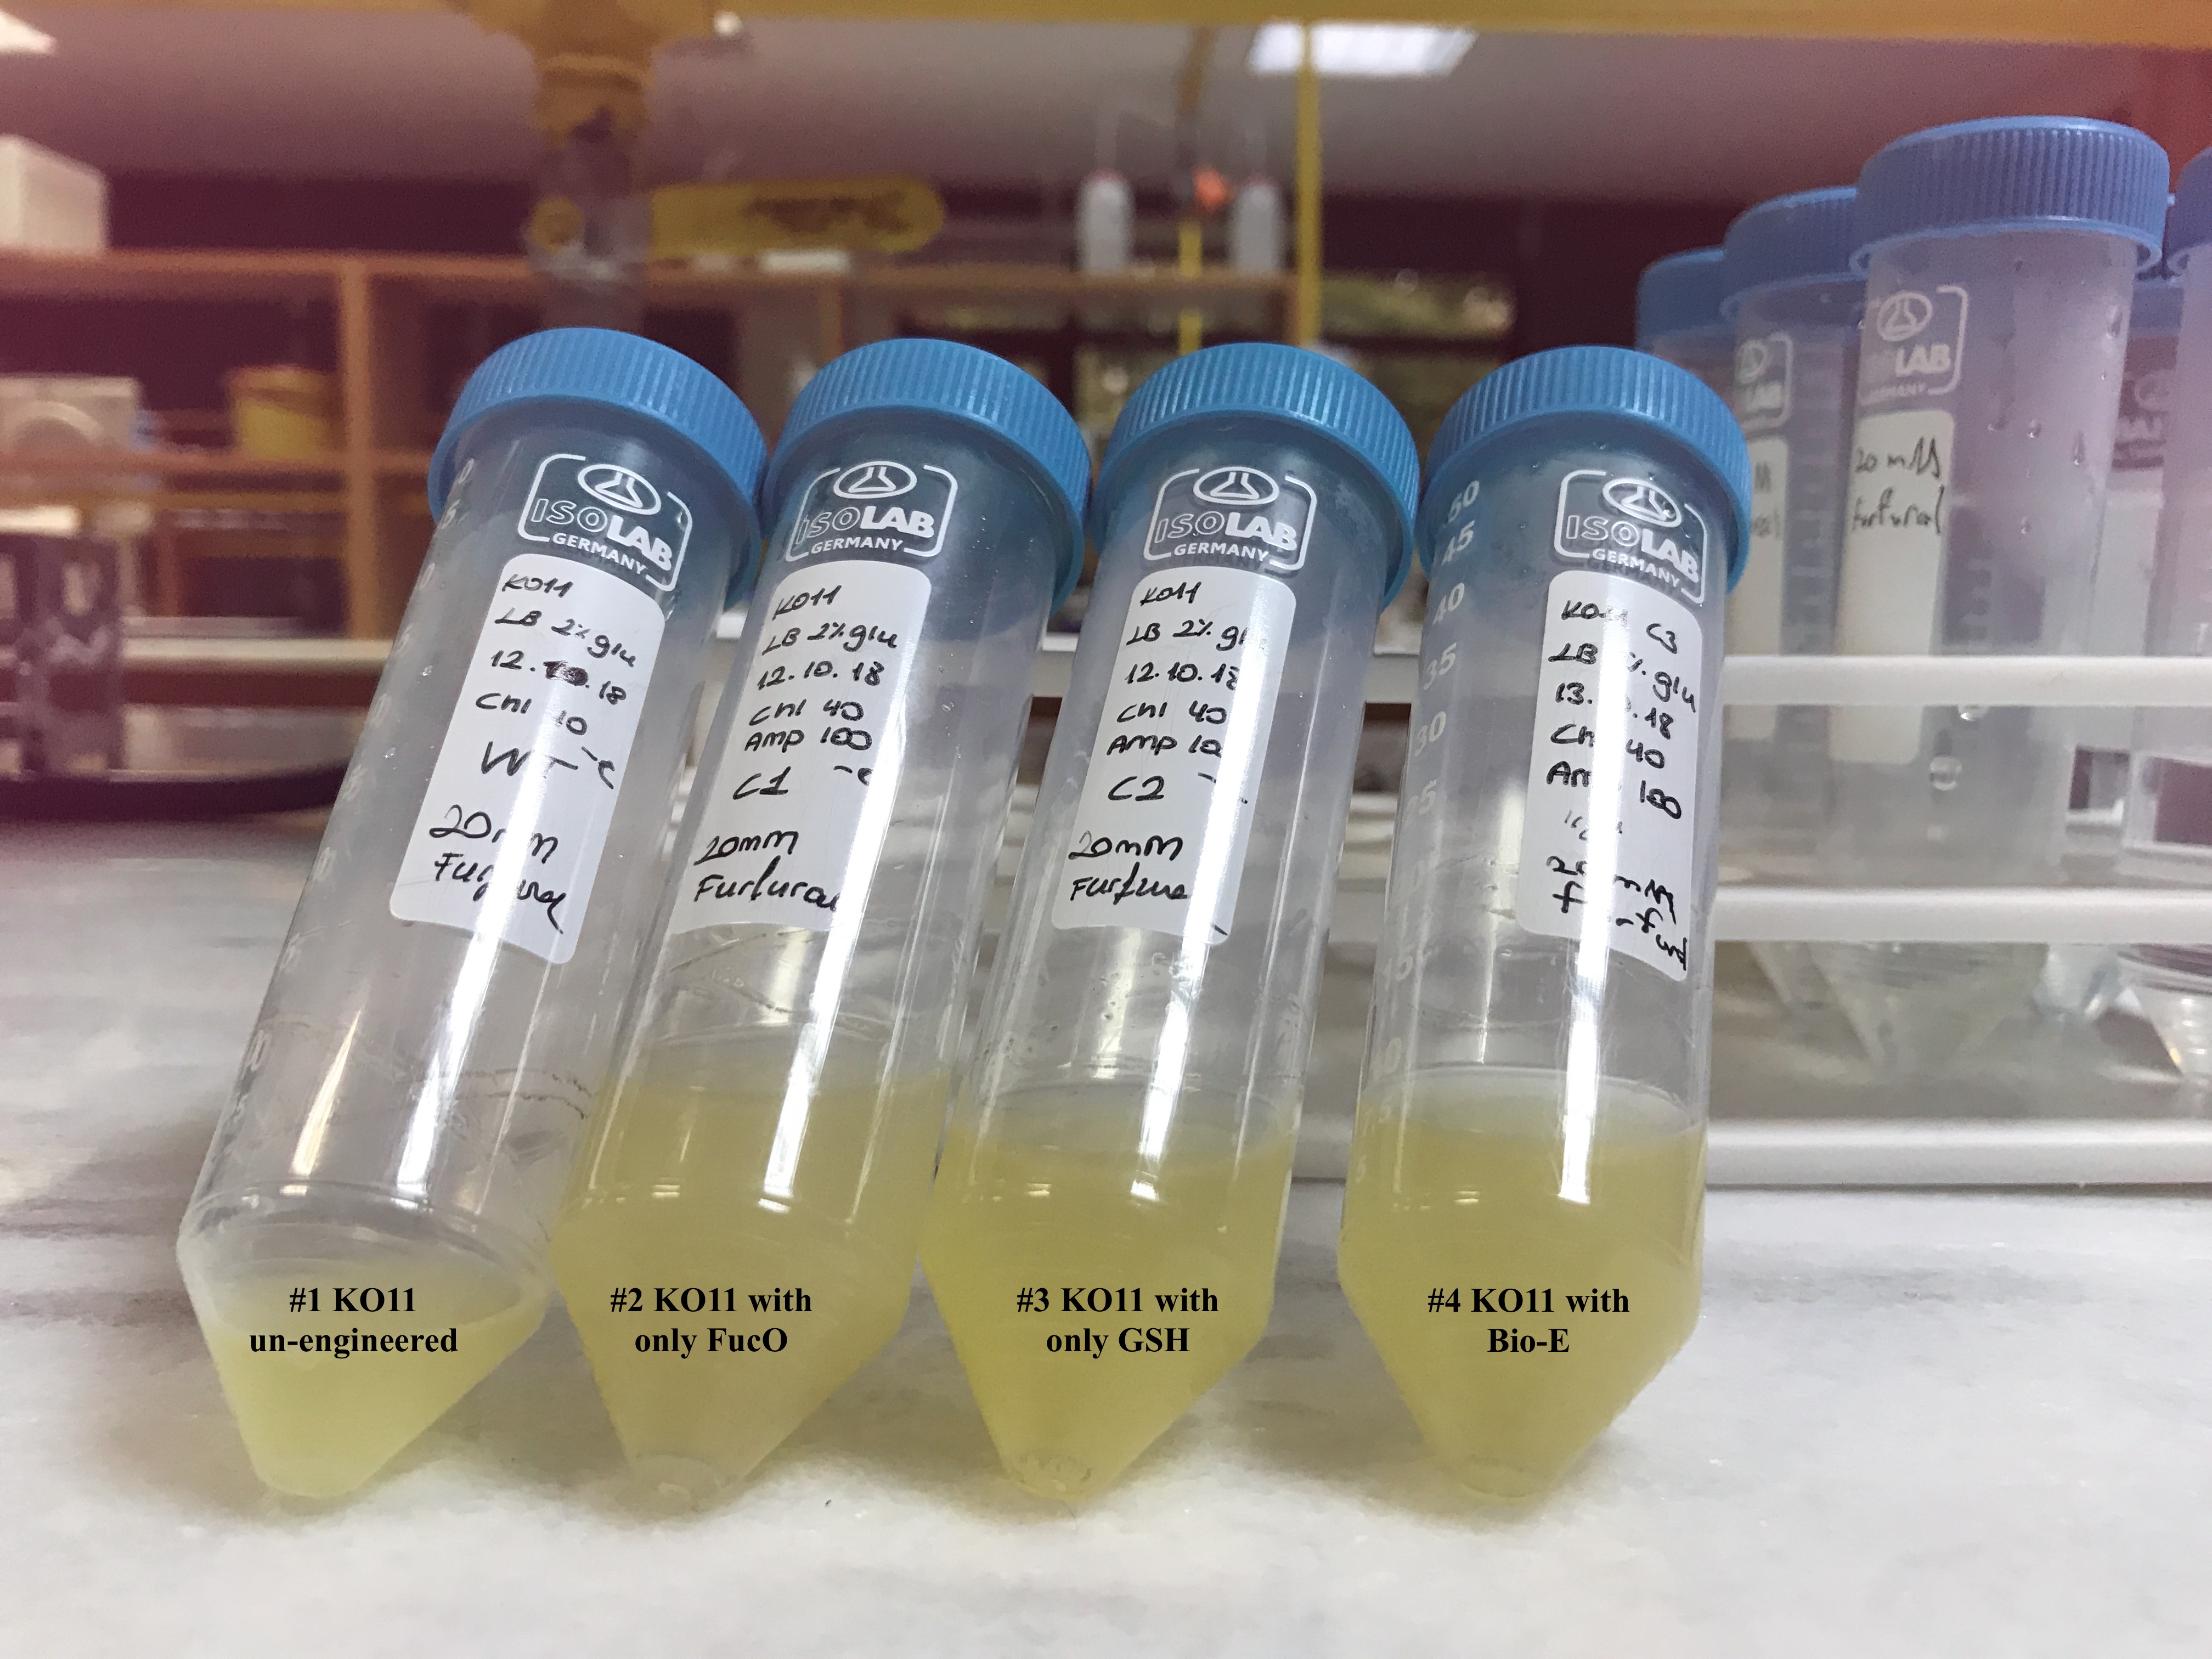
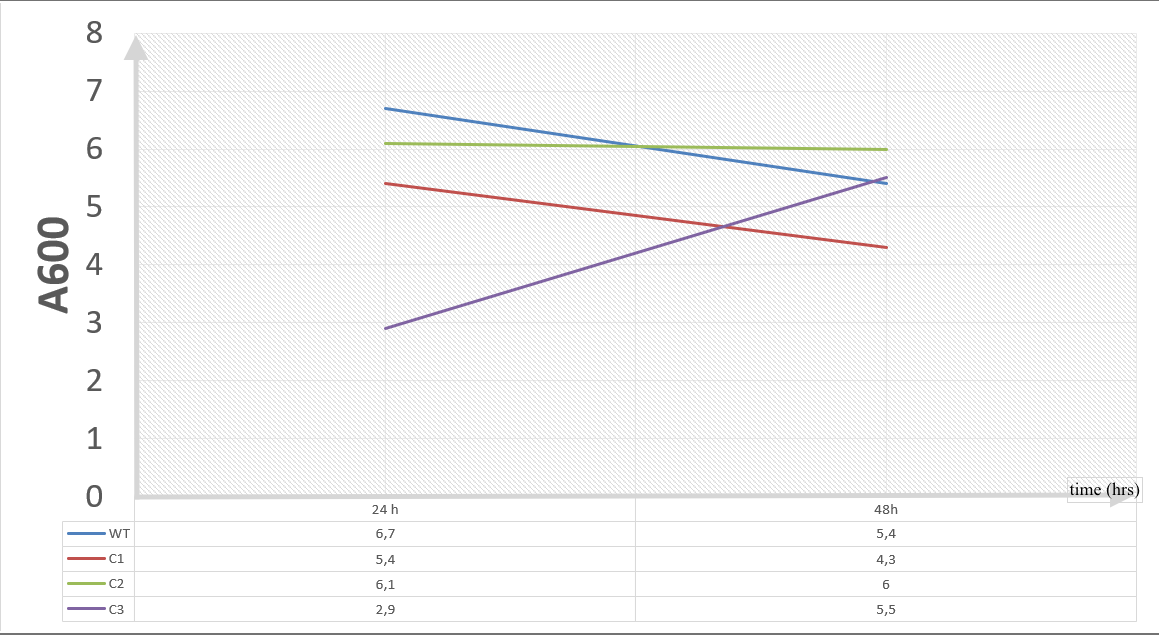
To gather more information to prove our hypothesis, we designed our second experimental set and added furfural at a final concentration of 20 mM to the four test groups’ mediums followed by OD measurements at Abs 600 nm with 1/10 dilution in 24 hour time intervals.
20 mM furfural OD measurements: Abs 600 (1/10 dilution):
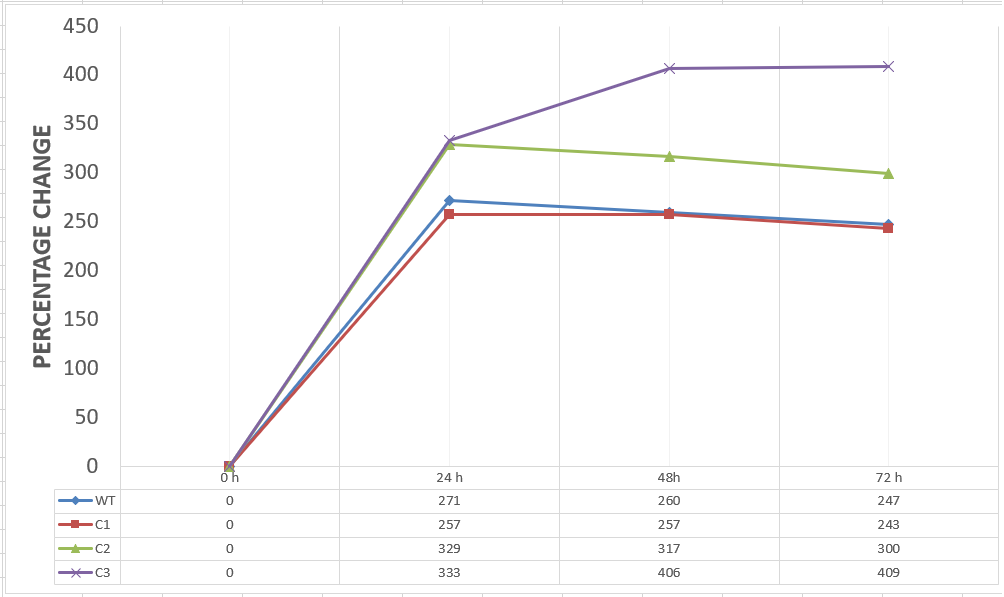
For our second set, we could only obtain the measurements of the first 48 hours since we faced contamination in the last day of wet-lab and we had no more time. Thus, we modelled our second experimental set’s results by demonstrating the comparison of OD results at absorbance 600.
Analysis of Data:
Our data demonstrated that group #1 (KO11 un-engineered) had a decrease in cell mass as time passed. Group #2 (KO11 with only FucO) also experienced a decrease in cell mass. Group #3 (KO11 with only GSH) gave better results with respect to both of the groups #1 and #2 by maintaining its cell mass stable. Group #4 (KO11 with Bio-E (both FucO and GSH)) gave the most promising measurement data as we hypothesized by continuing cellular growth (almost doubling cell mass) in the first 48 hours.
Second Assay:
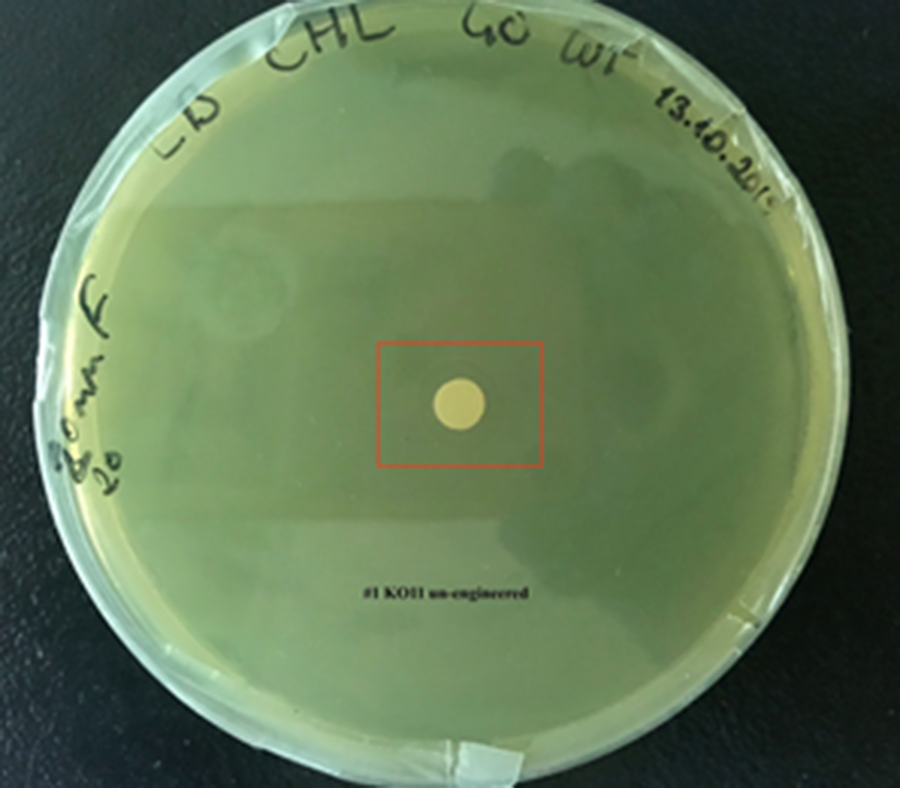
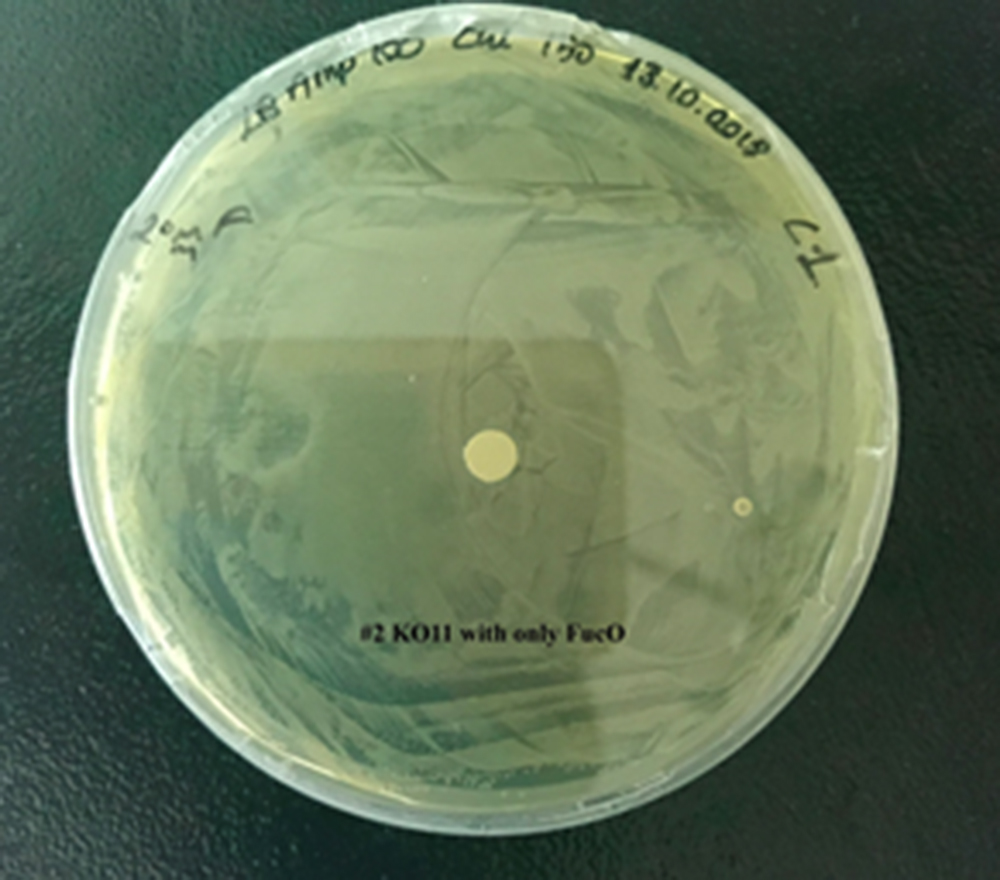
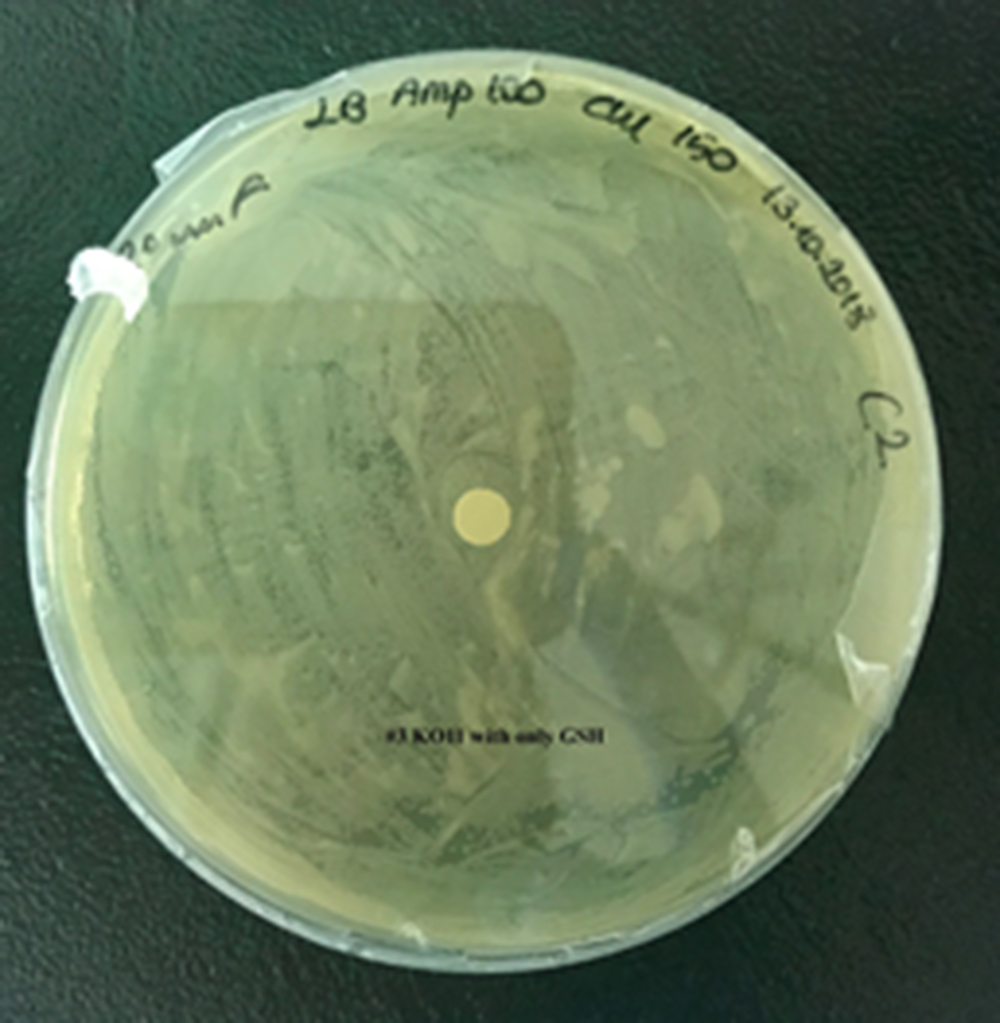
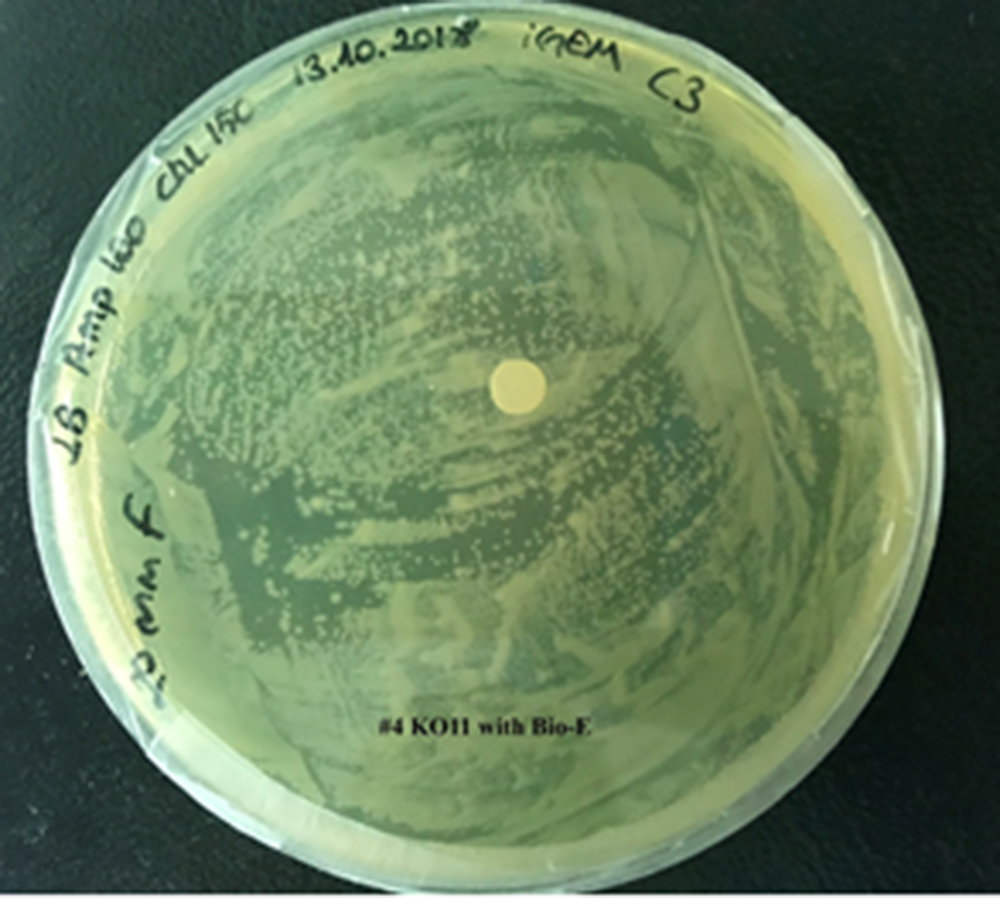
For our second characterization, we followed more of qualitative evaluation to see the inhibitory zone of furfural. Firstly, we prepared a solution of furfural at a final concentration of 20 mM by diluting the stock solution with distilled H2O. Then, we soaked filter paper discs in that solution and placed them on LB agar plates hosting the four groups of our assay.
After 48 hours, we’ve observed a clear zone around the filter paper of the group containing KO11 un-engineered while others weren’t inhibited as much.
Conclusion:
When the quantitative measurement data and qualitative phenotypic evaluation for all of our biochemical assays are considered, we can conclude that the groups containing KO11 un-engineered are the weakest ones against furfural toxicity; and neither the group of KO11 with only FucO nor the group with only GSH is resistant enough to continue cellular growth when furfural is present in the medium. Out of four groups, only the group containing KO11 with Bio-E (both FucO and GSH) can sustain its cellular growth and survive. Overall, we can infer that our best part design (Bio-E) was successful enough to combat the inhibitive effects of furfural, indicating trueness of our hypothesis.
Sequence and Features
- 10COMPATIBLE WITH RFC[10]
- 12COMPATIBLE WITH RFC[12]
- 21COMPATIBLE WITH RFC[21]
- 23COMPATIBLE WITH RFC[23]
- 25COMPATIBLE WITH RFC[25]
- 1000INCOMPATIBLE WITH RFC[1000]Illegal BsaI.rc site found at 2008
References
Ask, M., Mapelli, V., Höck, H., Olsson, L., Bettiga, M. (2013) Engineering glutathione biosynthesis of Saccharomyces cerevisiae increases robustness to inhibitors in pretreated lignocellulosic materials. Microbial Cell Factories. 12:87 https://www.ncbi.nlm.nih.gov/pmc/articles/PMC3817835/
Burton, G. J., & Jauniaux, E. (2011). Oxidative stress. Best Practice & Research. Clinical Obstetrics & Gynaecology, 25(3), 287–299. http://doi.org/10.1016/j.bpobgyn.2010.10.016
Lu, S. C. (2013). GLUTATHIONE SYNTHESIS. Biochemica et Biophysica Acta, 1830(5), 3143–3153. http://doi.org/10.1016/j.bbagen.2012.09.008
National Center for Biotechnology Information. PubChem Compound Database; CID=124886, https://pubchem.ncbi.nlm.nih.gov/compound/124886 (accessed July 18, 2018). https://pubchem.ncbi.nlm.nih.gov/compound/124886#section=Top
Patrick, L. (2003). Mercury Toxicity and Antioxidants: Part I: Role of Glutathione and alpha-Lipoic Acid in the Treatment of Mercury Toxicity. Alternative medicine review: a journal of clinical therapeutic.(7). 456-471. https://www.researchgate.net/publication/10980025_Mercury_Toxicity_and_Antioxidants_Part_I_Role_of_Glutathione_and_alpha-Lipoic_Acid_in_the_Treatment_of_Mercury_Toxicity
Pizzorno, J. (2014). Glutathione! Integrative Medicine: A Clinician’s Journal, 13(1), 8–12. https://www.ncbi.nlm.nih.gov/pmc/articles/PMC4684116/
| None |


