
Part:BBa_K1583102
pRha + CsgA + Hydroxyapatite-affinity tag
CsgA with Hydroxyapatite-tag attachted to the C-terminus under control of L-rhamnose-inducible promoter (BBa_K914003).
CsgA is a protein monomer which can aggregate to form amyloid nanowires in natural biofilms of E.coli. This protein is transported as an unfolded protein out of the cell. Outside the cell CsgA proteins self-assemble into nanowires after nucleation on the membrane protein CsgB. CsgC prevents CsgA proteins from self-assembling inside the cell and the transport is ensured by the proteins CsgEFG.
This part generates a peptide tag which shows high adhesive properties towards hydroxyapatite, a main component of e.g. teeth. The sequence of the hydroxyapatite-binding peptide is from an article by Roy et al. (2008).
Sequence and Features
- 10COMPATIBLE WITH RFC[10]
- 12COMPATIBLE WITH RFC[12]
- 21COMPATIBLE WITH RFC[21]
- 23COMPATIBLE WITH RFC[23]
- 25COMPATIBLE WITH RFC[25]
- 1000COMPATIBLE WITH RFC[1000]
Characterization
Four different experiments were done to characterise the BBa_K1583102 biobrick:
- Fluorescence assay (Rhamnose inducible expression)
- Crystal Violet assay (Curli formation)
- Affinity assay using Bos taurus dental parts (Hydroxyapatite affinity)
- Transmission electron microscopy (Curli formation)
Fluorescence assay
To be able to ensure that CsgA is expressed, we added a gene encoding for GFPmut3 (BBa_I13504) under induction of the same rhamnose promoter (BBa_K1583112) to check that the promoter works. In this experiment, the fluorescence signal of our csgA construct and csgA-GFP (I13504) constructs was recorded in time after induction with no, 0.2% (w/v) or 0.5% (w/v) rhamnose. Besides the fluorescence, the OD600 was measured in order to normalize the fluorescence signal per cell.All conditions were carried out in triplicates to be able to do a statistical analysis on the data. The different experiments were induced in a 96 well plate. The OD600 and fluorescence signal was recorded in a plate reader during a 18 hour period of induction at 30°C.
In figure 1, the fluorescent signal was normalized by the number of cells and plotted as a function of time. The red bars denote the error within each ID.
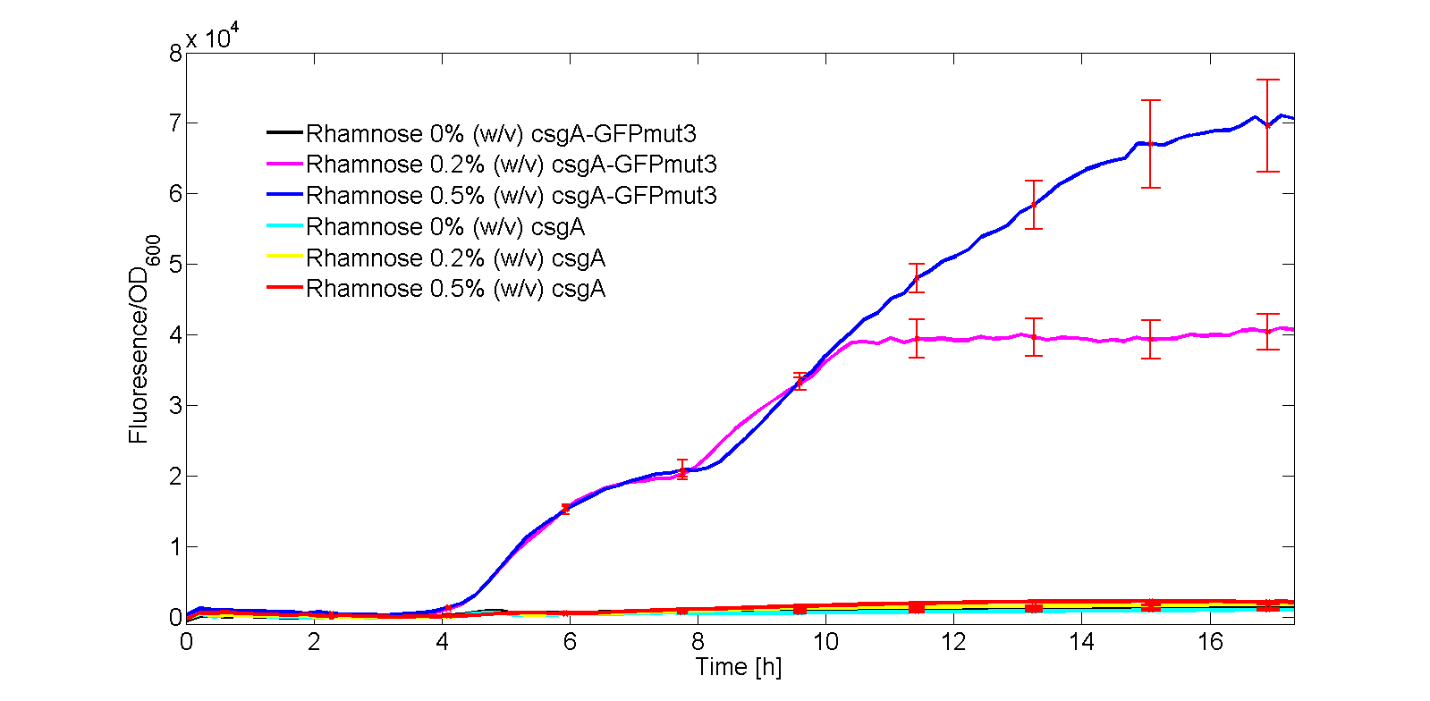
As can be seen from Fig. 1, only the experiments with 0.2% (w/v) and 0.5% (w/v) rhamnose induction with the csgA-GFPmut3 construct gave a clear increase in fluorescence signal in time. All other experiments, gave similar levels of fluorescence, slightly increasing in time. Furthermore, it can be seen that a higher induction level of rhamnose leads to an increase in GFPmut3 and thus fluorescence. Finally, as the fluorescence signal is normalized by the cell density, one can make statements about the activity of the rhamnose promoter. The promoter seems to not be active right after induction, but more after 3 or 4 hours. This is in accordance with data from literature (Wegerer et. al), in which a low amount of fluorescence with a rhamnose promoter was observed after 2 hours of induction.
With this kinetic experiment, we have proven that the rhamnose promoter does indeed induce the expression of the csgA gene.
Crystal violet assay
The assay above showed that the bacteria that we engineered for the project is capable of producing the CsgA proteins after induction with L-rhamnose. However, this did not yet prove that curli are formed. In order to assess whether our bacteria producting CsgA with a Hydroxyapatite-affinity tag can still produce these nanowires, our team adapted the protocol from Zhou et al. (2013) that employs crystal violet (methyl violet 10B) for dying the biofilm-making bacteria that attaches to the surface. In the experiment, our CsgA_HA-producing strain of E. coli was induced at a high (0.5% w/v), low (0.2% w/v) and no (0% w/v) concentration of L-rhamnose. Furthermore, csgA deficient bacteria transformed with an empty plasmid (pSB1C3) were used as control. In the end, the wells were diluted with ethanol so all the content can dissolve in the liquid phase. We measured the absorbance at 590 nm of wavelength for all the samples, obtaining the following results (Figure 2.).

The CsgA_HA proteins seem to have retained the capability to form curli despite having a peptidic modification on the C-terminus. To confirm that there is a real change between the analysed samples and the empty plasmid control, a significance analysis was performed for α=0.05 (Table 1.).
| Sample | p-value | Significant difference (5%) |
|---|---|---|
| CTRL2 & HA2 | 0.0015 | Yes |
| CTRL5 & HA5 | 0.0152 | Yes |
The significance analysis shows that cells containing the CsgA_HA biobrick can efficiently create a curli, when compared with an empty plasmid control (i.e. without csgA expression).
Affinity assay using Bos taurus dental parts
In our research for a highly representative biofilm that could be used for testing products, we thought about the main surfaces where a non-desirable biofilm can be attached. The first structure that came into our minds was the dental cavity; there, biofilms can attach to the tooth cover and create strong and resistant biofilms (Kidd, E.A., et al, 2004).

For the experiment aiming to prove that our biofilm can be strongly linked to the enamel surface, we managed to get some teeth from a cow (Bos taurus) (Figure 3.). We cut them in small pieces of similar size (~1cm3) and place them in a 96-well plate. Afterwards the well was filled with 5 mL of cell culture, induced and incubated for 40 hours at room temperature, without shaking. The strains used for the investigation are summarized in table 2:
| Strain | Plasmid | Gene | Function in the experiment |
|---|---|---|---|
| E. coli K-12 MG1655 PRO ΔcsgA ompR234 | BBa_K1583102 | CsgA+HA Tag | Test |
| E. coli K-12 MG1655 PRO ΔcsgA ompR234 | BBa_K1583100 | CsgA | Test |
| E. coli K-12 MG1655 PRO ΔcsgA ompR234 | pSB1C3 | Empty plasmid | Control |
Once the dental pieces had enough time to be covered with specific curli-generating cells, we designed two different protocols for measuring the efficiency of the affinity tag. In both cases, the cells were expressing RFP (red fluorescent protein) under a constitutive promoter. Thus, the number of cells that remained attached to the surface could be calculated from the fluorescence intensity.
We tried to measure the remaining cells attached to the dental surface after submerging it in water for 2 seconds. The first approach included a direct measurement technique: measuring RFP presence using a Typhoon ® Fluorescence Scanner.
On the other hand, we also measured the cells attached to the tooth by putting the samples in an ethanol (70%) solution for 5 minutes. Consequently, the cells detached and float in the supernatant. When we measure the fluorescence intensity of this ethanol supernatant, we were able to discriminate if there is actually a difference in the attachment properties of tagged and untagged cells. Detailed information of the nomenclature used in the figures of this section can be found in Table 3.
| Sample | Gene | Rhamnose | Function in the experiment |
|---|---|---|---|
| Ha+ | CsgA+HA Tag | Yes | Test |
| HA- | CsgA+HA Tag | No | Control |
| CSGA+ | CsgA | Yes | Test |
| CSGA- | CsgA | No | Control |
| PSB+ | Empty plasmid pSB1C3 | Yes | Control |
| PSB- | Empty plasmid pSB1C3 | No | Control |
We tested the RFP presence in the tooth samples (figure 4) with a fluorescence scanner, obtaining the following results (figure 5):


The results of this experiment showed a strong background from the samples, meaning that probably the teeth display some kind of self-fluorescence. Consequently, the results of this test cannot be considered for proving the affinity to hydroxyapatite of our biofilms.
Then we performed the second measurement assay, using a 96-well plate and the plate reader. The results are displayed in figure 6, and the parameters were confirmed using the supernatant of the CsgA producing cells with no ethanol treatment.

From the results shown above, we could conclude that our affinity tag for hydroxyapatite gives an actual difference when compared with the control samples, for significance level of 5%. Also, the statistical analysis confirms that there is a significant change between cells with the affinity tag and without it (Table 4).
| Samples compared | p-value | Significatant difference (5%) |
|---|---|---|
| Ha+ % ETOH | 0.0014 | Yes |
| CSGA+ & ETOH | 0.0202 | Yes |
| PSB+ & ETOH | 0.7295 | No |
| CSGA+ & HA+ | 0.0008 | Yes |
Transmission electron microscopy
Using TEM the formation of curli of the biobrick BBa_K1583100 was visualized. Although this is a different biobrick (no addition HA-tag), curli formation can be presumed to be similar for this biobrick (Figure 7).


We did not observe formation of curli nanowires in the uninduced cultures of our strain. However, cells from induced cells clearly produced them, as supported by the TEM images.
References
Roy, M. D., Stanley, S. K., Amis, E. J., & Becker, M. L. (2008). Identification of a Highly Specific Hydroxyapatite-binding Peptide using Phage Display. Advanced Materials, 20(10), 1830–1836. p>
Wegerer, A., Sun, T., and Altenbuchner, J. (2008). Optimization of an E. coli L-rhamnose-inducible expression vector: test of various genetic module combinations”, BMC Biotechnology, 8:2
Zhou, Kang, Kangjian Qiao, Steven Edgar, and Gregory Stephanopoulos. 2015. “Distributing a Metabolic Pathway among a Microbial Consortium Enhances Production of Natural Products.” Nature Biotechnology 33(4): 377–83.
//awards/part_collection/2015
| None |