Part:BBa_K1172501
Outer membrane porin OprF from Pseudomonas fluorescens
Usage and Biology
The Microbial Fuel Cell (MFC) can be a future environmentally friendly biotechnological application for the production of electrical energy. As a future alternative energy source, the bioelectricity generation must become more efficient. A major limiting factor is the low bacterial membrane permeability, hindering transport of electron shuttles through the membrane and thereby restricting the electron shuttle-mediated extracellular electron transfer (EET) from bacteria to electrodes. This results in a reduced electrical power output of the MFC. Therefore, we heterologously expressed the porin protein OprF from Pseudomonas fluorescens into Escherichia coli.

Figure 1: Schematic overview of the enhancement mechanism of electron shuttle-mediated electron transfer between bacteria and the anode of MFCs by the synthetic porin OprF. Oxidized mediators diffuse into the periplasmatic space where they accept electrons. Reduced mediators are secreted through outer membrane porins and donate their electrons to the electrode.
Heterologous expression of the porin protein OprF from Pseudomonas fluorescens into Escherichia coli leads to a much higher current output in comparison to its parental strain (E. coli KRX). This is most likely caused by improved electron shuttle-mediated extracellular electron transfer through dramatically increased membrane permeability. The heterologous expression of the outer membrane porin OprF from Pseudomonas fluorescens in Escherichia coli is a great genetic strategy to overcome limitations due to the membrane and to increase electricity generation by microorganisms.
- Allergen characterization of BBa_K1172501: Not a potential allergen
The Baltimore Biocrew 2017 team discovered that proteins generated through biobrick parts can be evaluated for allergenicity. This information is important to the people using these parts in the lab, as well as when considering using the protein for mass production, or using in the environment. The allergenicity test permits a comparison between the sequences of the biobrick parts and the identified allergen proteins enlisted in a data base.The higher the similarity between the biobricks and the proteins, the more likely the biobrick is allergenic cross-reactive. In the full-length alignments by FASTA, 30% or more amount of similarity signifies that the biobrick has a Precaution Status meaning there is a potential risk with using the part. A 50% or more amount of identity signifies that the biobrick has a Possible Allergen Status. In the sliding window of 80 amino acid segments, greater than 35% signifies similarity to allergens. The percentage of similarity implies the potential of harm biobricks’ potential negative impact to exposed populations. For more information on how to assess your own biobrick part please see the “Allergenicity Testing Protocol” in the following page http://2017.igem.org/Team:Baltimore_Bio-Crew/Experiments
For the biobrick part, BBa_K1172501, there was a 24.3% of identity match and 51.3% similarity match to the top allergen in the allergen database. This means that the biobrick part is not of potential allergen status. In 80 amino acid alignments by FASTA window, no matches found that are greater than 35% for this biobrick. This also means that there is not of potential allergen status.
Part uses
The oprF gene from Pseudomonas fluorescens was cloned and heterologously expressed in Escherichia coli KRX under the control of different promoters (Table 1).

Table 1: Overview of oprF devices. Combination of oprF coding BioBrick (BBa_K1172501) with different promoters and RBS. The characterization of this BioBrick was performed by comparing Escherichia coli KRX wild type with Escherichia coli KRX carrying BBa_K1172502, BBa_K1172503, BBa_K1172504, BBa_K1172505 and BBa_K1172507.
Sequence and Features
- 10COMPATIBLE WITH RFC[10]
- 12COMPATIBLE WITH RFC[12]
- 21INCOMPATIBLE WITH RFC[21]Illegal BglII site found at 764
- 23COMPATIBLE WITH RFC[23]
- 25INCOMPATIBLE WITH RFC[25]Illegal NgoMIV site found at 1156
- 1000INCOMPATIBLE WITH RFC[1000]Illegal BsaI site found at 677
OprF Information Contribution by team William_and_Mary 2020
Usage and Biology
The opportunistic pathogen Pseudomonas aeruginosa detects the inflammatory cytokine IFN-γ through the binding of IFN-γ and OprF, thus inducing the expression of rhlI gene and as a result of that, produces a quorum-sensing dependent virulence determinant PA-I lectin (lecA) (Ding et al., 2010; Wu et al., 2005). Researchers Wu et al. tested whether the expression of rhlI is due to specific cytokines. Strain PLL-EGFP/27853, a PA-I-GFP reporter strain, was individually exposed to IL-2, IL-4, IL-6, IL-8,IL-10, IL-12, IFN-γ and TNF-α, and PA-I promoter activity was assessed. Only IFN-γ was found to induce PA-I promoter activity. Then, the completely sequenced Pseudomonas aeruginosa strain PAO-1 was incubated with 200 ng/ml of IL-2, IL-4, IL-8, IL-10, IFN-γ and TNF-α in cell culture media for 4 hours, and PA-I mRNA was measured using a Northern blot. Relative PA-I mRNA levels were found to be triple in the bacteria group exposed to IFN-γ compared to bacteria groups exposed to other cytokines (Figure 1, Wu et al., 2005). Only IFN-γ and C4-HSL (quorum sensing molecule induced by IFN-γ in P. aeruginosa) resulted in a significant increase in PA-I mRNA. After 6 hours of exposure to different concentrations of IFN-γ, P. aeruginosa was found to have around a 30% increase in relative PA-I lectin expression in 0.1 ng/ml concentration, 50% increase for 1 ng/ml, 210% increase for 10 ng/ml, 310% increase for 100 ng/ml, and 320% increase for 1000 ng/ml (Wu et al., 2005). The rhlI gene is induced by IFN-γ, which leads to the production of C4-HSL, a molecule critical to quorum sensing systems and PA-I production. Activation of the quorum sensing system also leads to the production of pyocyanin (PCN) in addition to PA-I. Then, the researchers tested whether IFN-γ binds to a specific bacterial protein (Wu et al., 2005). By using an enzyme-linked immunosorbent assay (ELISA), epifluorescence photomicrographs showed that IFN-γ preferentially binds to membrane fractions of P. aeruginosa. The binding was found to be diminished upon proteinase K treatment, which indicated that IFN-γ binds to bacterial cell membrane proteins. Membrane proteins were then separated and transferred to polyvinylidene difluoride membranes through non-denaturing gel electrophoresis (Wu et al., 2005). The membrane proteins were then hybridized with IFN-γ followed by biotin-labeled antibody to IFN-γ. Results suggested that it is a 35-kD protein. Using the ESI-TRAP LC-MS-MS ion trap, the researchers identified the 35-kD protein to be the P. aeruginosa outer membrane porin OprF (Wu et al., 2005). A mutant strain with a mutated version of OprF failed to cause an increase in PA-I production as a response to IFN-γ, and reconstructing the mutant strain with a plasmid containing the OprF gene reestablished the responsiveness to IFN-γ.
A possible explanation for why opportunistic pathogen P. aeruginosa developed this function is to allow for an increase in virulence at the time of inflammation in the host, which leads to a weaker host immune system. Also, by binding IFN-γ, P. aeruginosa is able to retain cellular function and replicate in the presence of IFN-γ, which is indicated by experiments (Wu et al., 2005). As a result, with a countermeasure against host immune activation, P. aeruginosa can become more effective at infecting its host.
OprF is an outer membrane porin found in Pseudomonas aeruginosa. It is the major outer membrane protein in Pseudomonas aeruginosa and serves as a transbilayer pore (Brinkman et al., 2000) and a structural protein that maintains cell shape under low osmolarity environment (Freulet-Marrière et al., 2000). OprF consists of two domains: a C-terminal periplasmic domain and a N-terminal domain that forms an eight-stranded antiparallel transmembrane beta-barrel with four extracellular loops. However, OprF exists in two conformations: in two-domain conformation and in a single domain conformation with a 16-stranded beta-barrel with eight extracellular loops (Sugawara et al., 2006; Hughes et al., 1992; Gilleland et al., 1995). Loop 5 (AA 198-237 (Rawling model) (Rawling et al., 1995)) of OprF has the capability of binding IFN-γ (Aurand and March, 2015), and the loop 6 (AA 257-275 (Rawling model) (Rawling et al., 1995)) reduces this capability (Aurand and March, 2015).
OprF is also the binding site for complement component C3b. Being structurally similar to OprF, some OmpA proteins are also the binding site for complement component C3b (Mishra et al., 2015). The complement system is a conserved immune system prevalent in vertebrates and some invertebrates that once activated, starts a complement cascade which ultimately forms a cylindrical membrane attack complex that kills invading cells. Complement component C3 acts an important role in the complement cascade. C3b is the product of C3 activation and binds to bacterial surfaces. By binding to OprF, C3b triggers downstream effects which enhance complement-mediated killing.
Part Uses
Researchers have used OprF as an anchor for lipase in E.coli (Lee et al., 2005). Pseudomonas fluorescens SIK W1 lipase gene is fused to the truncated oprF gene by using a C-terminal deletion fusion strategy. Lys 164 is a functional fusion site in the oprF gene, and the researchers were able to successfully display functional lipase on the outer membrane of E. coli. Lipase activity is maximized at 37°C, pH 8.0, and remains 80% active at a temperature range of 20°C and 45°C (Lee et al., 2005). At 37°C, whole cell lipase activity remains over 80% in cells incubated in Tris-HCl, isopropyl alcohol, and hexane for over a week, indicating that E. coli cells displaying lipase can act as an effective biocatalyst for industrial production (Lee et al., 2005).
OprF and Synthetic Biology
OprF is an ortholog of E. coli OmpA, sharing 39% sequence identity and 56% similarity in their C-terminal (periplasmic) domains, but only 15% identity in their N-terminal (TM) domains (Khalid et al., 2006). In the study by Aurand and March, when loop 1 (AA 38-54) of OmpA is replaced with loop 5 (AA 198-237(Rawling model)(Rawling et al., 1995)) of OprF, the β-galactosidase gene lacZ (pPALacZ1) controlled by the system has significantly higher expression when IFN-γ reaches 300 pM, indicating that this version of the OmpA-OprF chimeric protein can detect IFN-γ at 300 pM and in turn control gene expression through the phage shock protein (psp) system. The psp system of E. coli is a conserved system that detects extracellular stress that transduces outer membrane stress to receptors on the inner membrane, PspB and PspC, causing PspA to stop inhibition of PspF, which activates the pspA promoter (Joly et al., 2010). Under non-induced situations, PspA negatively regulates the psp operon by binding PspF (Weiner et al., 1991). β-galactosidase activity was measured in the study through the use of a kinetic assay (Ramsay et al., 2011). When induced, the pspA promoter activates β-galactosidase gene lacZ (pPALacZ1) as designed. Even more intriguing is that when loop 1 (AA 38-54) of OmpA is replaced with loop 5 (AA 198-237 Rawling model) of OprF and loop 2 (AA 79-95) of OmpA is replaced with loop 6 (AA 257-275 Rawling model), the protein can also detect TNF-α at around 150 pM and with increased sensitivity for IFN-γ (200pM) (Aurand and March, 2015). β-galactosidase activity (measured in RFU/min) was found to be increased at those cytokine concentrations. Other constructs like pTCA9 (loop 2 replaced by loop 6 (AA 241-261, Gilleland model) (Gilleland et al., 1995)) and pTCA10 (loop 1 replaced by loop 5 (AA 200-217 Gilleland model) and loop 2 replaced by loop 6 (AA 241-261 Gilleland model)) require higher concentration of IFN-γ or TNF-α. pTCA9 produces a response to 900 pM of IFN-γ, and pTCA10 requires 800 pM of TNF-α and 900 pM of IFN-γ. As a result, pTCA6 (OmpA loop 1 replaced by OprF loop 5 and OmpA loop 2 replaced with OprF loop 6) is the most effective and sensitive chimeric protein for sensing both cytokines. Thus, the OmpA-OprF chimeric protein can act as a cytokine sensor for IFN-γ and TNF-α, which is useful for identifying regions of inflammation in vivo, and inducing certain genes to synthesize certain compounds to reduce inflammation.
References
Aurand, T., & March, J. (2015). Development of a synthetic receptor protein for sensing inflammatory mediators interferon‐γ and tumor necrosis factor‐α. Biotechnology and Bioengineering, 113(3), 492-500.
Brinkman, F., Bains, M., & Hancock, R. (2000). The amino terminus of Pseudomonas aeruginosa outer membrane protein OprF forms channels in lipid bilayer membranes: Correlation with a three-dimensional model (vol 182, pg 5251, 2000). Journal Of Bacteriology, 182(23), 6863.
Ding, B., Von Specht, B., & Li, Y. (2010). OprF/I-vaccinated sera inhibit binding of human interferon-gamma to Pseudomonas aeruginosa. Vaccine, 28(25), 4119-4122.
Freulet-Marrière, M., El Hamel, C., Chevalier, S., Dé, E., Molle, G., & Orange, N. (2000). Evidence for association of lipopolysaccharide with Pseudomonas fluorescens strain MF0 porin OprF. Research in Microbiology, 151(10), 873-876.
Gilleland, Harry, Hughes, Eileen, Gilleland, Linda, Matthews-Greer, Janice, & Staczek, John. (1995). Use of synthetic peptides to identify surface-exposed, linear B-cell epitopes within outer membrane protein F of Pseudomonas aeruginosa. Current Microbiology, 31(5), 279-286.
Hughes, E E, Gilleland, L B, & Gilleland, H E, Jr. (1992). Synthetic peptides representing epitopes of outer membrane protein F of Pseudomonas aeruginosa that elicit antibodies reactive with whole cells of heterologous immunotype strains of P. aeruginosa. Infection and Immunity, 60(9), 3497-3497503.
Joly, Nicolas, Engl, Christoph, Jovanovic, Goran, Huvet, Maxime, Toni, Tina, Sheng, Xia, . . . Buck, Martin. (2010). Managing membrane stress: The phage shock protein (Psp) response, from molecular mechanisms to physiology. FEMS Microbiology Reviews, 34(5), 797-827.
Khalid, S., Bond, P., Deol, S., & Sansom, M. (2006). Modeling and simulations of a bacterial outer membrane protein: OprF from Pseudomonas aeruginosa. Proteins: Structure, Function, and Bioinformatics, 63(1), 6-15.
Lee, Seung Hwan, Choi, Jong‐il, Han, Mee‐Jung, Choi, Jong Hyun, & Lee, Sang Yup. (2005). Display of lipase on the cell surface of Escherichia coli using OprF as an anchor and its application to enantioselective resolution in organic solvent. Biotechnology and Bioengineering, 90(2), 223-230.
Mishra, Meenu, Ressler, Adam, Schlesinger, Larry S, & Wozniak, Daniel J. (2015). Identification of OprF as a complement component C3 binding acceptor molecule on the surface of Pseudomonas aeruginosa. Infection and Immunity, 83(8), 3006-3014.
Ramsay JP, Williamson NR, Spring DR, Salmond GPC. 2011. A quorum-sensing molecule acts as a morphogen controlling gas vesicle organelle biogenesis and adaptive flotation in an enterobacterium. Proc Natl Acad Sci 108:14932–14937.
Rawling EG, Martin NL, Hancock RE. 1995. Epitope mapping of the pseudomonas aeruginosa major outer membrane porin protein OprF. Infect Immun 63:38–42.
Sugawara, E., Nestorovich, E., Bezrukov, S., & Nikaido, H. (2006). Pseudomonas aeruginosa porin OprF exists in two different conformations. Journal Of Biological Chemistry, 281(24), 16220-16229.
Weiner, L, Brissette, J L, & Model, P. (1991). Stress-induced expression of the Escherichia coli phage shock protein operon is dependent on sigma 54 and modulated by positive and negative feedback mechanisms. Genes & Development, 5(10), 1912-1923.
Wu, L., Estrada, O., Zaborina, O., Bains, M., Shen, L., Kohler, J., . . . Alverdy, J. (2005). Recognition of host immune activation by Pseudomonas aeruginosa. Science (New York, N.Y.), 309(5735), 774-777.
Results
Overview
Upon expression of the outer membrane porin protein OprF, the morphological and physicochemical characteristics of the E. coli surface were analyzed. [http://2013.igem.org/Team:Bielefeld-Germany/Labjournal/ProtocolsPrograms SDS-PAGE] combined with [http://2013.igem.org/Team:Bielefeld-Germany/Labjournal/ProtocolsPrograms MALDI-TOF MS/MS], different membrane permeability assays ([http://2013.igem.org/Team:Bielefeld-Germany/Labjournal/ProtocolsPrograms NPN] and [http://2013.igem.org/Team:Bielefeld-Germany/Labjournal/ProtocolsPrograms ONPG]), a [http://2013.igem.org/Team:Bielefeld-Germany/Labjournal/ProtocolsPrograms hydrophobicity assay] and [http://2013.igem.org/Team:Bielefeld-Germany/Labjournal/ProtocolsPrograms Atomic Force Microscopy] (AFM) characterize the OprF BioBrick BBa_K1172501.
SDS-PAGE and MALDI-TOF
OprF was detected in an [http://2013.igem.org/Team:Bielefeld-Germany/Labjournal/ProtocolsPrograms SDS-PAGE] with a broad overexpression band. Protein isolation of the outer membrane porin OprF by release of periplasmic protein fraction from E. coli via [http://2013.igem.org/Team:Bielefeld-Germany/Labjournal/ProtocolsPrograms cold osmotic shock] using [http://2013.igem.org/Team:Bielefeld-Germany/Labjournal/ProtocolsPrograms Cell fractionating buffer 2.3] was successful.

Figure 2: [http://2013.igem.org/Team:Bielefeld-Germany/Labjournal/ProtocolsPrograms SDS-PAGE] with [http://www.thermoscientific.com/ecomm/servlet/productsdetail_11152___13576050_-1 Prestained Protein Ladder from Thermo Scientific] as marker. Comparison of protein expression between Escherichia coli KRX wild type and Escherichia coli KRX with BBa_K1172502, BBa_K1172503 and BBa_K1172507 after [http://2013.igem.org/Team:Bielefeld-Germany/Labjournal/ProtocolsPrograms periplasmic protein fractioning] with [http://2013.igem.org/Team:Bielefeld-Germany/Labjournal/ProtocolsPrograms Cell fractionating buffer 2.3]. The band used for the [http://2013.igem.org/Team:Bielefeld-Germany/Labjournal/ProtocolsPrograms MALDI-TOF MS/MS] is marked with an arrow.
The [http://2013.igem.org/Team:Bielefeld-Germany/Labjournal/ProtocolsPrograms SDS-PAGE] shows a significantly higher protein concentration in extracts from E.coli expressing OprF from a T7 promoter (BBa_K1172502). This is most likely caused by the higher membrane permeability (shown with [http://2013.igem.org/Team:Bielefeld-Germany/Labjournal/ProtocolsPrograms NPN] and [http://2013.igem.org/Team:Bielefeld-Germany/Labjournal/ProtocolsPrograms ONPG] uptake assay), allowing an increased release of membrane proteins by 0.2 % SDS. Nevertheless, a strong overexpression band can be observed at the expected OprF size of about 36 kDa for BBa_K1172502, which is equated with a strong expression and overproduction of OprF.
Furthermore we were able to identify the overexpressed outer membrane porin (Figure. 2) with [http://2013.igem.org/Team:Bielefeld-Germany/Labjournal/ProtocolsPrograms MALDI-TOF MS/MS].
[http://2013.igem.org/Team:Bielefeld-Germany/Labjournal/ProtocolsPrograms MALDI-TOF MS/MS] of the gel band thought to represent OprF and analysis with [http://2013.igem.org/Team:Bielefeld-Germany/Labjournal/ProtocolsPrograms MALDI-TOF MS/MS] confirmed the outer membrane porin with a Mascot Score of 222 against the bacteria database.
Growth characteristics
In order to test the effect of the protein expression on the cell growth, growth curves were investigated.
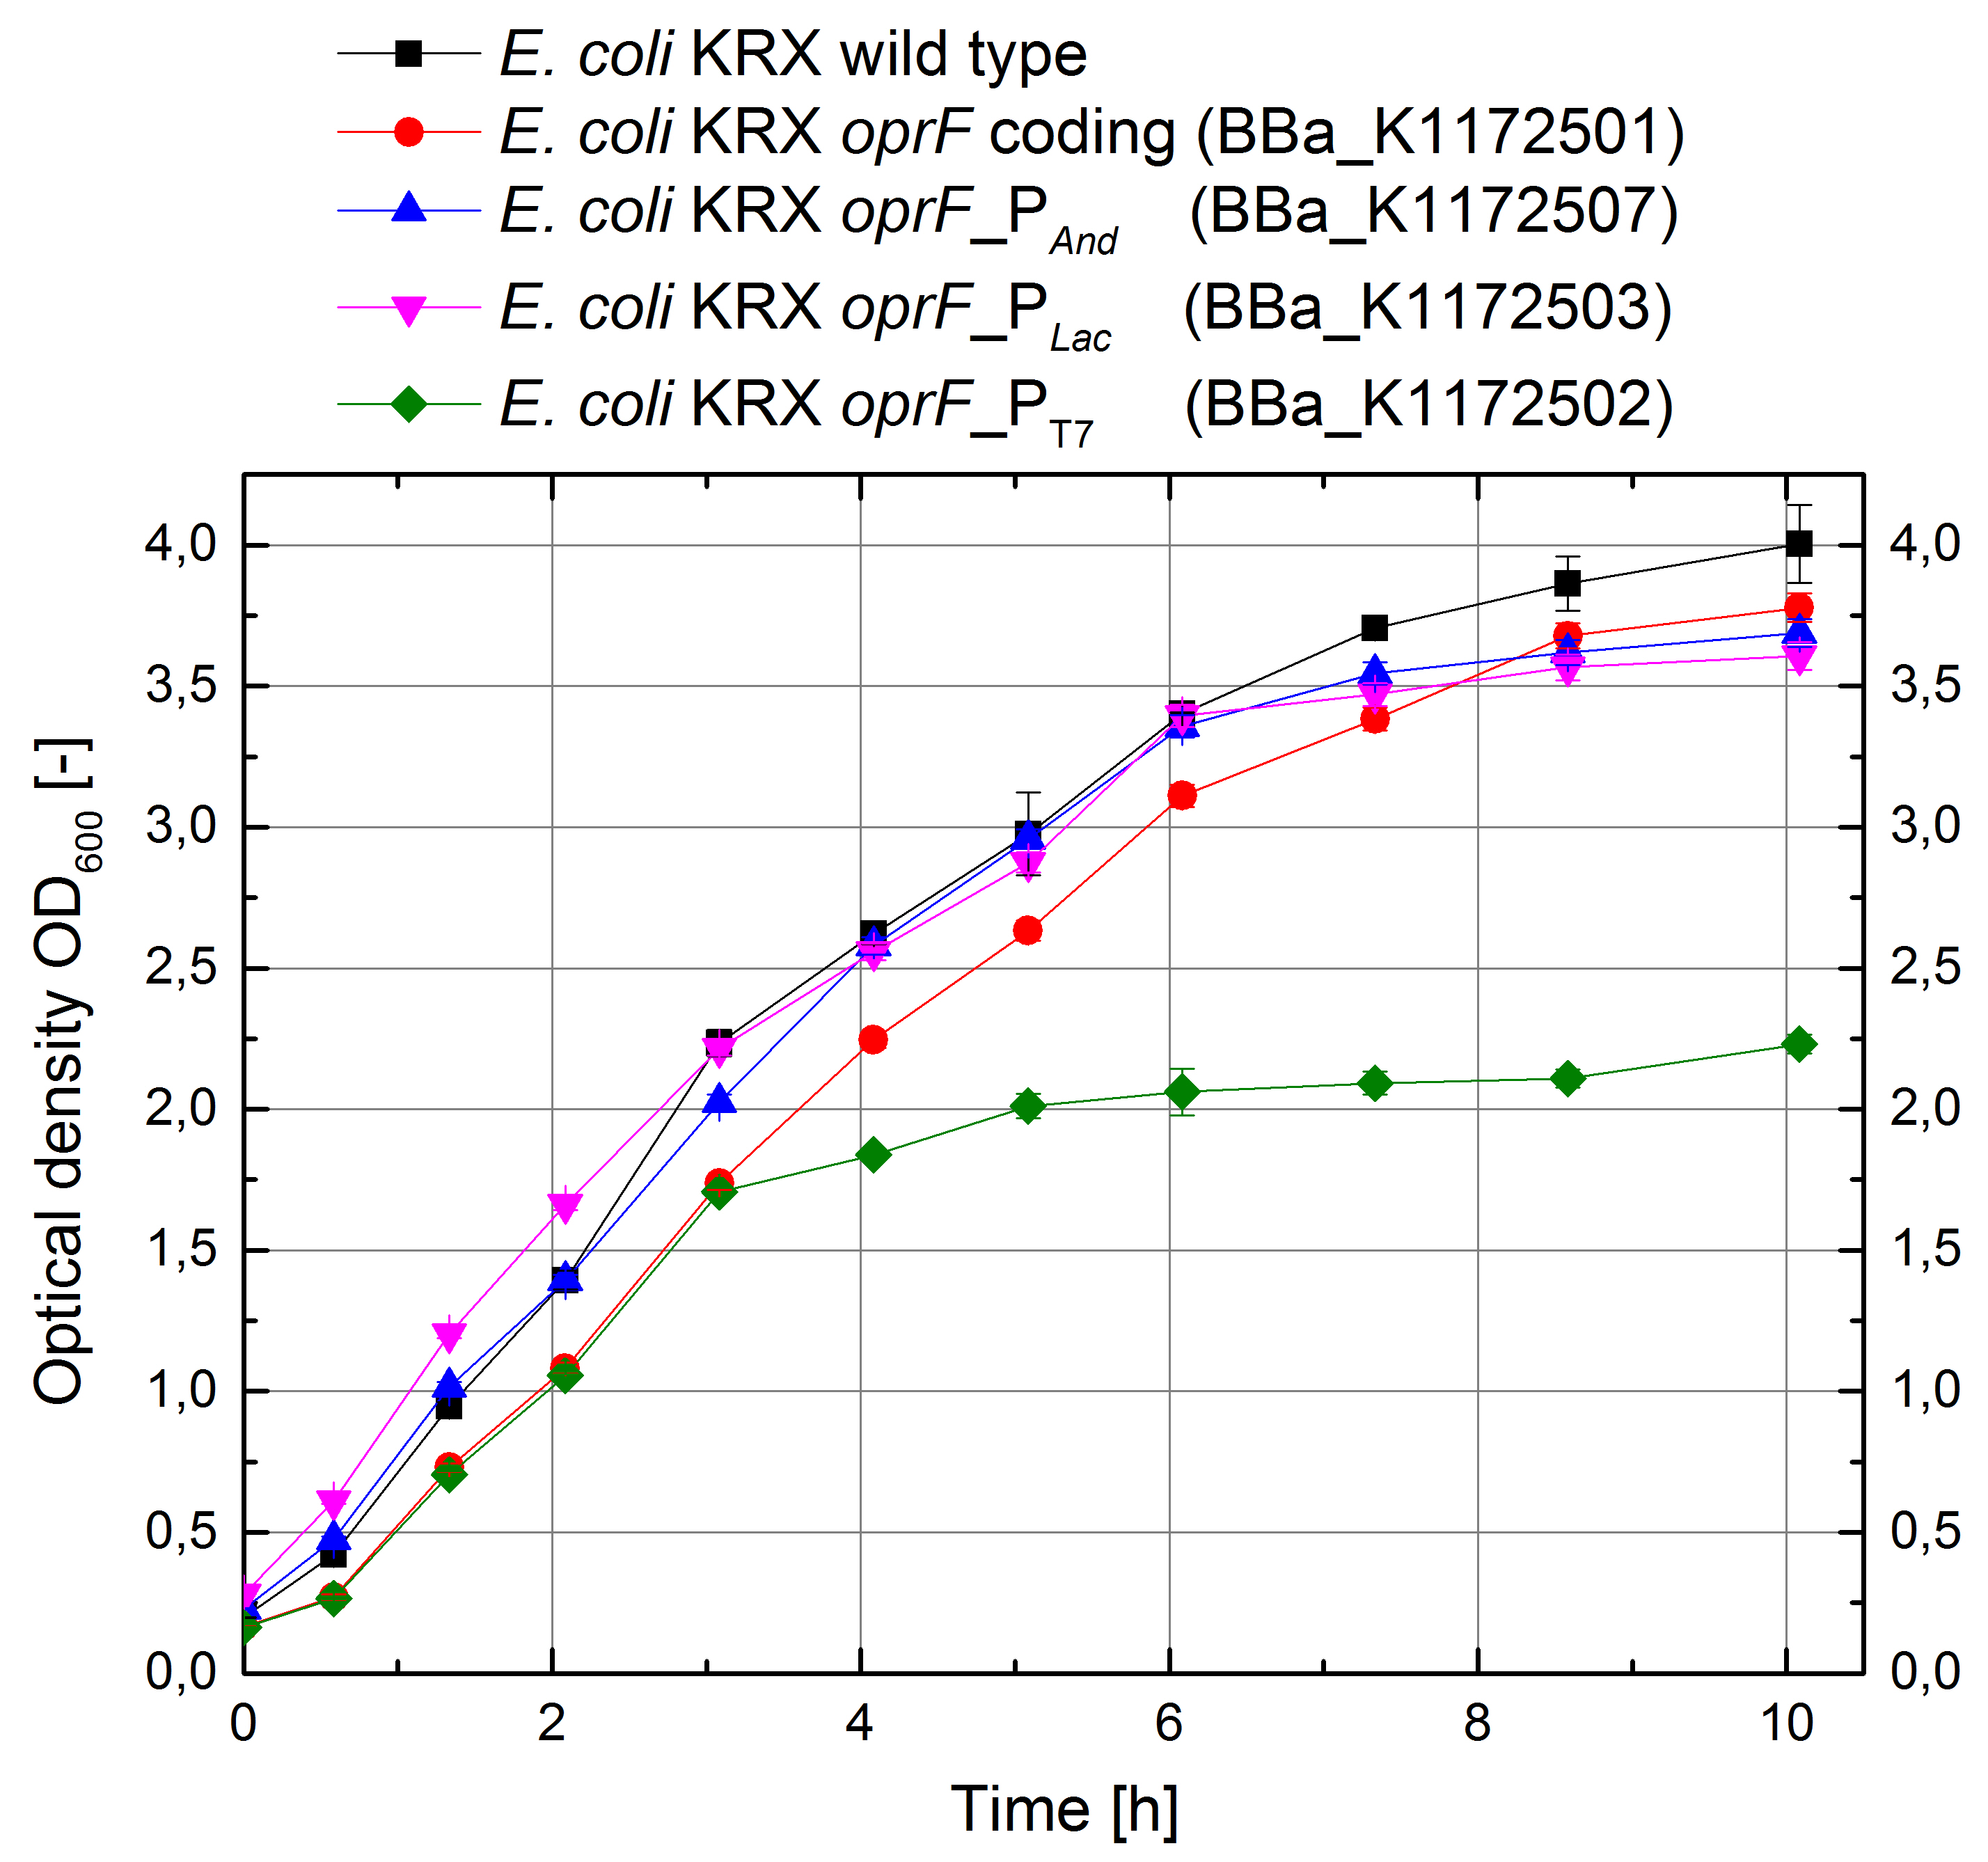
Figure 3: Growth curves for E. coli KRX with [http://2013.igem.org/Team:Bielefeld-Germany/Labjournal/ProtocolsPrograms#LB_medium LB medium]. Comparison between Escherichia coli KRX wild type and Escherichia coli KRX with oprF plasmids BBa_K1172501, BBa_K1172502, BBa_K1172503 and BBa_K1172507. oprF gene expression was induced for inducable promoters at OD600 = 1.0. All data are representing two biological and two technical replicates with standard deviation.
E. coli KRX wild type shows the best growth characteristics with a maximal optical density OD600 = 4.0. E. coli KRX with oprF coding plasmid shows a slightly lower growth due to the higher replication stress. E. coli KRX expressing oprF under control of strong Anderson and lac promoters are showing 10% decreased maximal cell density and E. coli KRX expressing oprF under control of T7 promoter shows a further decreased growth which was 45% reduced in comparison to E. coli KRX wild type. This lower growth is based on an increased expression of oprF on the cellular surface and therefore on higher metabolic pressure, which was confirmed with different assays, which can be found in the further characterization of the outer membrane protein OprF.
Hydrophobicity (Hexadecane) - Assay
The heterologous expression of the outer membrane porin OprF will enhance the hydrophobicity of cell membrane. The outward-facing side groups on each of the β-strands of the OprF monomer are hydrophobic. Therefore, heterologous expression should be detectable by an increase in hydrophobicity. The [http://2013.igem.org/Team:Bielefeld-Germany/Labjournal/ProtocolsPrograms Hexadecane-Hydrophobicity-Assay] is based on different affinities to hexadecane of dissimilar cell-types according to their cell surface. Hydrophobicity can be observed by specific changes in OD600 of the aqueous phase.
An increasing hydrophobicity of cell membrane changes the physicochemical properties of the cell. This could effect for example the cell-electrode interaction. Therefore, we investigated the cellular surface characteristic by comparing Escherichia coli KRX wild type with Escherichia coli KRX with BBa_K1172502, BBa_K1172503, BBa_K1172504, BBa_K1172505 and BBa_K1172507 (Table 2 and Figure 4).
The OprF strain shows an increasing affinity to hexadecane with increasing promoter strength in comparison to the wild type. Cells in which OprF was expressed from the T7 promoter (BBa_K1172502) showed the maximal hydrophobicity, which was three times higher than the affinity to hexadecane of the wild type.
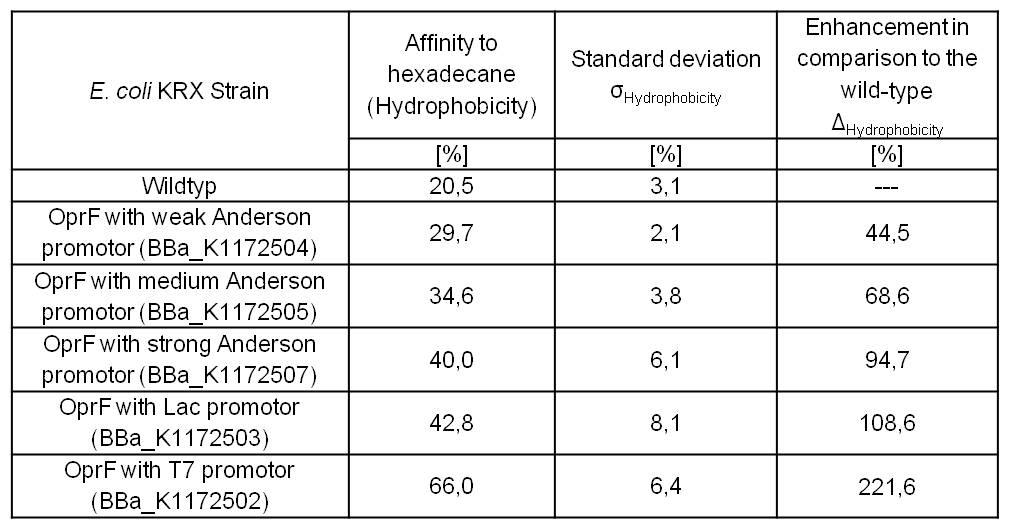
Table 2: Results of the [http://2013.igem.org/Team:Bielefeld-Germany/Labjournal/ProtocolsPrograms Hexadecane-Hydrophobicity-Assay]. Comparison of hydrophobicity between Escherichia coli KRX wild type and Escherichia coli KRX with BBa_K1172502, BBa_K1172503, BBa_K1172504, BBa_K1172505 and BBa_K1172507. Affinity to hexadecane (hydrophobicity) with standard deviation and enhancement in comparison to the wild type is shown. Two biological and at least three technical replicates were analyzed.
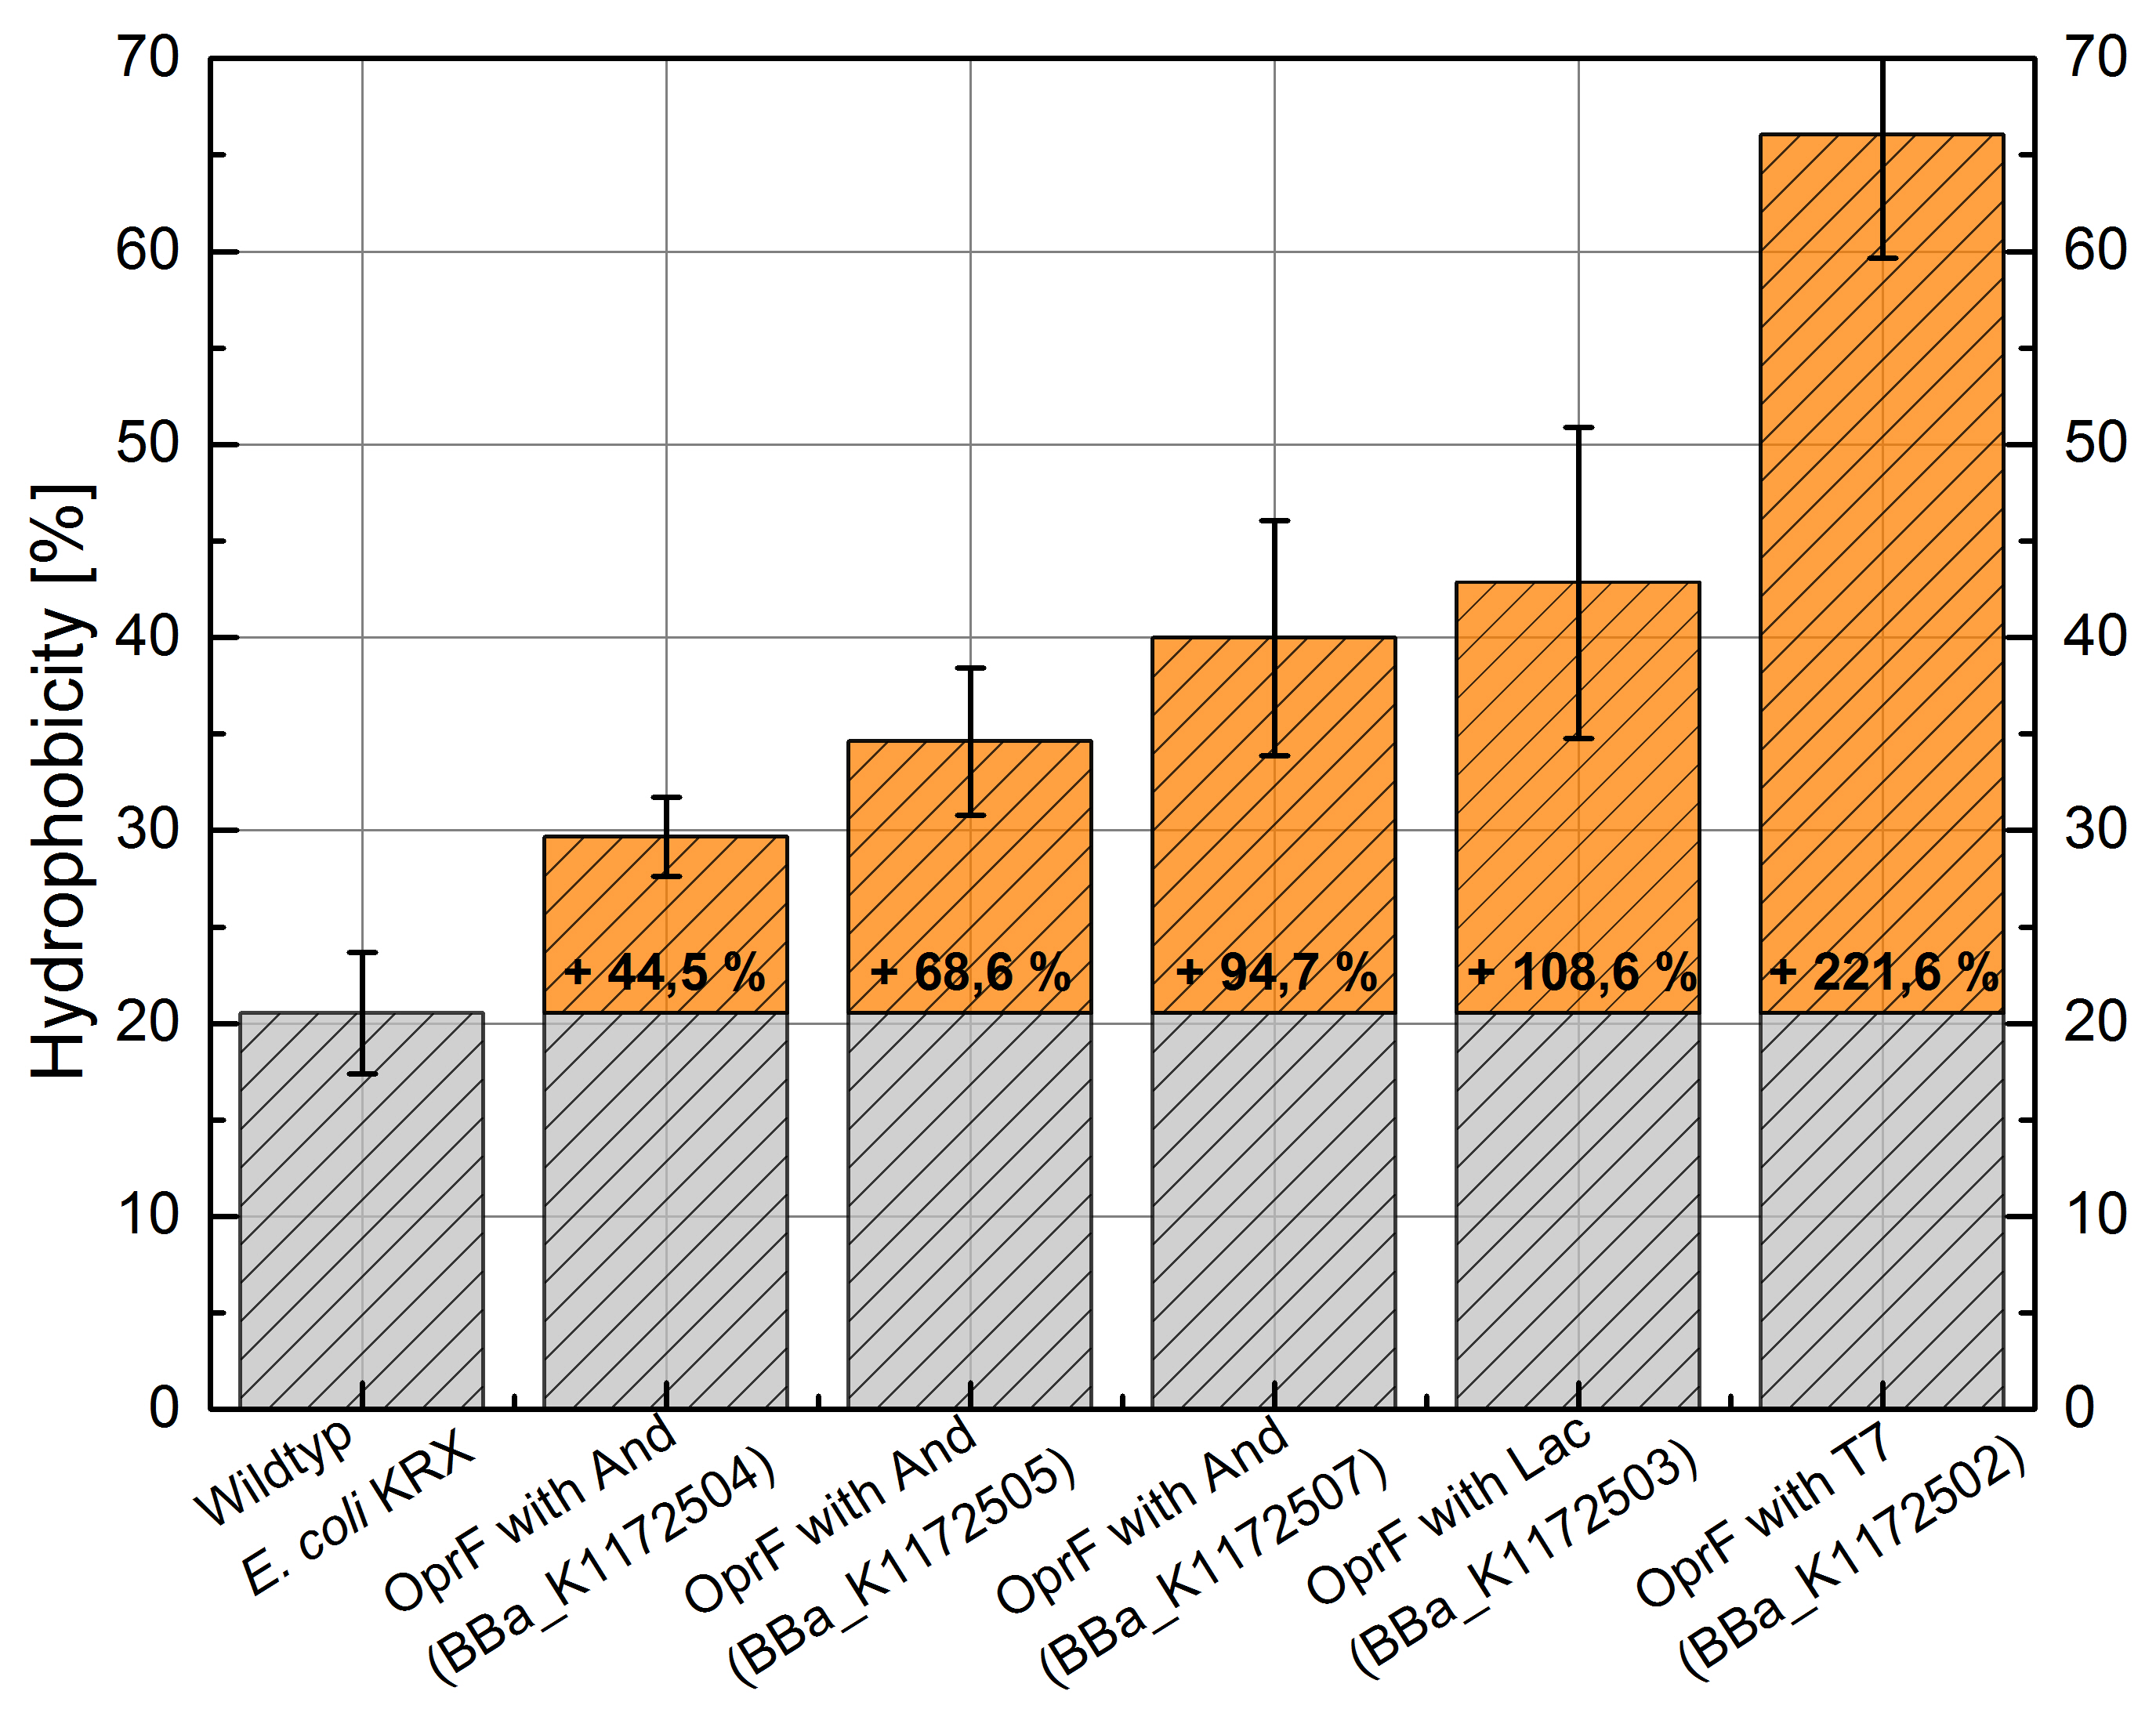
Figure 4: Results of the [http://2013.igem.org/Team:Bielefeld-Germany/Labjournal/ProtocolsPrograms Hexadecane-Hydrophobicity-Assay]. Comparison of hydrophobicity between Escherichia coli KRX wild type and Escherichia coli KRX with BBa_K1172502, BBa_K1172503, BBa_K1172504, BBa_K1172505 and BBa_K1172507. Affinity to hexadecane (hydrophobicity) with standard deviation and enhancement in comparison to the wild type is shown. Two biological and at least three technical replicates were analyzed.
The enhanced hydrophobicity of OprF expressing strains indicates a successful expression of the outer membrane porin in Escherichia coli. Such an increased hydrophobicity on the outer membrane caused by the expression of OprF will lead to an increase in the cellular adhesion to the surface of the carbon anode and an enhancement of direct electron transfer from Escherichia coli to the electrode.
Membrane permeability assays
NPN uptake assay
Besides testing the outer membrane hydrophobicity for physicochemical characterization of the E. coli surface, we measured the membrane permeability by fluorescence-based [http://2013.igem.org/Team:Bielefeld-Germany/Labjournal/ProtocolsPrograms NPN (N-Phenyl-1-naphthylamine) uptake assay] for outer membrane morphology characterization (Helander and Mattila-Sandholm, 2000).
NPN is a suitable chemical for measuring the membrane permeability of cells. An increasing NPN fluorescence intensity indicates an enhanced NPN uptake through the outer membrane and enhanced membrane permeability ([http://2013.igem.org/Team:Bielefeld-Germany/Project/Porins#References Loh et al., 1984]).
Figure 5 shows a higher fluorescence emission and hence higher membrane permeability with increasing promoter strength for OprF producing strains in comparison to Escherichia coli KRX wild type.

Figure 5: Results of the [http://2013.igem.org/Team:Bielefeld-Germany/Labjournal/ProtocolsPrograms NPN-uptake-assay]. Comparison of fluorescence emission between Escherichia coli KRX wild type and Escherichia coli KRX with BBa_K1172502, BBa_K1172503, BBa_K1172504, BBa_K1172505 and BBa_K1172507. Excitation at 355 nm with fluorescence emission scan from 320 to 390 nm wavelength and with standard deviation. Two biological and at least three technical replicates were analyzed.
Escherichia coli with heterologous expression of the outer membrane porin OprF shows more efficient NPN uptake than the Escherichia coli KRX wild type, suggesting an increased membrane permeability with increasing promoter strength. E. coli with oprF under T7 promoter control (BBa_K1172502) shows the maximal membrane permeability with 100% enhanced permeability in comparison to E. coli KRX wild type. The weak Anderson promoters seem unsuitable for heterologous expression of this gene.
ONPG assay
Another way of characterizing the outer cell membrane can be achieved with an fluorescence-based [http://2013.igem.org/Team:Bielefeld-Germany/Labjournal/ProtocolsPrograms ONPG assay]. [http://2013.igem.org/Team:Bielefeld-Germany/Labjournal/ProtocolsPrograms This assay] measures the membrane permeability by whole-cell lactase enzyme activity ([http://2013.igem.org/Team:Bielefeld-Germany/Project/Porins#References Zhou et al., 2010]).
Electron shuttle-mediated electron transfer (EET) determines the transport efficiency of electron shuttles across the cell membrane. With the [http://2013.igem.org/Team:Bielefeld-Germany/Labjournal/ProtocolsPrograms NPN uptake assay] we were able to quantify the transport efficiency of chemical molecules across the cell membrane. In contrast, the [http://2013.igem.org/Team:Bielefeld-Germany/Labjournal/ProtocolsPrograms ONPG assay] (whole-cell β-lactase enzyme activity assay) measures not only the diffusion of ONPG into the cell but also the release of its hydrolytic product across the cell membrane. With the [http://2013.igem.org/Team:Bielefeld-Germany/Labjournal/ProtocolsPrograms ONPG assay] we are able to observe diffusion processes in and out of the cell membrane.
Due to the fact that heterologous expression of oprF in Escherichia coli should not have an impact on the expression of β-lactase, we can assume that the β-lactase activity of E. coli KRX wild type and E. coli KRX with oprF expression plasmid is identical. All in all, the [http://2013.igem.org/Team:Bielefeld-Germany/Labjournal/ProtocolsPrograms ONPG assay] provides significantly more information than the [http://2013.igem.org/Team:Bielefeld-Germany/Labjournal/ProtocolsPrograms NPN uptake assay].

Figure 6: Results of the [http://2013.igem.org/Team:Bielefeld-Germany/Labjournal/ProtocolsPrograms ONPG-uptake-assay]. Comparison of ONPG hydrolysis between Escherichia coli KRX wild type and Escherichia coli KRX with BBa_K1172502, BBa_K1172503, BBa_K1172504, BBa_K1172505 and BBa_K1172507. Absorbance at 405 nm wavelength with standard deviation is shown. Two biological and at least three technical replicates were analyzed.
The ONPG hydrolysis rate by β-lactase is much higher for E. coli KRX containing OprF plasmids in contrast to E. coli KRX wild type. Whereas we could only observe a minimal hydrolysis activity in the wild type, E. coli KRX, carrying OprF expression plasmids, shows a much faster ONPG hydrolysis rate with increasing promoter strength and a maximal rate for E. coli KRX with T7 promoter (BBa_K1172502), which is 30 times higher than wild type hydrolysis rate.
In summary, we could prove that the heterologous expression of OprF from Pseudomonas fluorescens in Escherichia coli significantly improves the membrane permeability. The [http://2013.igem.org/Team:Bielefeld-Germany/Labjournal/ProtocolsPrograms NPN] and [http://2013.igem.org/Team:Bielefeld-Germany/Labjournal/ProtocolsPrograms ONPG] assay show comparable results. Outer membrane permeability of E. coli is enhanced with increasing promoter strength for oprF expression. The wild type shows only a weak uptake rate of chemical molecules (NPN) and no product release as quantified with [http://2013.igem.org/Team:Bielefeld-Germany/Labjournal/ProtocolsPrograms ONPG assay]. Therefore, the E. coli wild type is not well suitable for a usage in the MFC using mediators. In contrast, membrane optimized Escherichia coli with OprF shows increased diffusion across the cellular membrane, indicating a possible optimization of electron shuttle-mediated electron transfer (EET) to the anode and increasing current production.
Atomic Force Microscopy (AFM)
In addition to the morphological and physicochemical characterization of the Escherichia coli outer membrane, we wanted to visualize the surface. The technique of choice for this is Atomic Force Microscopy (AFM). [http://2013.igem.org/Team:Bielefeld-Germany/Labjournal/ProtocolsPrograms After cell preparation] we were able to get AFM pictures of the E. coli surface with the help of the working group of [http://www.physik.uni-bielefeld.de/biophysik Prof. Dr. Dario Anselmetti], with special help from [http://www.physik.uni-bielefeld.de/biophysik/mitarbeiter/walhorn.html Dr. Volker Walhorn].
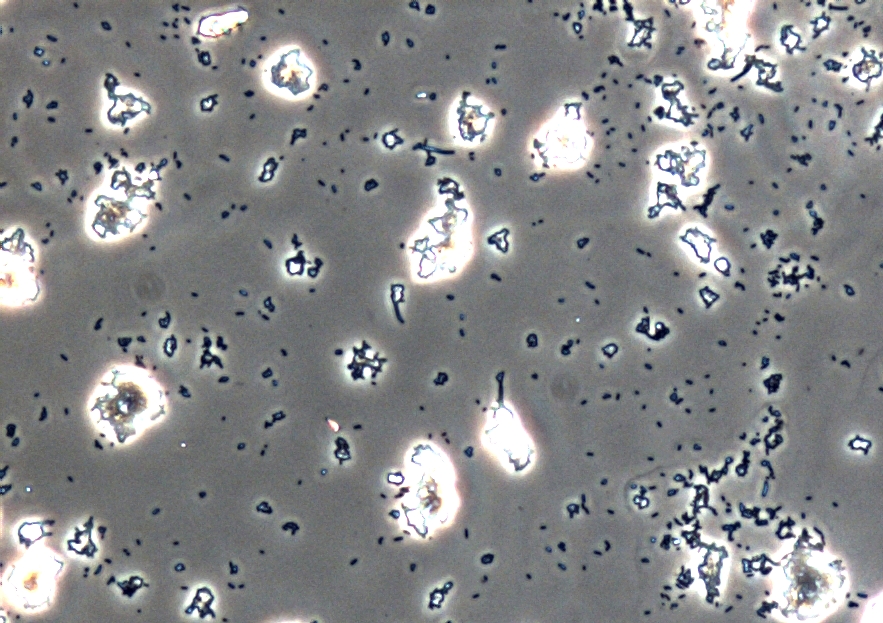
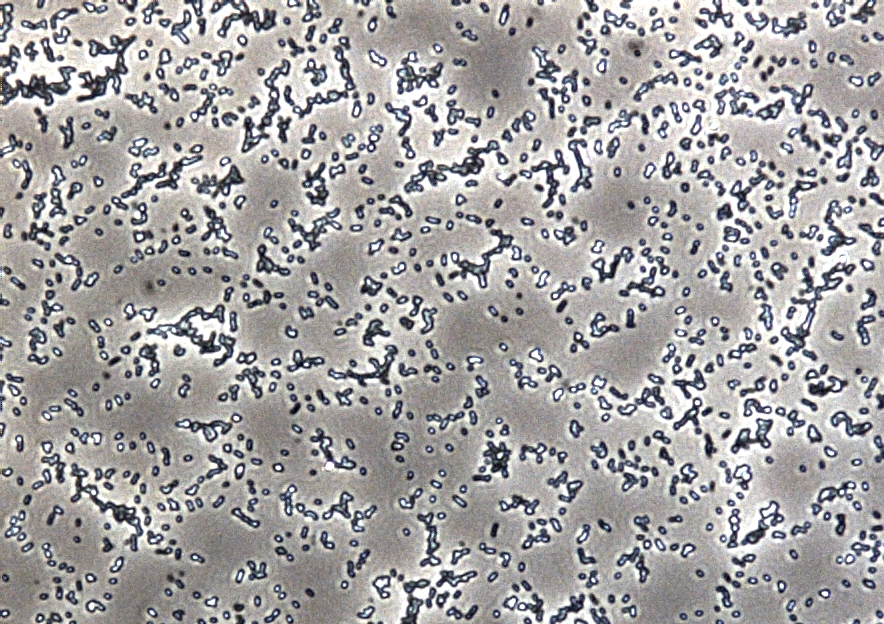
Figure 8: Light microscopy of AFM layer after [http://2013.igem.org/Team:Bielefeld-Germany/Labjournal/ProtocolsPrograms cell preparation] of Escherichia coli carrying oprF under the control of T7 promoter (BBa_K1172502). Enhanced cell clustering, caused by higher hydrophobicity, can be observed.
Microscopy of the AFM glass layer after [http://2013.igem.org/Team:Bielefeld-Germany/Labjournal/ProtocolsPrograms cell preparation], before AFM measurement, shows the different cell properties. Number of cells as well as magnification scale are the same. Escherichia coli KRX expressing oprF from a T7 promoter (BBa_K1172502) presents a clustering of cells, whereas the wild type forms a monolayer. Thus, the increased hydrophobicity of the cell surface is already visible even with an ordinary light microscope.
AFM was carried out using the [http://www.bruker.com/de/products/surface-analysis/atomic-force-microscopy/multimode-8/overview.html MultiMode® 8 AFM from Bruker]. The measurements were performed on air with ‘Tapping Mode’ and in water with ‘Peak Force Mode’.
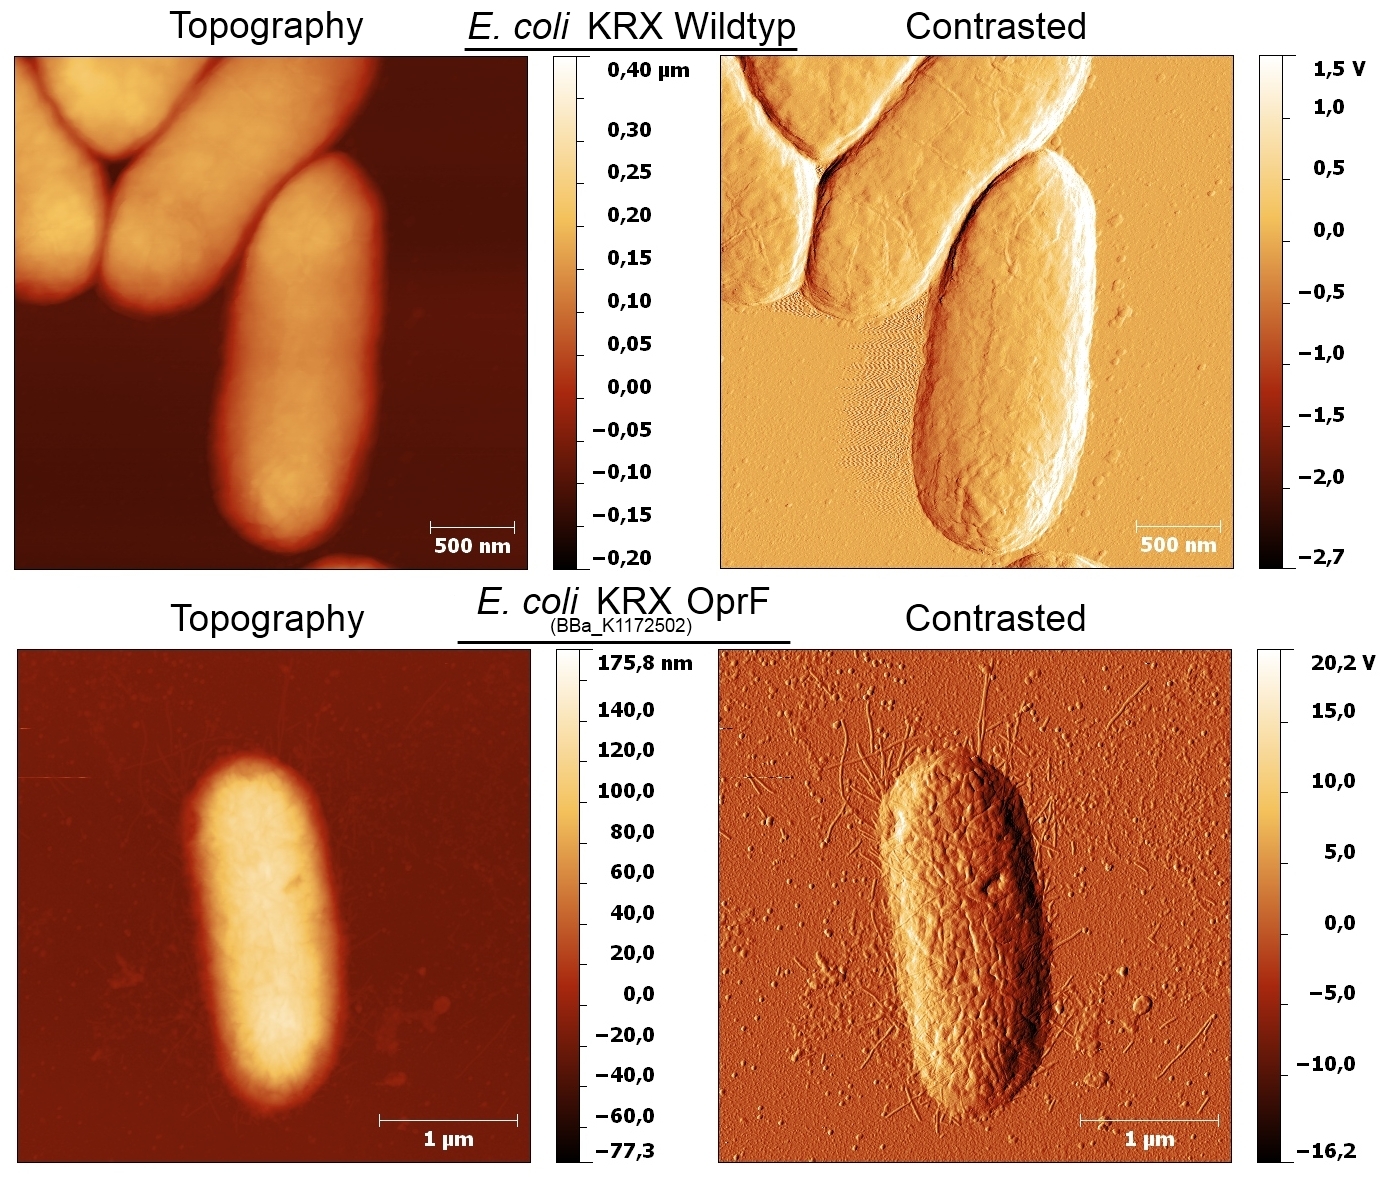
Figure 9: AFM images of the cell surface for Escherichia coli KRX wild type and Escherichia coli KRX with heterologous expression of porin OprF (BBa_K1172502). Images are shown in Topography and Contrast mode.
Based on the AFM images, Escherichia coli KRX with oprF under control of T7 promoter (BBa_K1172502) shows a slightly rougher cell surface morphology in contrast to Escherichia coli KRX wild type. Outer membrane porin OprF from Pseudomonas fluorescens usually forms trimer complexes on the membrane, which leads to enhanced roughness of the cell surface. ([http://2013.igem.org/Team:Bielefeld-Germany/Project/Porins#References Yong et al., 2013])
The heterologous expression of the porin OprF causes a slightly rougher membrane, the morphology and thus the viability of Escherichia coli is preserved to the greatest possible extent.
Microbial Fuel Cell Measurement
All results so far indicated the potential for an increase in energy production. This assumption was confirmed by cultivation of Escherichia coli KRX with OprF (BBa_K1172502) in comparison to Escherichia coli KRX wild type in the Microbial Fuel Cell.
Indeed, the extracellular electron transfer mediated by electron shuttles is improved in the OprF expressing strain resulting in an increased bioelectricity output (Figure 10 - 13).
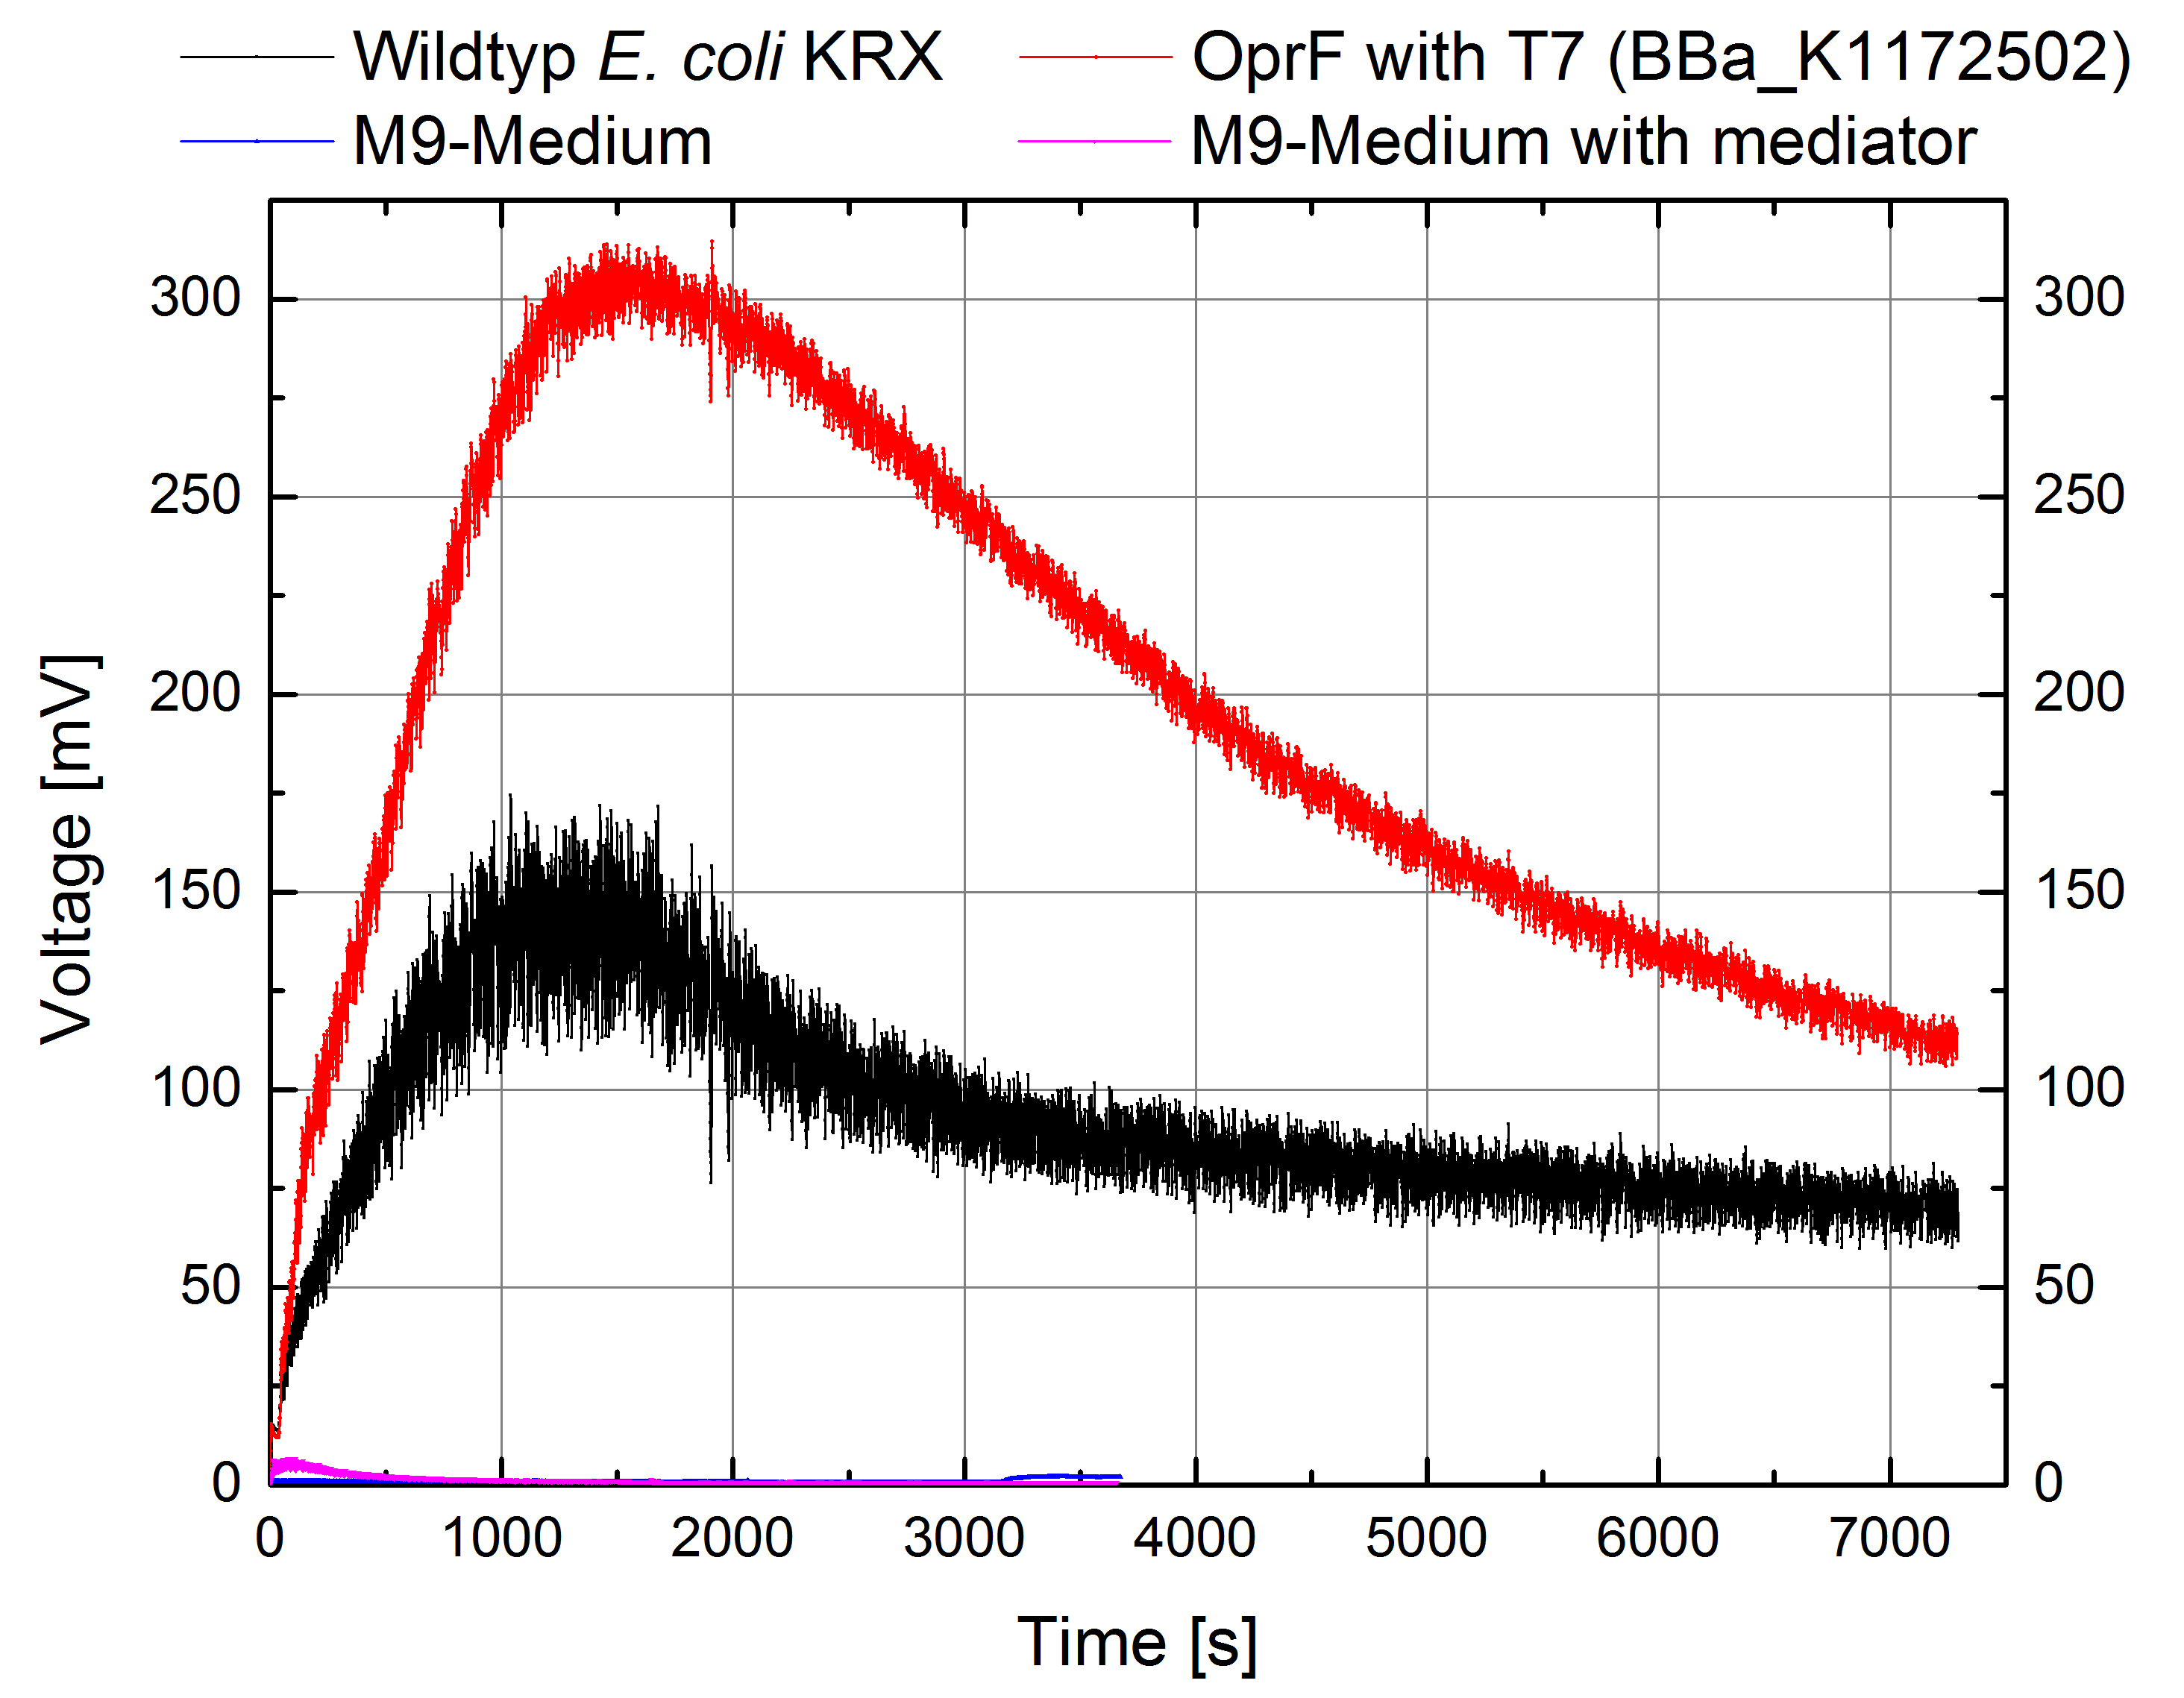
Figure 10: Microbial Fuel Cell results from cultivation of Escherichia coli KRX with OprF (BBa_K1172502) in contrast to Escherichia coli KRX wild type. Voltage curve from Escherichia coli KRX wild type, Escherichia coli KRX expressing OprF (BBa_K1172502), M9 medium with Methylene Blue as mediator and M9 medium without mediator is shown over time and over a resistance of 200 Ω.
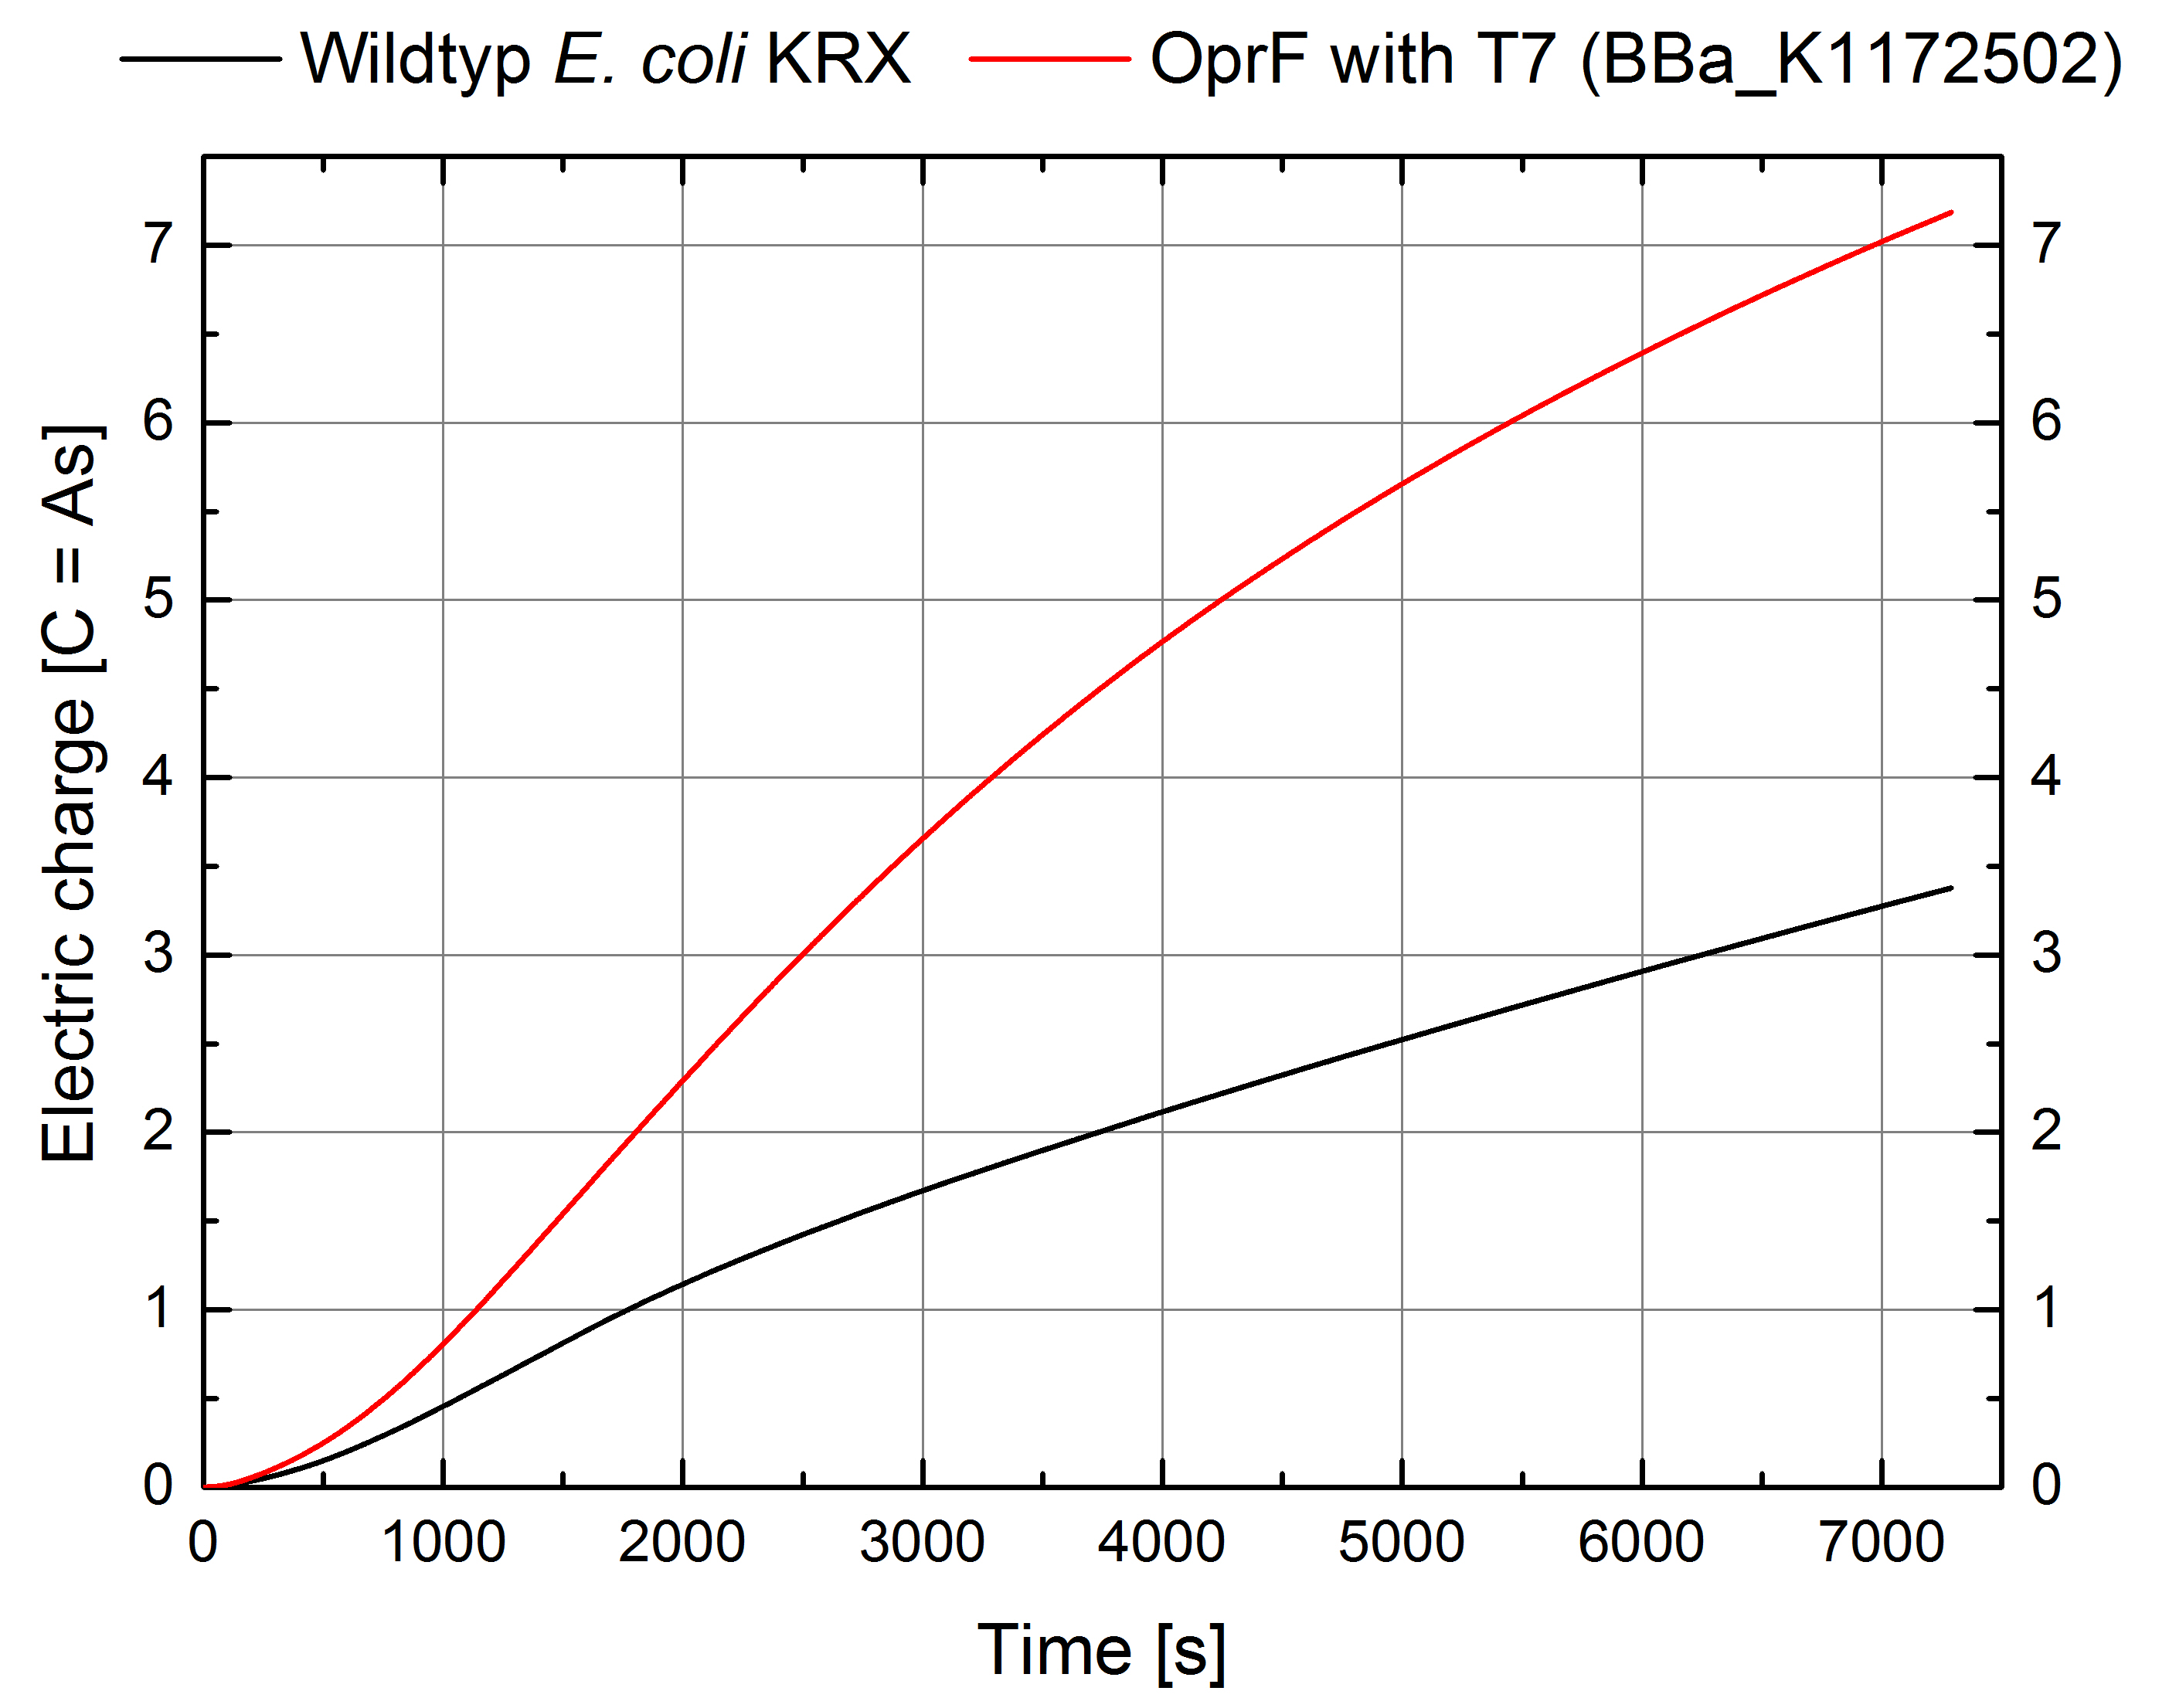
Figure 11: Microbial Fuel Cell results from cultivation of Escherichia coli KRX expressing OprF (BBa_K1172502) in contrast to Escherichia coli KRX wild type. Electric charge curve from Escherichia coli KRX wild type and Escherichia coli KRX carrying OprF (BBa_K1172502). M9 medium was used with mediator Methylene Blue and with measurement over a resistance of 200 Ω.
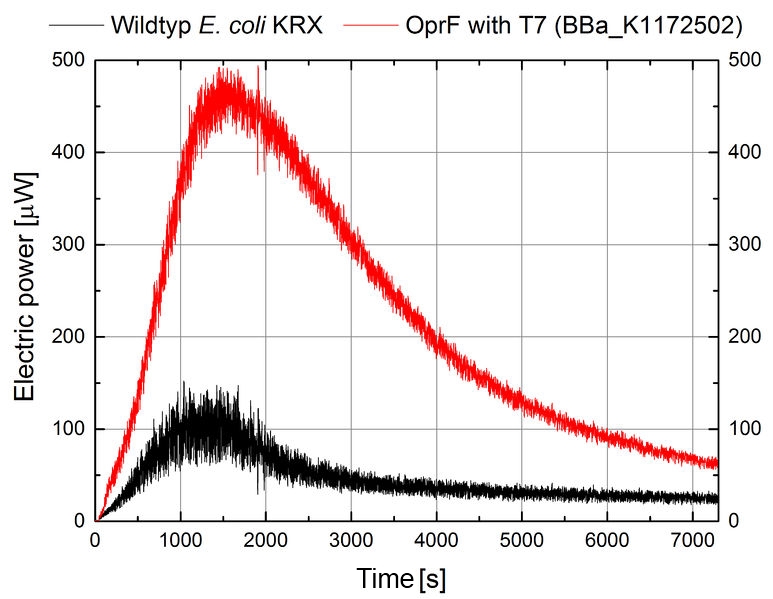
Figure 12: Microbial Fuel Cell results from cultivation of Escherichia coli KRX expressing OprF (BBa_K1172502) in contrast to Escherichia coli KRX wild type. Electric power curve from Escherichia coli KRX wild type and Escherichia coli KRX carrying OprF (BBa_K1172502). M9 medium was used with mediator Methylene Blue and with measurement over a resistance of 200 Ω.
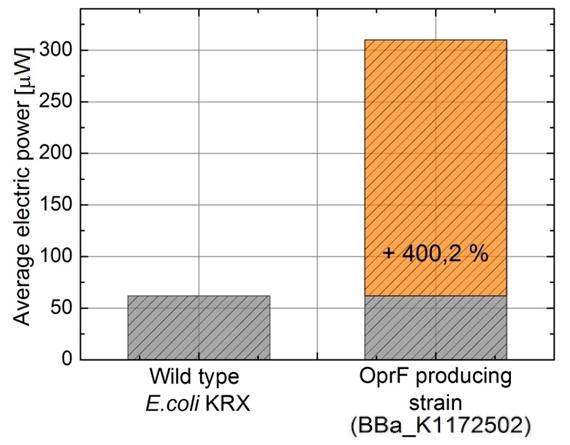
Figure 13: Microbial Fuel Cell results from cultivation of Escherichia coli KRX expressing OprF (BBa_K1172502) in contrast to Escherichia coli KRX wild type. Average electric power bar chart from Escherichia coli KRX wild type and Escherichia coli KRX carrying OprF (BBa_K1172502). M9 medium was used with mediator Methylene Blue and with measurement over a resistance of 200 Ω.
Escherichia coli KRX with OprF (BBa_K1172502) shows 108 % higher maximal voltage than Escherichia coli KRX wild type with a maximum of 308 mV. Over the whole cultivation the voltage was improved by about 100 %. Tests using M9-medium with and without mediator Methylene Blue show no voltage, indicating that bioelectricity generation is solely due to the bacteria.
The calculation of the electric charge confirms the described results. Electric charge is equivalent to the number of transported electrons and is enhanced by 111 % for Escherichia coli KRX with OprF (BBa_K1172502). The maximal electric charge of 7,2 C demonstrates that heterologous expression of outer membrane porin OprF enhances extracellular electron transfer dramatically. High membrane permeability is crucial for efficient mediator transport across the membrane and therefore for high bioelectricity generation.
Finally, the calculated power curve shows 239 % enhanced electric power for Escherichia coli KRX carrying OprF (BBa_K1172502) with a maximal electric energy transfer rate of 475 μW and a 300% enhanced average electric power.
Conclusion
Cell membranes are protective layers, which are crucial for physiology of the bacteria. In consideration of the Microbial Fuel Cell, the cell membrane is also a barrier which decreases mediator and thus electron exchange between bacteria and anode. With heterologous expression of the outer membrane porin OprF from Pseudomonas fluorescens in Escherichia coli we were able to enhance membrane permeability. With this optimized cell membrane surface we generate an efficient electron shuttle-mediated EET with decreased limitation of EET by membrane barrier. In contrast to a perforation of the membrane with chemicals, cell viability is maintained with OprF expression ([http://2013.igem.org/Team:Bielefeld-Germany/Project/Porins#References Liu et al., 2012]). Beside improvement of EET, enhanced hydrophobicity shows optimized cell adhesion to the anode for biofilm formation and direct electron transfer.
The heterologous expression of OprF is a genetic strategy to optimize electron shuttle-mediated electron transfer as well as electricity generation in Microbial Fuel Cells. The most suitable and efficient OprF device for Escherichia coli is a combination with the rhamnose inducible T7 promoter (BBa_K1172502).
Characterization of Team Bielefeld-Cebitec 2014
NPN-Assay
The funtionality of the outer membrane porin OprF (BBa_K1172507) in E.coli KRX ΔdcuB::oprF was investigated with a NPN-Uptake-Assay (Cheng et al., 2005).
1-N-Phenylnaphthylamine (NPN) changes fluorescence activity between aqueous and hydrophobic milieus. There is only minor fluorescence in aqueous solution, but the transport in the hydrophobic periplasmatic space causes an increased fluorescence. So NPN fluorescence is a good indicator for membrane permeability. Expression of the outer membrane porines OprF effect an increasing membrane permeability.(Loh et al., 1984)

Figure 14: Results of the NPN-Uptake-Assay. Comparison between Escherichia coli KRX wildtype and Escherichia coli KRX with BBa_K1172507, BBa_K1172502 and Escherichia coli KRX with genome integrated oprF gene (E.coli KRX ΔdcuB::oprF).
Figure 14 shows the results of the NPN-Uptake-Assay. Higher fluorescence emission and higher membrane permeability could be observed with increasing promotor strength for oprF. The genome integrated oprF shows mid-level fluorescence emission and membrane permeability. Highest fluorescence levels could be measured with the oprF gene on a high-copy pSB1C3 plasmid under control of the T7 promotor.
Genome integrated oprF showed almost the same membrane permeability as the constitutive expressed oprF with BBa_K1172507. There even seems to be a marginal higher expression of the genome integrated oprF in contrast to the plasmid coded oprF although the same constitutive promotor (BBa_J23104) is used. This could be explained by physiological condition of the cell. Constitutive expression of the high-copy oprF causes cell stress. Protein expression could be automatically downregulated by the cells. The single-copy genome integrated oprF showed a reduced expression level, therefor cell stress is also smaller. As a consequence E. coli cells showed a more effective expression of the outer membrane porin OprF adjusted on physiological cell condition. So we constructed a stable E. coli strain, which shows constitutive expression of outer membrane porines OprF because of genome integration of oprF gene.
We improved characterization of BBa_K1172501 via NPN-Uptake assay. Fluorescence emission was measured between 380 and 520 nm. 1-N-Phenylnaphthylamine (NPN) shows maximum fluorescence at 415 nm by excitation wavelength of 355 nm. iGEM13_Bielefeld-Germany measured fluorescence emission maximum at 355 nm, which leaded to similar results but has to be attributed to reflection effects during measurement.
Methods
NPN membrane permeability assay
- inoculate 20 ml of an overnight culture with 1 ml preculture
- incubate cells at 37 °C until OD600 of 0.5
- centrifugation of whole culture volume (10 min at 3000 g)
- discard entire supernatant
- resuspend pellet in the same volume PBS Buffer
- repeat washing steps 3 to 5 twice
- mix washed cells with 10 mM NPN stock solution to a final concentration of 10 μM in a UV cuvette
- fluorescence measurement with Shimadzu fluorescence spectrophotometer
- sample volume: 1 ml
- Excitation: 355 nm
- Emission Bandwidth: 380 - 500 nm
-
Cheng et al., 2005. New antibiotic peptides, useful in treating or preventing a microbial or viral infections or in inactivating Gram-positive and -negative bacteria, protozoa, fungi and virus. patent DE10360435 (A1) ― 2005-07-28
-
Loh et al., 1984. Use of the fluorescent-probe 1-Nphenylnaphthylamine to study the interactions of aminoglycoside antibiotics with the outer-membrane of Pseudomonas aeruginosa. Antimicrob. Agents Chemother., vol. 26, pp. 546-551
- This assay has been used to measure cell membrane hydrophobicity.
- Protocol
- Inoculate an overnight culture (30 mL with 1 mL of pre-culture)
- Centrifugate (5 min at 4000 g) of 2 mL overnight culture (OD 4-6)
- Discard supernatant and wash pellet 3 times with 1 mL of PBS buffer
- Resuspend pellet in 1 mL 0,9% NaCl and measurement of OD600
- Add x μL of washed cells to 0,9% NaCl for a final volume of 3 mL . Final OD600 should be approximately 0,3 (denoted as A0, calculate exact value)
- Add 3 mL Hexadecan and vortex for 60 sec
- Incubation for 15 min
- Discard the upper organic phase and measure OD600 of the aqueous phase (denoted as A)
- Hydrophobicity can be calculated using the equation: affinity [%] = 100 x [1 – (A/A0)]
- AFM: During the last years, atomic force microscopy has been used increasingly to investigate microbial surfaces at high resolution. The technique provides three-dimensional images of the surface ultrastructure with molecular resolution, in real time, under physiological conditions, and with minimal sample preparation.
AFM was carried out using the [http://www.bruker.com/de/products/surface-analysis/atomic-force-microscopy/multimode-8/overview.html MultiMode® 8 AFM from Bruker]. The measurements were performed on air with ‘Tapping Mode’ and in water with ‘Peak Force Mode’.
- Cell preparation:
- Inoculating an overnight culture (30 mL with 1 mL of pre-culture) and induce gene expression if necessary at OD600 = 1.0.
- Centrifugation (5 min at 5000 g) of 2 mL overnight culture (OD600 5 ~ 1 ∙ 109 cells/mL).
- Discard supernatant and wash pellet 3 times with 1 mL of ultra pure water.
- Resuspend pellet in 2 mL ultra pure water (2 ∙ 109 cells).
- Preparing of AFM glass slides (0.5 cm2):
- 10 minutes sonication of glass slides in acetone.
- 10 minutes sonication of glass slides in ethanol.
- 10 minutes sonication of glass slides in ultra pure water.
- Dry glass slides under gentle N2 flow.
- Coating of AFM glass slides with prepared cells:
- Drop 5 μL of a 1:4 dilution of prepared cells (1,25 ∙ 106 cells) to the prepared glass slides for a submonolayer coverage.
- Dry glass surface with cells under gentle N2 flow.
- Wash glass surface three times with ultra pure water and dry between under gentle N2 flow.
- The coated glass slides were kept cool until AFM measurement.
- Cell preparation:
- Inoculate an overnight culture (30 mL with 1 mL of pre-culture).
- Centrifugation (8 min at 3000 g) of the whole overnight culture and discard supernatant.
- Resuspend pellet in equal volume of 10 mM PBS buffer.
- Repeat steps 2) and 3) twice.
- Mix 1 mL of washed cells with a 10 mM stock solution of NPN (1 N phenylnaphthylamine) to a final concentration of 10 µM.
- Transfer 200 µL of samples to a flat bottomed black 96 well plate.
- Direct fluorescence measurement with [http://www.tecan.com/platform/apps/product/index.asp?MenuID=1812&ID=1916&Menu=1&Item=21.2.10.1 Tecan Infinite® M200 platereader].
- [http://www.tecan.com/platform/apps/product/index.asp?MenuID=1812&ID=1916&Menu=1&Item=21.2.10.1 Tecan Infinite® M200 platereader] parameters:
- Sample volume = 200 μL
- Excitation = 355 nm
- Emission Bandwidth = 280 – 550 nm
- Cell preparation:
- Inoculate an overnight culture (30 mL with 1 mL of pre-culture).
- Centrifugation (8 min at 3000 g) of the whole overnight culture and discard supernatant.
- Resuspend pellet in equal volume of 10 mM PBS buffer.
- Repeat steps 2) and 3) twice.
- Inside a clear, flat bottomed 96 well plate, mix 180 µL ONPG (o-nitrophenyl-b-galactopyranoside) stock solution (3 mM in 10 mM PBS buffer) with 20 µL of washed cells.
- Direct absorbance measurement with [http://www.tecan.com/platform/apps/product/index.asp?MenuID=1812&ID=1916&Menu=1&Item=21.2.10.1 Tecan Infinite® M200 platereader].
- [http://www.tecan.com/platform/apps/product/index.asp?MenuID=1812&ID=1916&Menu=1&Item=21.2.10.1 Tecan Infinite® M200 platereader] parameters:
- Sample volume = 200 μL
- Absorbance = 405 nm
- Release of periplasmic protein fraction from E. coli by cold osmotic shock
- Modified protocol from [http://www.jbc.org/content/240/9/3685.full.pdf+html?sid=4a90c176-0ec3-489f-8c82-4734274cebf5 Neu & Heppel, 1965].
- Centrifuge E. coli cell suspension for 5 min at 14,000 g (4 °C) to collect the cells
- Discard the entire supernatant
- Resuspend the cells in ice-cold cell fractionating buffer 1. The resulting volume should be 1/4 of the former suspension volume
- Incubate for 20 min on ice. Invert the suspension at regular intervals to counteract sedimentation
- Centrifuge the cell suspension for 15 min at 14,000 g (4 °C)
- Discard the entire supernatant
- Resuspend the cells in ice-cold cell fractionating buffer 2. The resulting volume should be 1/4 of the former suspension volume
- Incubate for 10 up to 20 min on ice under regular invertion
- Centrifuge the cell suspension for 15 min at 14,000 g (4 °C)
- Save the supernatant, which contains the periplasmatic proteins and membrane proteins when using Cell fractionating buffer 2.2 and 2.3
- If the periplasmatic protein fraction is turbid, re-centrifuge and filter it through a 0.2 µm filter
- [http://2013.igem.org/Team:Bielefeld-Germany/Labjournal/ProtocolsPrograms#Cell_Fractioning_Buffers Here] you can find the used different Cell Fractioning Buffers.
- MALDI-TOF MS/MS: Vera Ortseifen gave us support dealing with protein analysis by MALDI-TOF MS. After our sample preparation and tryptic digestion she measured the samples and also provided help in the data analysis.
- Atomic Force Microscopy: The working group of Prof. Dr. Dario Anselmetti, with special help from Dr. Volker Walhorn, measured our self-prepared AFM glass slides and visualized the cell surface of Escherichia coli with porins by atomic force microscopy.
Hancock REW, Brinkman FSL (2002) Function of Pseudomonas porins in uptake and efflux. [http://www.annualreviews.org/doi/abs/10.1146/annurev.micro.56.012302.160310| Annu Rev Microbiol (56):17–38].
Helander IM, Mattila-Sandholm T (2000) Permeability barrier of the gramnegative bacterial outer membrane with special reference to nisin. [http://www.sciencedirect.com/science/article/pii/S016816050000307X|Int J Food Microbiol 60: 153–161].
Liu J, Qiao Y, Lu ZS, Song H, Li CM (2012) Enhance electron transfer and performance of microbial fuel cells by perforating the cell membrane. [http://www.sciencedirect.com/science/article/pii/S1388248111004723|Electrochem Commun 15: 50–53].
Logan BE (2009) Exoelectrogenic bacteria that power microbial fuel cells. [http://www.nature.com/nrmicro/journal/v7/n5/full/nrmicro2113.html| Nat Rev Microbiol (7): 375–381].
Loh B, Grant C, Hancock REW (1984) Use of the fluorescent-probe 1-Nphenylnaphthylamine to study the interactions of aminoglycoside antibiotics with the outer-membrane of Pseudomonas aeruginosa. [http://aac.asm.org/content/26/4/546.short|Antimicrob Agents Chemother 26: 546–551].
Yong YC, Yu YY, Yang Y, Liu J, Wang JY, Song H (2013) Enhancement of Extracellular Electron Transfer and Bioelectricity Output by Synthetic Porin. [http://onlinelibrary.wiley.com/doi/10.1002/bit.24732/full|Biotechnology and Bioengineering 110 (2): 408-416].
Zhou ZX, Wei DF, Guan Y, Zheng AN, Zhong JJ (2010) Damage of Escherichia coli membrane by bactericidal agent polyhexamethylene guanidine hydrochloride: Micrographic evidences. [http://onlinelibrary.wiley.com/doi/10.1111/j.1365-2672.2009.04482.x/full|J Appl Microbiol 108: 898–907].
References
Methods
Hexadecan Assay
Preparing samples for Atomic Force Microscopy (AFM) analysis of the OM of cells
NPN membrane permeability assay
ONPG membrane permeability assay
Cold osmotic shock
Acknowledgements
References
Added by XHD-Wuhan-Pro-China
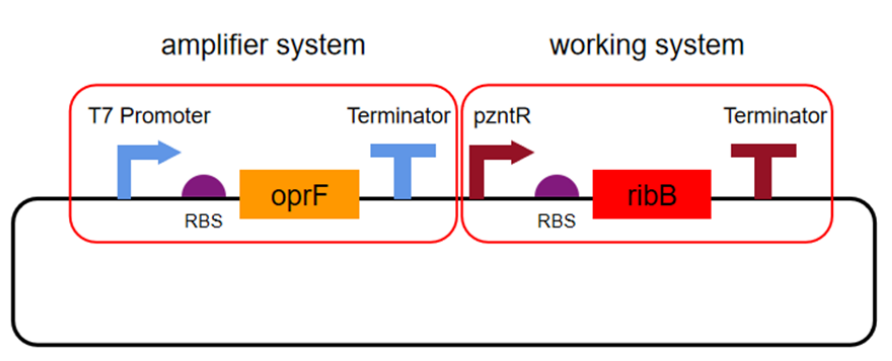
oprF Verification
RBS ribosome binding site
oprF porin gene
Terminator Terminator
pzntR zinc-sensitive promoter
RibB gene for riboflavin synthesis
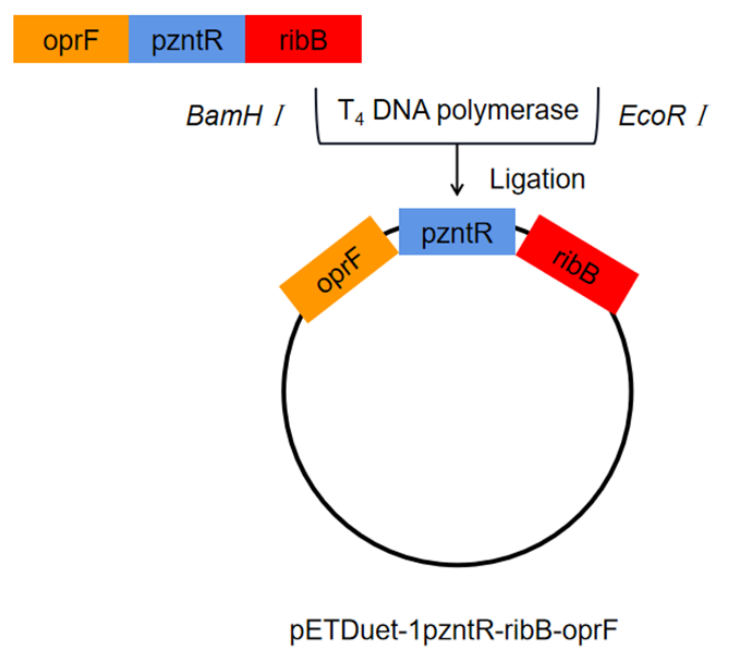
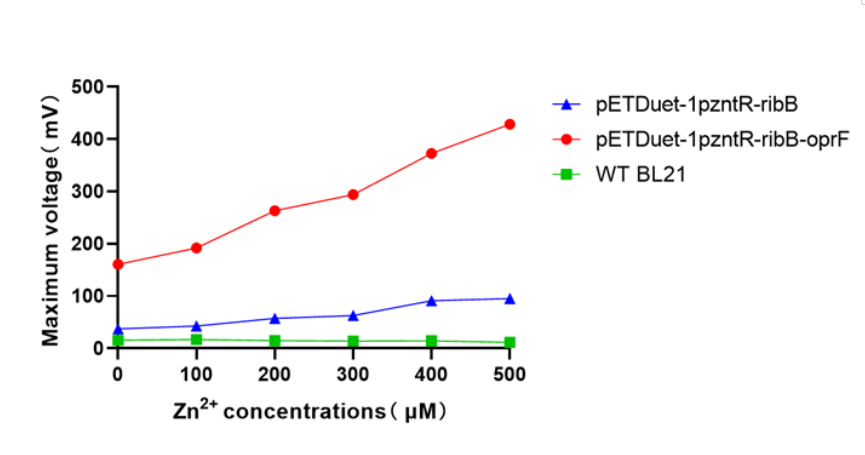
The porin gene (oprF) was synthesized by direct DNA synthesis. oprF and pzntR were ligated with ribB. The ligated gene fragment was double digested with BamHⅠ and EcoRⅠ and then inserted into plasmid pETDuet-1. The recombinant plasmid was named pETDuet-1pzntR-ribB-oprF, and the recombinant plasmid was transferred to E. coli BL21 for expression.
A two-compartment MFC-operated reactor was set up with a working volume of 240 mL in each chamber, and the electrodes were pretreated before use. Carbon felt with an area of 16cm2 is used as an anode and cathode. These electrodes are connected via titanium wires to a 1000-ω external resistor.
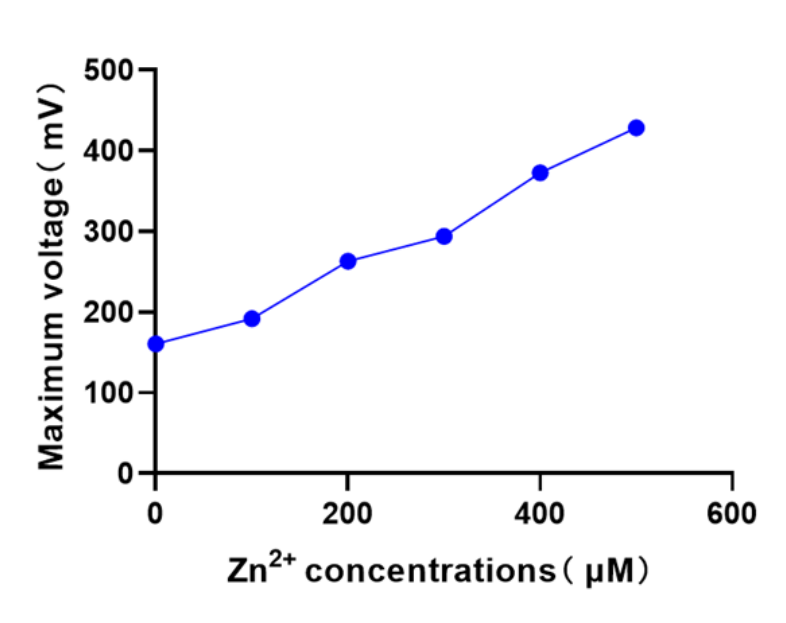
In the MFC operating system, the anodic medium was supplemented with different concentrations (0-500μM) of Zn2+ in the M9 liquid medium for use by the Zn2þ response regulator. The cathode solution was potassium ferricyanide (100 mM ferricyanide in 50 mM phosphate buffer, pH 7.0), and the voltage was recorded at 10-min intervals in an MFC biosensor using a data acquisition device.
There is a significant linear relationship between zinc ion concentration and the maximum voltage of the constructed MFC biosensor.
The expression of oprF in the engineered strain BL21 increased cell membrane permeability, and the highest voltage was approximately 4.5-fold higher than that of another engineered strain (pETDuet-1pzntR-ribB).
The two engineered bacteria were compared at the concentration of 500μM zinc ions The maximum voltage t-test of the engineered bacteria at the concentration of 500μM zinc ions showed P < 0.001, indicating that the oprF gene significantly changed the permeability of the cell membrane. So it turns out that the amplification system works.
| None |


