Part:BBa_K1159000
Erythromycin Esterase Type II (EreB) in RFC[25]
Erythromycin esterase type II from Escherichia coli that degrades macrolid antibiotics. Part is RFC[25] compatible and is flanked by RFC[25] pre- and suffix.
Usage and Biology
Protein Data Table for the erythromycin esterase (EreB) BBa_K1159000
| Protein data table for BioBrick BBa_BBa_K1159000 automatically created by the BioBrick-AutoAnnotator version 1.0 | ||||||||||||||||||||||||||||||||||||||||||||||
|---|---|---|---|---|---|---|---|---|---|---|---|---|---|---|---|---|---|---|---|---|---|---|---|---|---|---|---|---|---|---|---|---|---|---|---|---|---|---|---|---|---|---|---|---|---|---|
| Nucleotide sequence in RFC 25, so ATGGCCGGC and ACCGGT were added (in italics) to the 5' and 3' ends: (underlined part encodes the protein) ATGGCCGGCAGGTTCGAA ... GTTTATGAAACCGGT ORF from nucleotide position -8 to 1260 (excluding stop-codon) | ||||||||||||||||||||||||||||||||||||||||||||||
Amino acid sequence: (RFC 25 scars in shown in bold, other sequence features underlined; both given below)
| ||||||||||||||||||||||||||||||||||||||||||||||
Sequence features: (with their position in the amino acid sequence, see the list of supported features)
| ||||||||||||||||||||||||||||||||||||||||||||||
Amino acid composition:
| ||||||||||||||||||||||||||||||||||||||||||||||
Amino acid counting
| Biochemical parameters
| |||||||||||||||||||||||||||||||||||||||||||||
| Plot for hydrophobicity, charge, predicted secondary structure, solvent accessability, transmembrane helices and disulfid bridges | ||||||||||||||||||||||||||||||||||||||||||||||
Codon usage
| ||||||||||||||||||||||||||||||||||||||||||||||
Alignments (obtained from PredictProtein.org)
| ||||||||||||||||||||||||||||||||||||||||||||||
| Predictions (obtained from PredictProtein.org) | ||||||||||||||||||||||||||||||||||||||||||||||
Subcellular Localization (reliability in brackets)
| Gene Ontology (reliability in brackets)
| |||||||||||||||||||||||||||||||||||||||||||||
Predicted features:
| ||||||||||||||||||||||||||||||||||||||||||||||
| The BioBrick-AutoAnnotator was created by TU-Munich 2013 iGEM team. For more information please see the documentation. If you have any questions, comments or suggestions, please leave us a comment. | ||||||||||||||||||||||||||||||||||||||||||||||
Production and purification of recombinant EreB
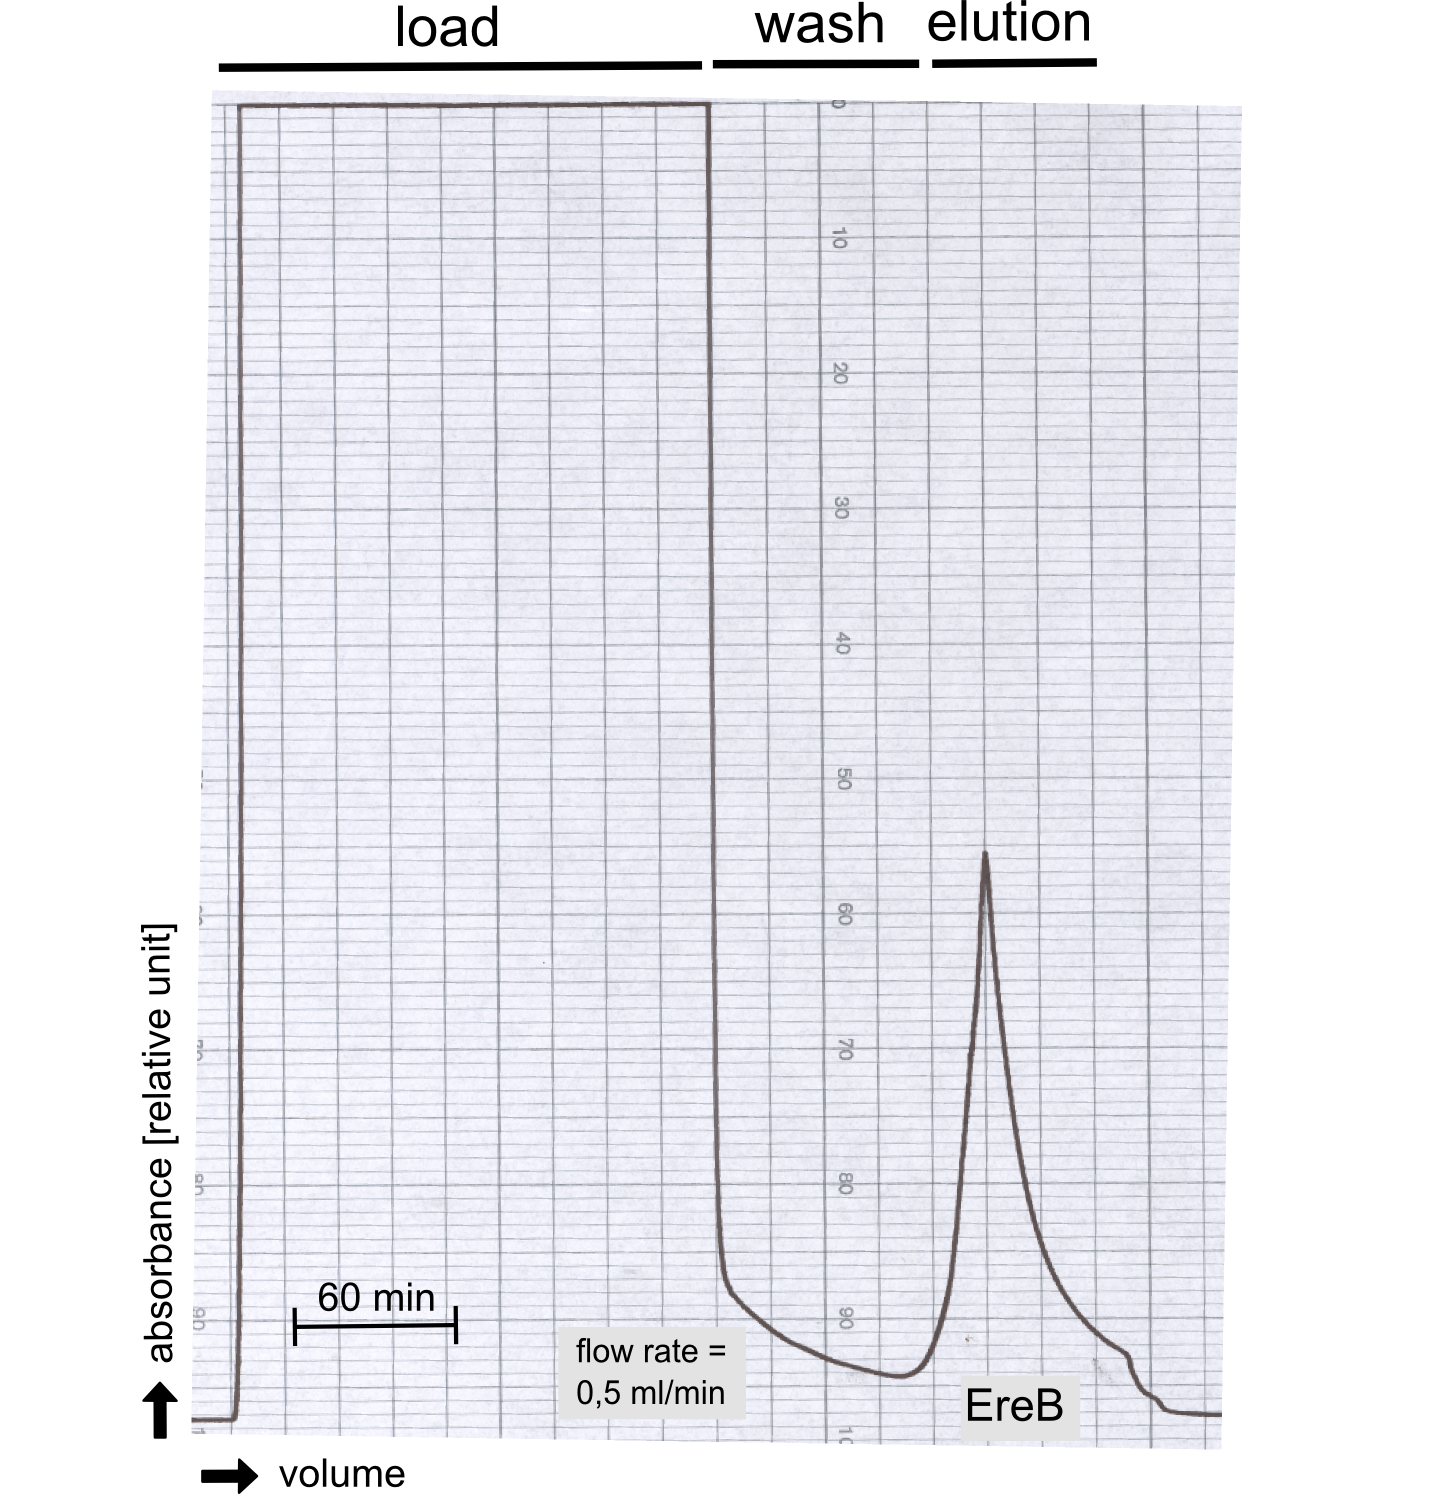
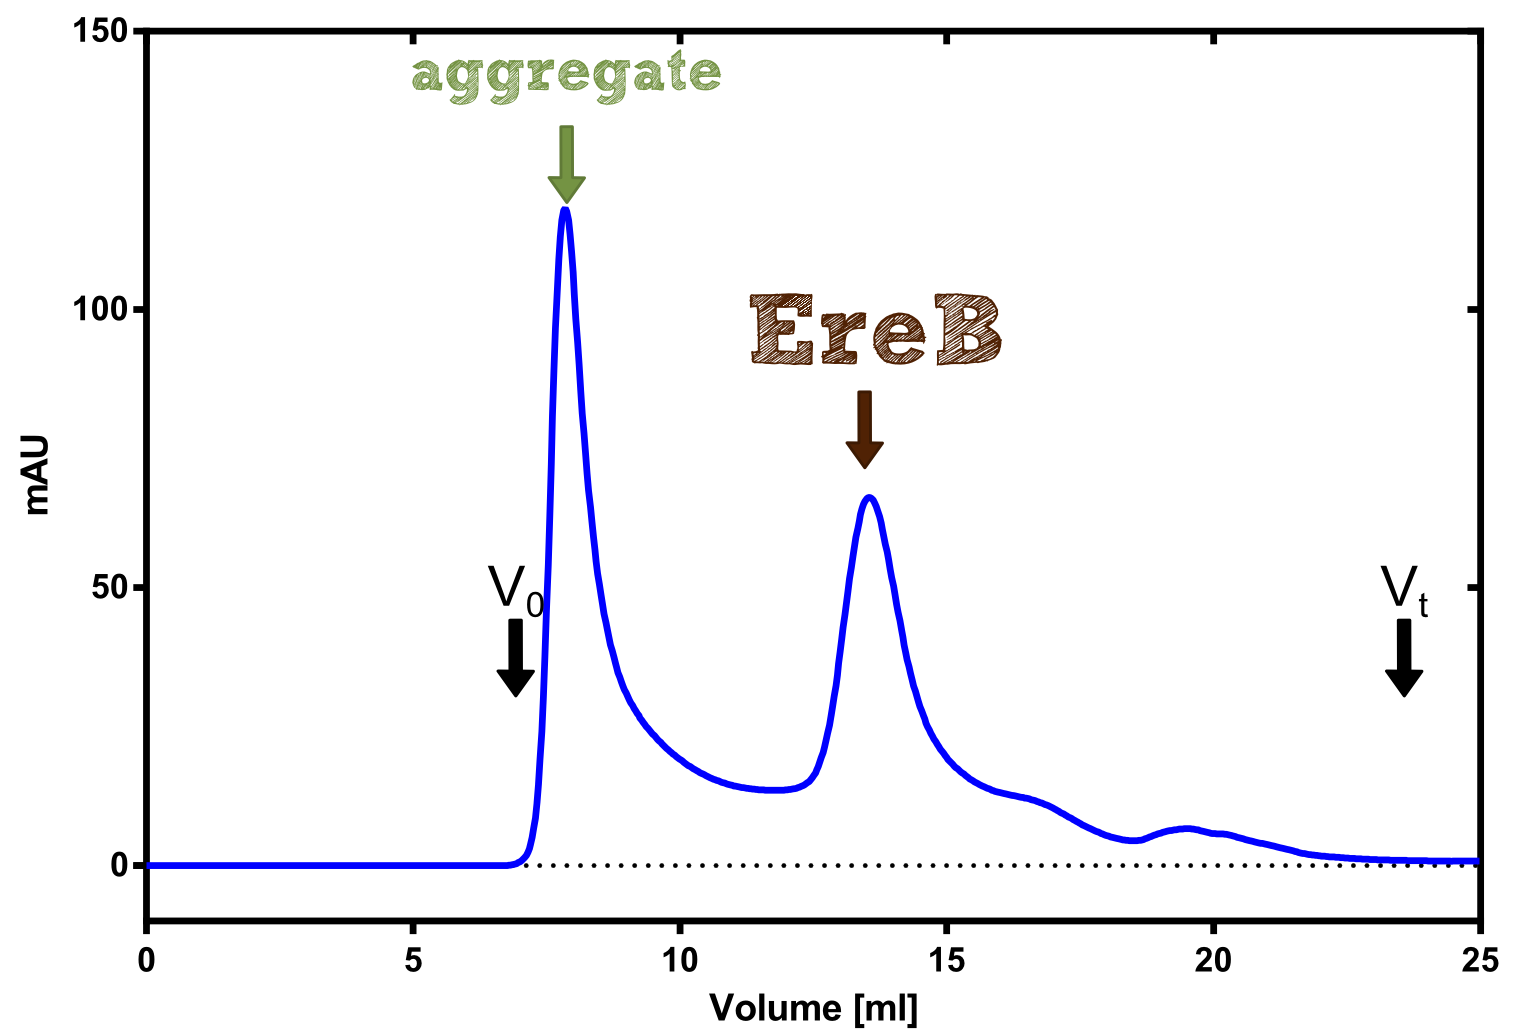
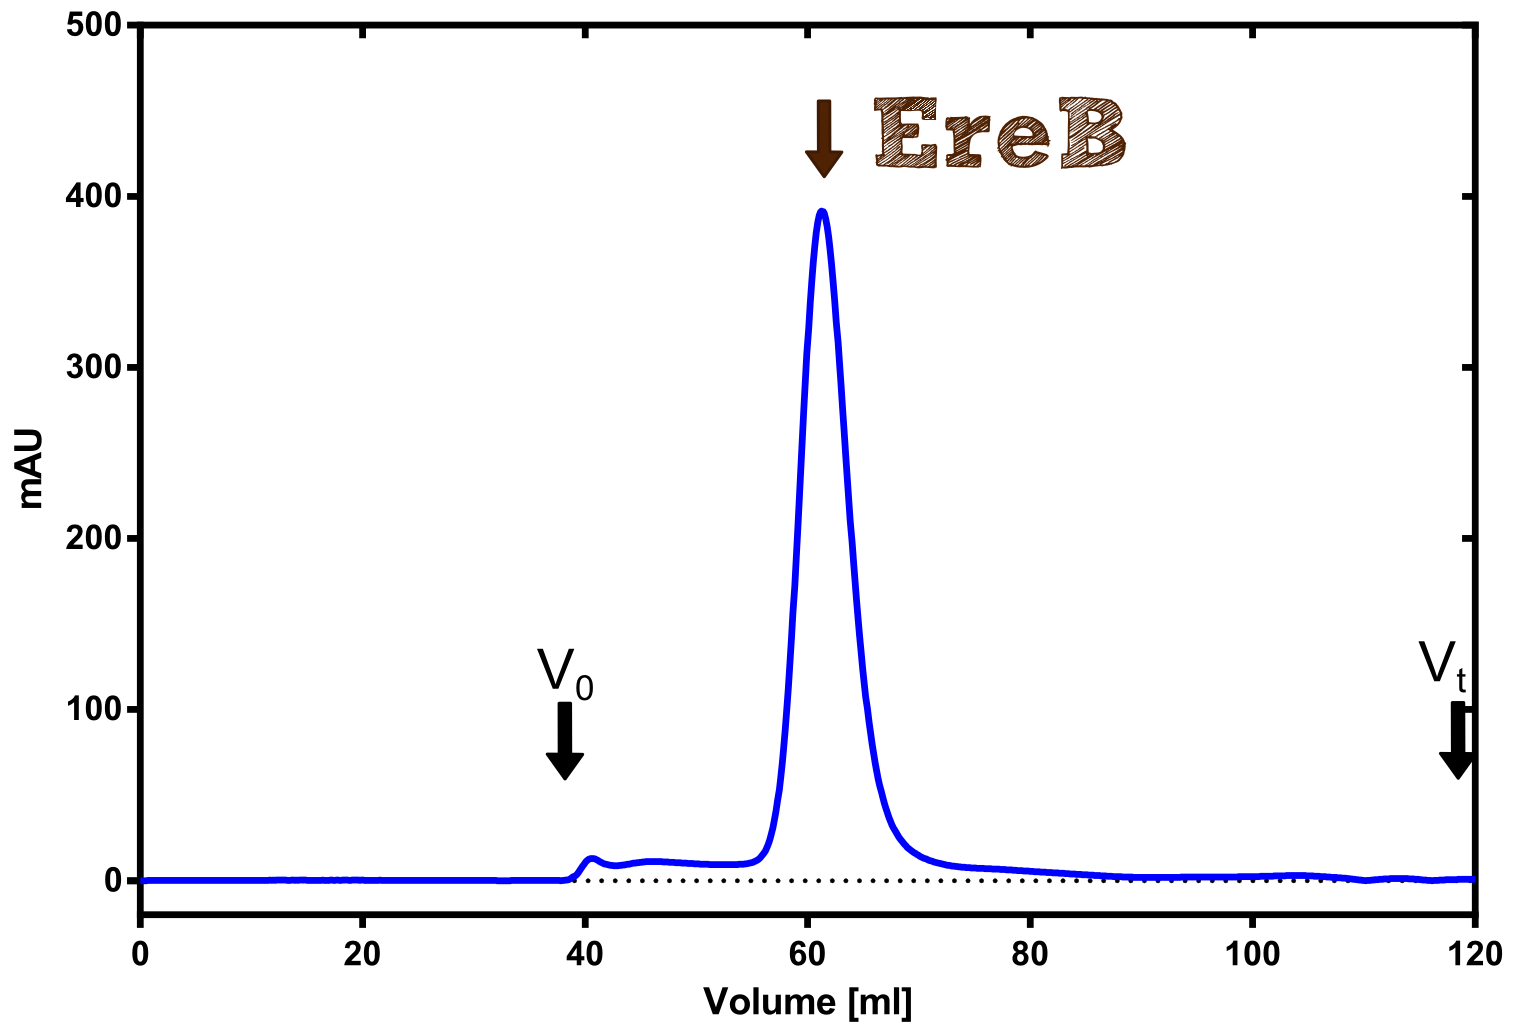
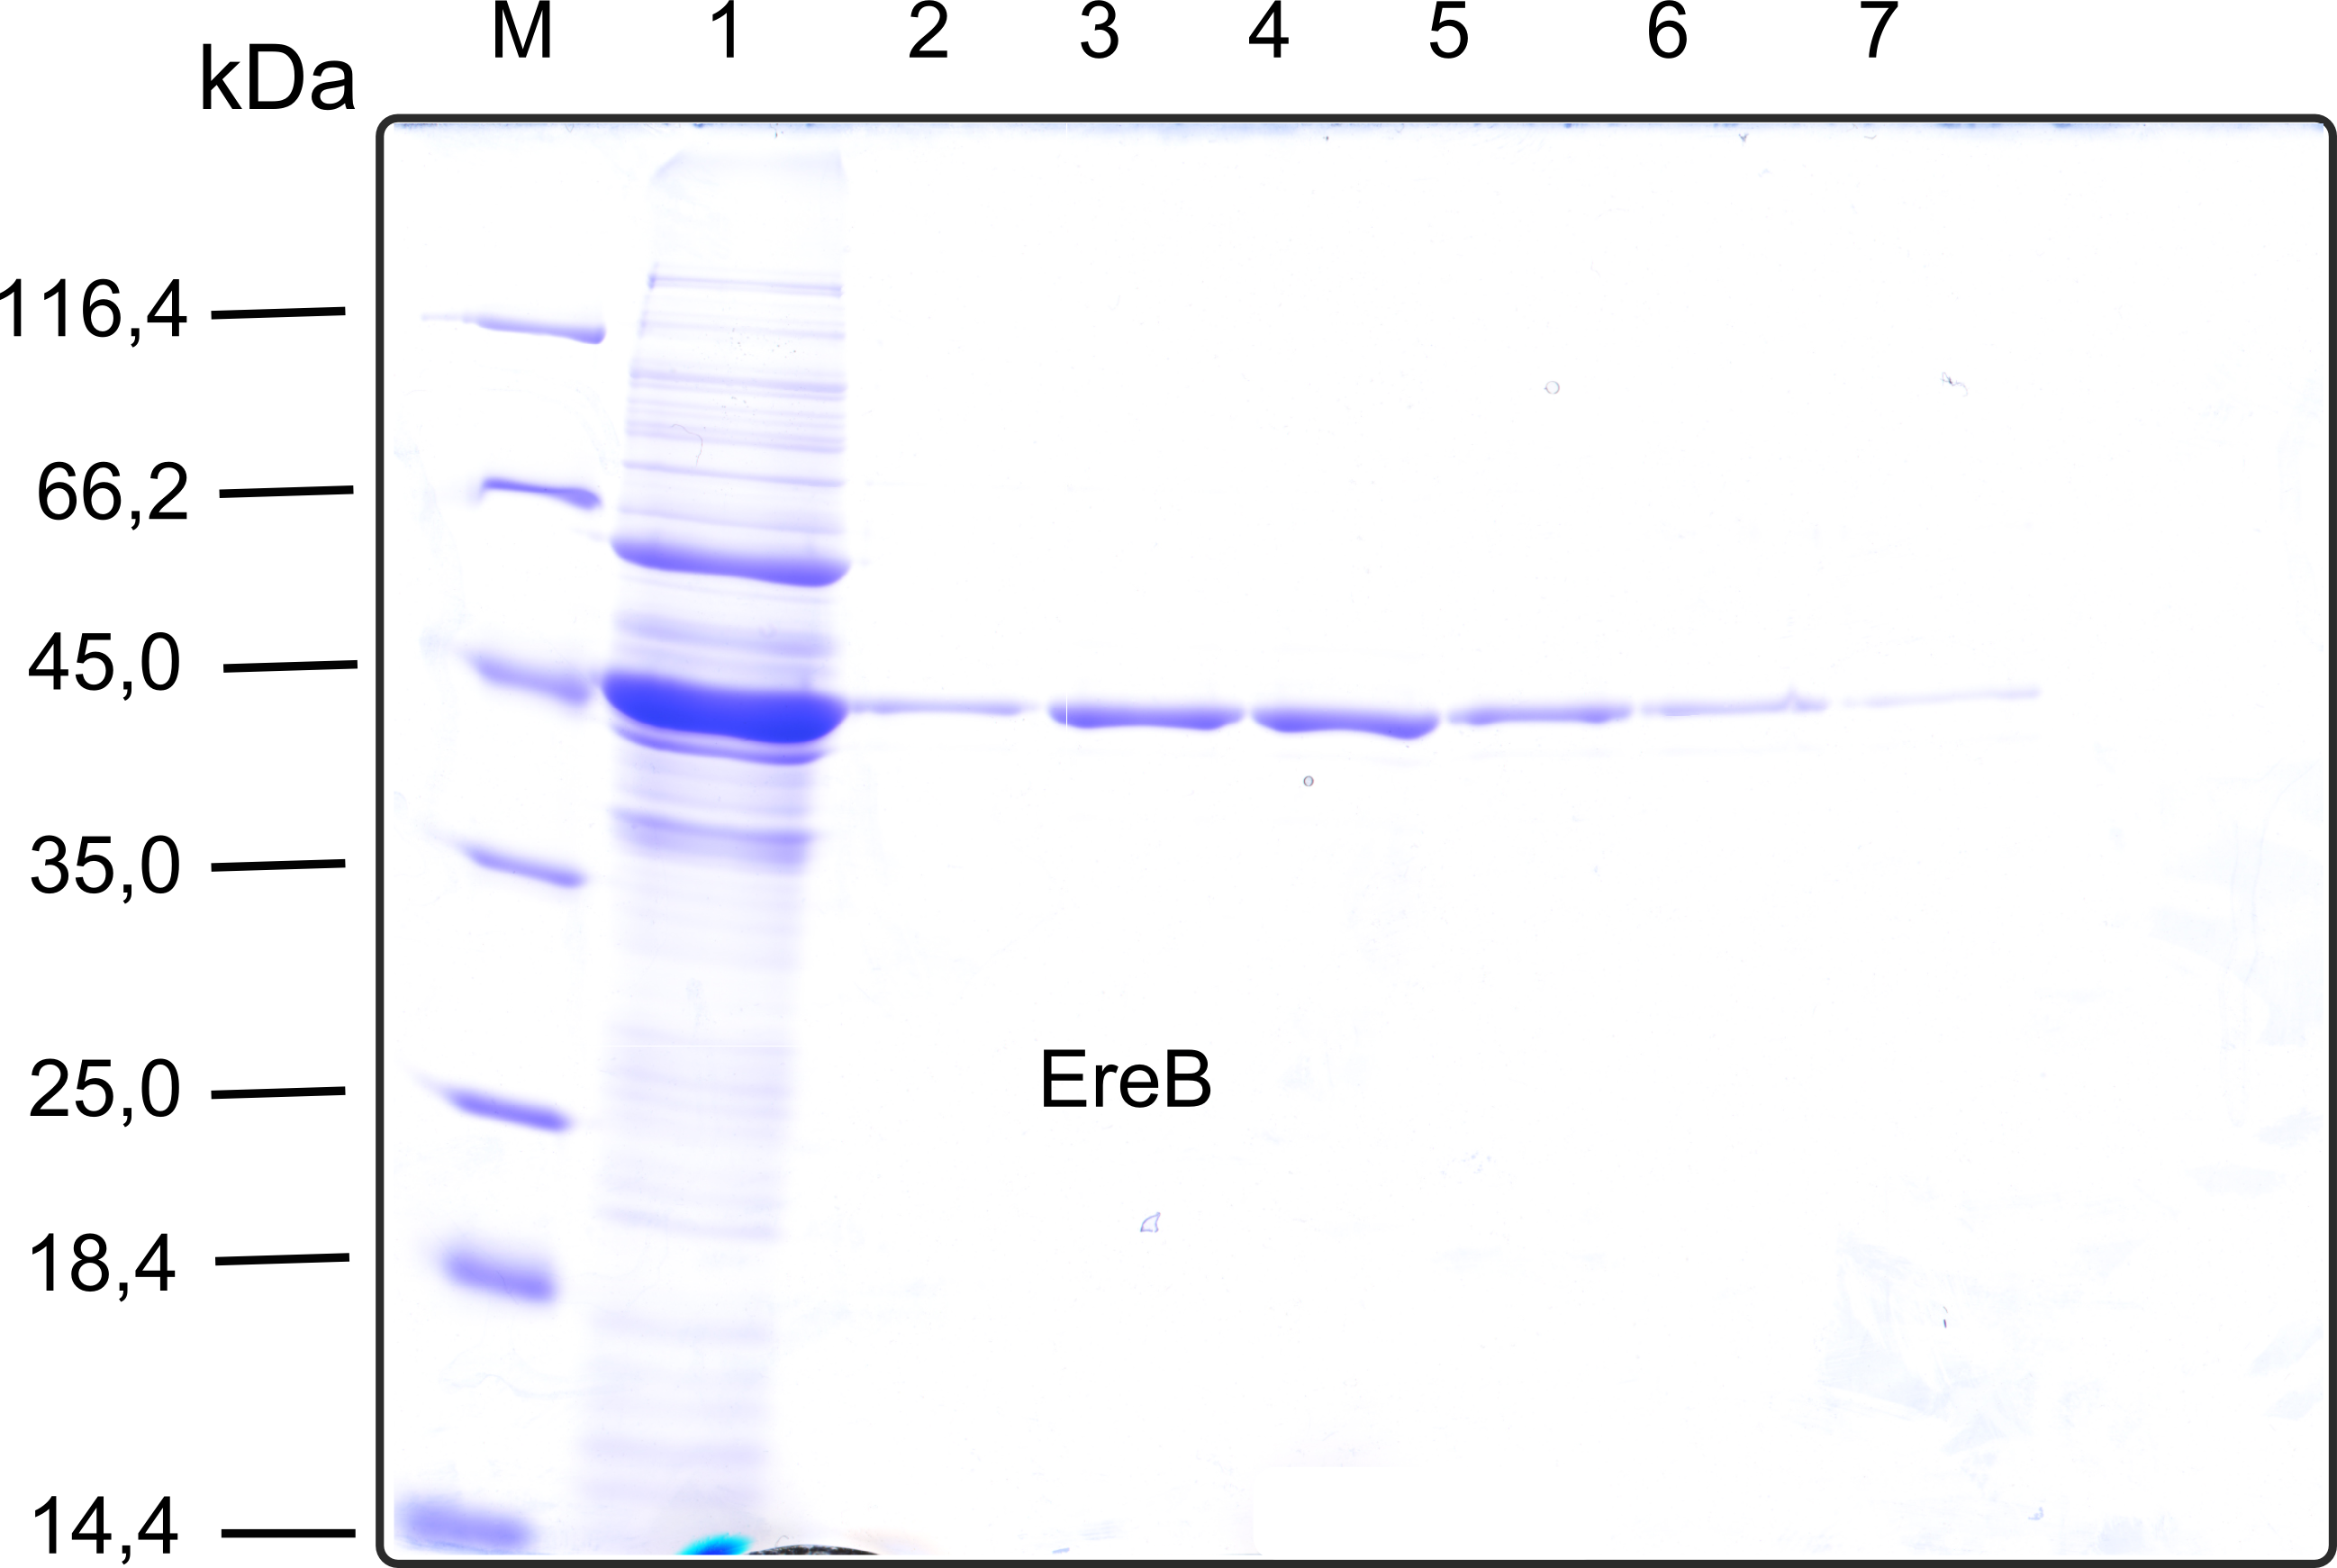
The recombinant production and purification was carried out twice, in a first attempt 2 L of LB-media were used for an analytical purpose whereas in the second attempt we produced enough purified enzyme for all subsequent experiments. This preparation was carried out in 6 x 2L of LB media. Protein production was in both cases induced at OD = 0.8 by adjusting the cell culture to 5 mM of arabinose and was carried out for 4 h for the first and 5 h for the second preparation. Cell disruption was performed by ultrasonic sound in both cases. The cell lysate was then dialyzed against 5 L of SA-buffer and subsequently applied to streptavidin affinity columns. After the application of the protein, the column was washed with SA-buffer until a base line was reached. Afterwards the protein was eluted using 5 mM biotin. During the first preparation 2-mercapto-ethanol was added after the chromatographic steps. In order to avoid oxidation of cysteine residues to disulphid-bridges, which is not desired for the cytosolic EreB protein, the preparative purification was carried out with buffers containing 5 mM of 2-mercapto-ethanol in all buffers. When comparing the size exclusion chromatograms, obtained from the analytical and the preparative purification, it can be stated that there is still a considerable aggregation peak near the void volume (Fig. B) of the column in the first attempt, which was nearly not the case for the preparative preparation (Fig. C). Therefore we would give the advise to use strictly reducing conditions while working with recombinant EreB. The finally resulting yields of the preparative purification have been determined by absorption measurement of the aromatic amino acids at 280. The total yield was determined to 25 mg of pure protein which is 2.1 mg/L of LB culture.
Kirby-Bauer Assay: Measuring remaining erythromycin on a pertri dish
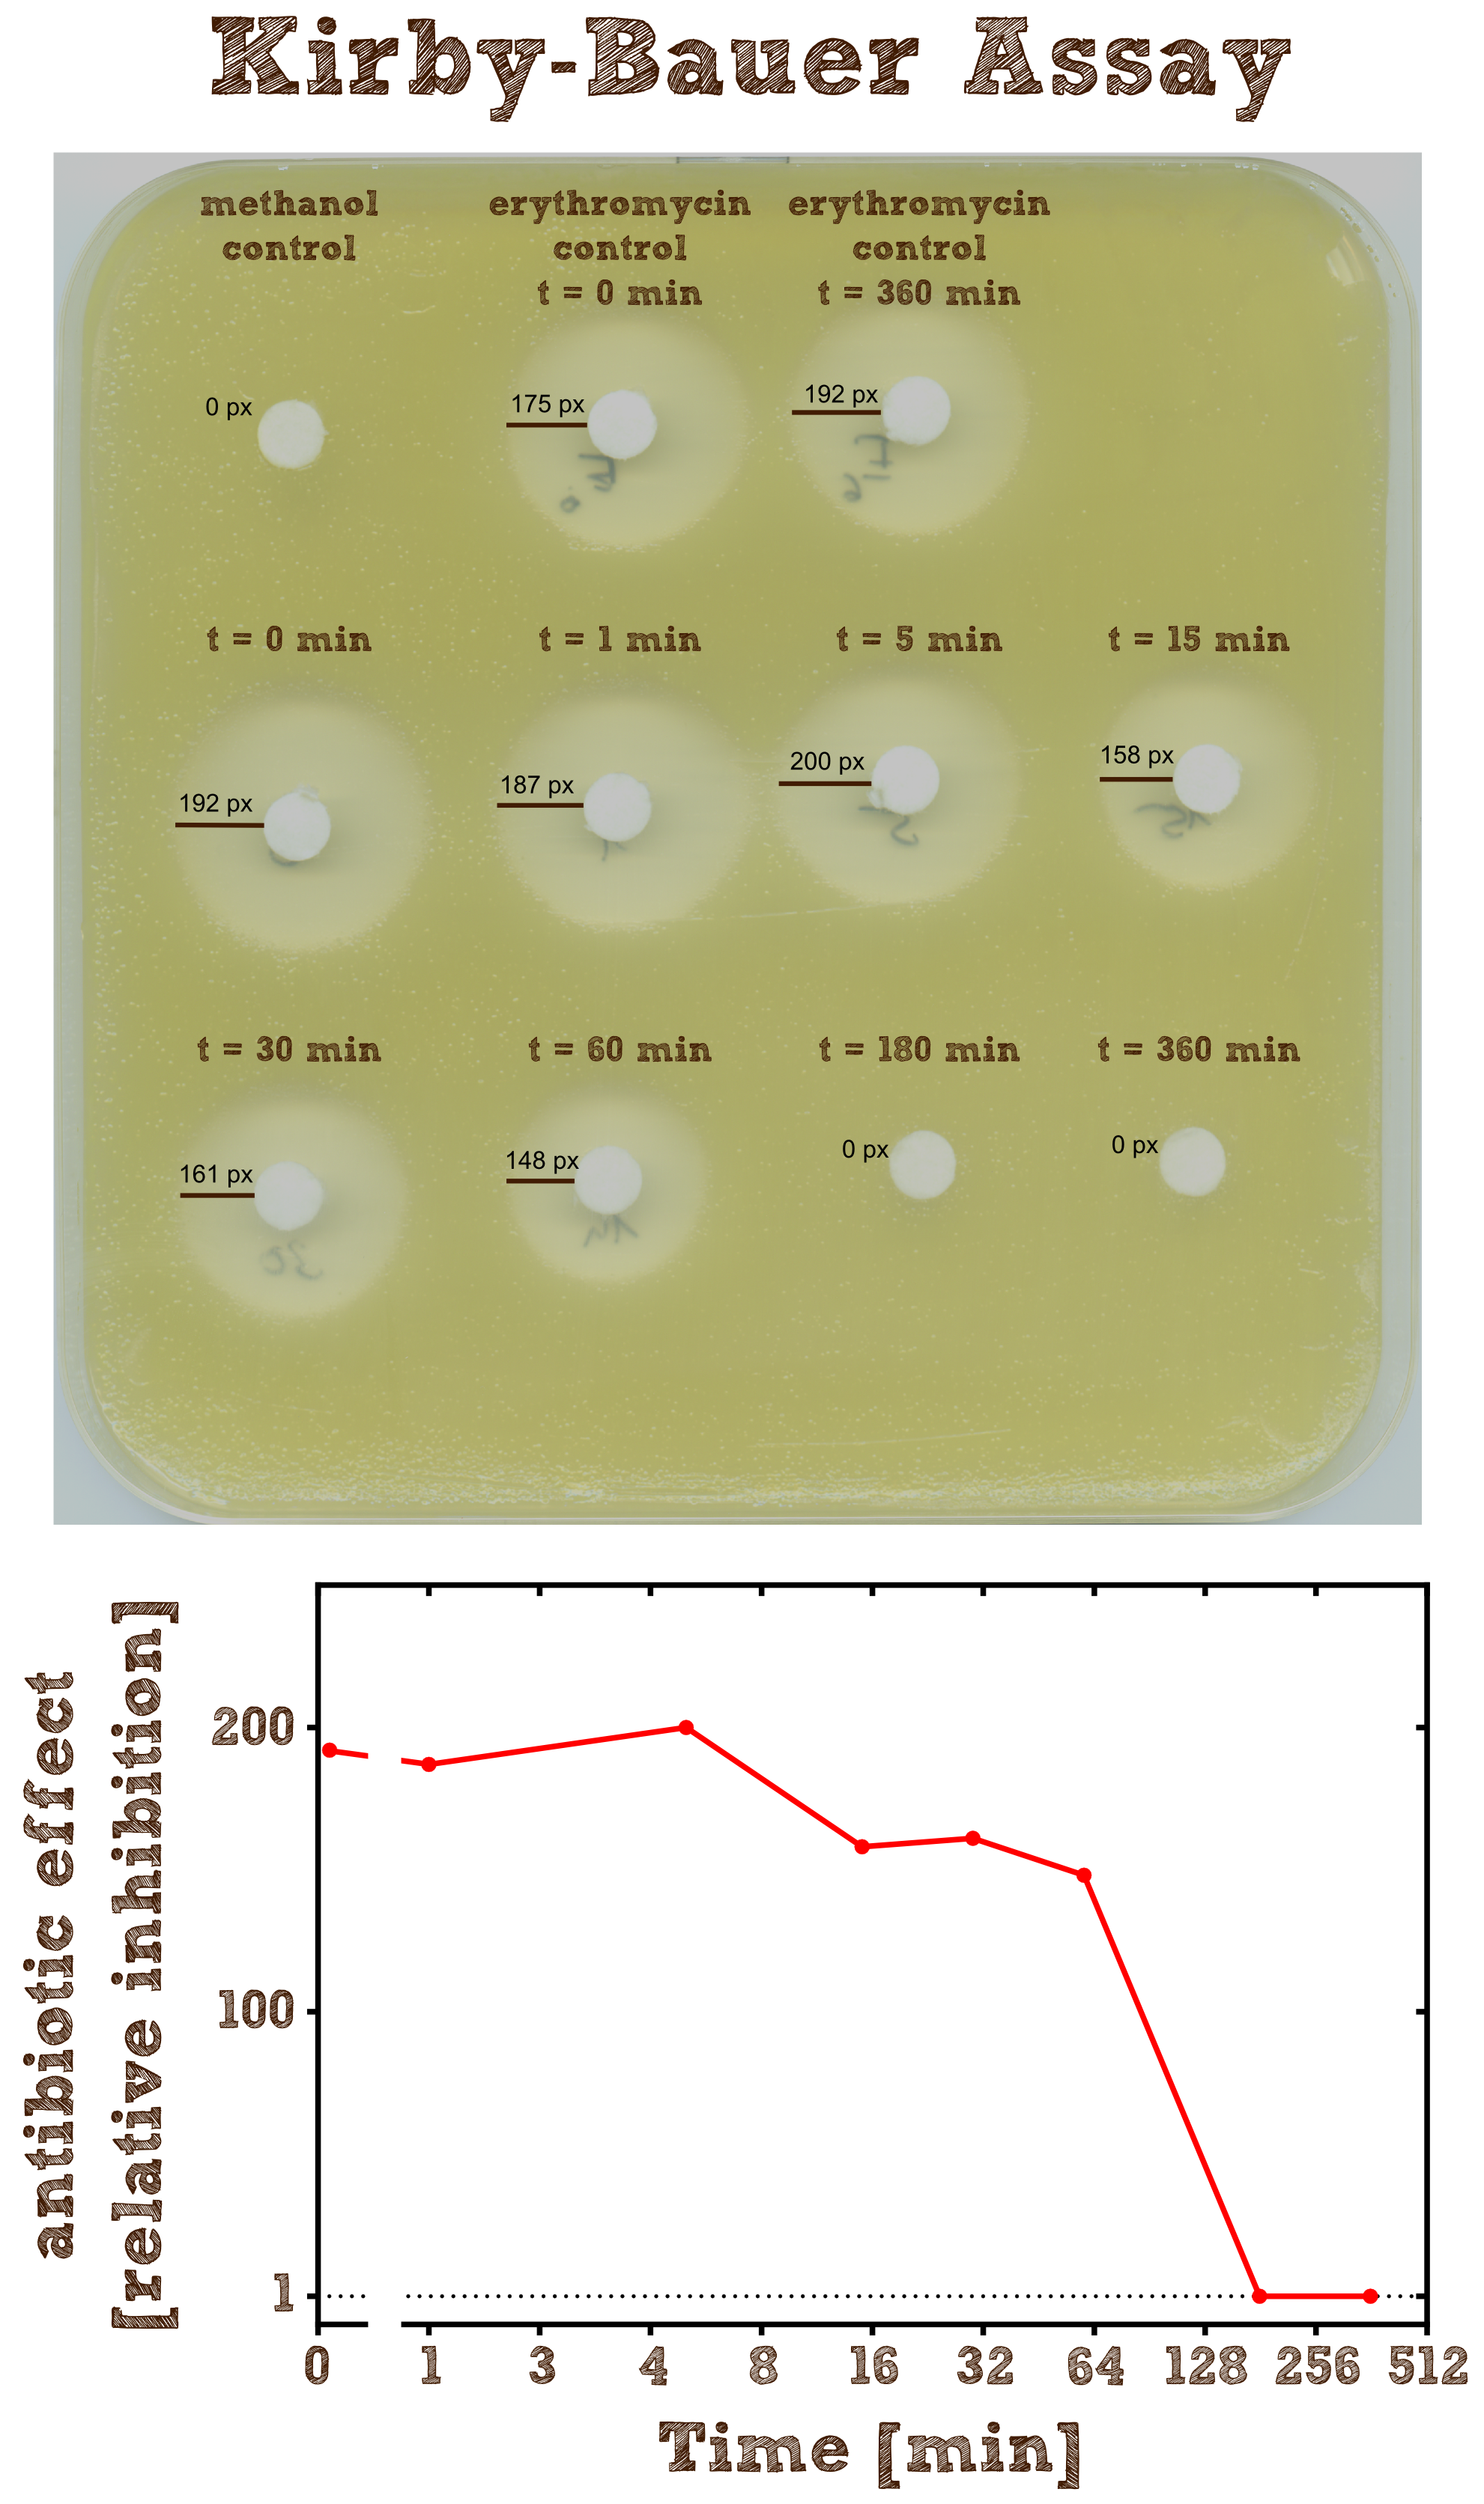
The Kirby-Bauer assay is an agar diffusion test, with which it is very easy to examine the decomposition activity of the enzyme. We also analyzed the decomposition activity of the recombinant EreB by [http://2013.igem.org/Team:TU-Munich/Results/GM-Moss#Characterization_of_Erythromycine_B_esterase_in_the_cytoplasm_of_recombinant_moss LC-MS]. The recombinant protein is incubated with the antibiotic and the reaction is stopped with methanol. To be sure that the enzyme is inhibited and the reaction does not go on, we additionally heated the reaction mixture (see table 2) after stopping for two minutes at 50°C and then shock froze the mixture in liquid nitrogen. The effect of methanol, heating and shock freezing on the bacterial strain and the substrate were checked before and have no influence.
Then bacteria from a quit dense liquid culture are plated on a LB agar plate without antibiotics under sterile conditions and spread with sterile cotton tip applicators. We used the bacterial strain Micrococcus luteus which was generously donated from the [http://www.micbio.wzw.tum.de/cms/docs/scherer-anzeigen.php chair of microbiology by Prof. Scherer`s group] and is mentioned to be specifically sensitive to Erithromycin http://pubs.acs.org/doi/abs/10.1021/bi201790u?mi=0&af=R&pr... Wright et al., 2012. Now several 6 mm filter paper discs are placed on the bacterial lawn in adequate intervals and 8 µl of the spinned down reaction mixture is added onto one disc. The mixture diffuses from the filter paper into the agar. The concentration of the compound will be highest next to the disk, and will decrease with increasing distance. If the compound is effective against bacteria at a certain concentration, no colonies will grow where the concentration in the agar is greater than or equal to the effective concentration. This is called the zone of inhibition.
| substance | amount | stock solution |
|---|---|---|
| EreB recombinant protein 40 nM | 0.18 µl | 11 µM EreB in PBS with 10 mM ß-mercaptoethanol, 2% glycerol (v/v) and 300 mM NaCl |
| Erythromycin 0.36 mM | 3 µl | Erythromycin in ethanol, 6 mM |
| Tris-HCl buffer pH 7.5 100 mM | 10 µl | Tris-HCl buffer pH 7.5, 500 mM |
| NaCl 0.08 M | 4 µl | NaCl in water, 1 M |
| ddH20 | 32.82 µl | ddH20 |
| TOTAL: | 50 µl |
As negative controls there is one mixture containing no substrate or enzyme and two mixtures without the enzyme but with antibiotic, which were incubated for 0 minutes and 6 hours.
As expected the assay shows a gradually decreasing zone of inhibtion with increasing reaction time. In the first half hour the zone is more or less constant although the enzyme is constantly degrading the antibiotic. This can be explained by the fact that the mixture only diffuses a certain range into the agar and in the first few time steps of the reaction the concentration of the antibiotic within this range is above the [http://en.wikipedia.org/wiki/Minimum_inhibitory_concentration minimum inhibitory concentration (MIC)], so the bacteria is inhibited independently of the exact concentration. After 3 hours all Erythromycin was degraded so there is no zone of inhibition anymore. Also we can see that the antibiotic does not degrade by itself significantly over 6 hours since the zones of inhibition in both negative controls are pretty much the same.
Characterisation of the enzyme
To characterize the enzyme we performed a spectrophotometric assay using the model ester p-nitrophenyl-butyrate (p-NPB) as a substrate for EreB. The chromogenic product p-Nitrophenyl shows characteristic absorbance at 405 nm. The reaction takes place even faster than hydrolysis of erythromycin since p-NPB is already highly activated and therefore readily hydrolyzed. This is also the reason why it degrades quite rapidly by itself so reactions have to be measured soon after being set up and taking a negative control is especially important.
Kinetics
To determine the kinetic parameters of EreB we prepared a 100 µl serial dilution of the substrate, starting with 1.2 M p-NPB (in 0.4% Triton, 50 mM buffer Tris-HCl pH 7.5, 0.2 M NaCl) to which 100 µl of the enzyme (11 µM) were added. The experiment was performed in quadruplets and the mean value was then plotted (see figure 5) against substrate concentrations.
Result: The higher the substrate concentration the faster the substrate is hydrolyzed, which can be seen in an increasing gradient and is self-evident as the enzyme encounters the substrate more often and faster the higher its concentration is in the solution. This data was also used for an exact determination of the kinetic parameters in [http://2013.igem.org/Team:TU-Munich/Modeling/Enzyme#Erythromycinesterase_.28Substrate_Dependence.29 our modelling section]. At these reaction conditions (pH 7.5) almost no decomposition of p-NPB takes place which is confirmed in the following experiment.
PH optimum
We prepared a buffer series from pH 4.5 to pH 10 using Sodium acetate + acetic acid (pH 4, 4.5, 5), MES (pH 5.5, 6), HEPES (6.5, 7), Tris-HCl (7.5, 8, 8.5) and Ches (9, 9.5, 10), each 100 µl in a 96-well plate. To the buffer we added 50 µl Substrate p-NPB (2 mM in 0.8% Triton and 400 mM NaCl) and finally 100 µl of the enzyme (11 µM) to start the reaction. The reaction was followed with a spectrophotometer at 405 nm for 1 hour every 15 seconds with the reaction mixture being shaken before every read. The experiment was performed threefold and the mean value was then plotted (see figure 6) against the pH-value of the buffer.
Result: From pH 4.5 to 6.5 there was no enzyme activity because the enzyme degraded, which was clearly visible as a dreary solution. The small absorption can be traced back to the degraded enzyme, so the conclusion is that EreB is unstable in alcaline surroundings. This is also the reason why [http://2013.igem.org/Team:TU-Munich/Modeling/Enzyme#Erythromycinesterase_.28Substrate_Dependence.29only cytoplasmatic localized enzyme works in our transformed moss], because the Knop medium in which P. patens is grown has a pH of 5.8. Since natural aquatic environment is generally on the alcalic side the degradation of antibiotics with EreB can only be realized intracellular. P-NPB in contrast seems to be very stable at low pH as there is no absorption measured in the negative control. With increasing pH the substrate increasingly degrades by itself while the enzyme's activity is also increasing. These two factors lead to a rapidly growing conversion of p-NPB. In a nutshell EreB works optimally in an acidic environment.
Ionic strength optimum
A serial dilution of NaCl starting with 1.5 M was prepared (50 µl) and another 100 µl of p-NPB (2 mM in 0.8 % Triton) were added before the reaction was started with 50 µl of the enzyme (11 µM). The reaction was followed with a spectrophotometer at 405 nm for 1 hour every 20 seconds with the reaction mixture being shaken before every read. The experiment was performed threefold and the mean value was then plotted (see figure 7) against the varying salt concentrations.
Result: The lower the salt concentration the higher is the enzymatic activity while simultaneously the decomposition of p-NPB increases. However, the reaction does not reach saturation as in the reaction with different pH (see figure 6). This is intuitive since the double amount of substrate and half of the enzyme's amount were incubated.
Sequence and Features
- 10COMPATIBLE WITH RFC[10]
- 12COMPATIBLE WITH RFC[12]
- 21INCOMPATIBLE WITH RFC[21]Illegal BglII site found at 189
Illegal XhoI site found at 599
Illegal XhoI site found at 1189 - 23COMPATIBLE WITH RFC[23]
- 25COMPATIBLE WITH RFC[25]
- 1000INCOMPATIBLE WITH RFC[1000]Illegal SapI.rc site found at 316
//chassis/eukaryote/ppatens
| None |

