
Part:BBa_J64997
T7 consensus -10 and rest
Characterization in vivo
This part has been characterized for GFP expression in the pCDF plasmid by the 2015 LASATX iGEM team.
We placed the T7 promoter in front of the sfGFP gene (BBa_K1624004). The experimental construct was placed in a pCDFDuet-1 vector and transformed into BL21(DE3) cells. We used BL21(DE3) cells without the plasmid containing T7 as our negative control. Cells were grown overnight. A 1:100 dilution was made, and cultures were grown with 20% glucose to 0.6 OD. At 0.6 OD, cells were resuspended in IPTG and induced for 2 hours. After induction, cells were washed and resuspended in PBS buffer. Fluorescence was then measured at 600 nm for 25 flashes. Bars show average of triplicates. Error bars show standard deviation.

The sfGFP gene placed downstream of the T7 promoter was successfully expressed, with fluorescence from the experimental construct significantly higher than the control.
Characterization in Cell-Free Environment
The T7 promoter was characterized in self-made E.Coli lysate from strain BL21(DE). Cell-free T7-GFP-mut3b versus GFP-mut3b (BBa_E0040) synthesis was analyzed. Fluorescence was measured at 37°C for five hours on a plate reader. For details on how the lysate and the energy solution were made and which components went into the final reaction volume of 10uL, check out our [http://2017.igem.org/Team:EPFL/Protocols protocols]. Shown are two times three repeats and a negative control, a shaded error graph (control was subtracted) and a bar plot summarizing the result.
GFP-mut3b expression cannot be dinstinguished from the no DNA control. T7-GFP-mut3b expression however is high. Saturation occurs after about five hours. Adding the T7 promoter in front of the GFP-mut3b enables transcription by the T7 polymerase, a much more efficient polymerase than the E.Coli polymerase found natively in E.Coli cells.


Improvements
This part was used as a promoter in the following parts : BBa_K2203001, BBa_K2203002, BBa_K2203003, BBa_K2203004, BBa_K2203005, BBa_K2203006 ; BBa_K3100022 (by SCUT_China 2019, https://parts.igem.org/Part:BBa_K3100022).
Improvement of BBa_K3100022 by SCUT_China 2019
In order to achieve a larger scale and more accurate regulation range, we have improved T7 promoters(BBa_J64997) with different strength providing more options for the precise regulation.

Fig1. T7 promoters with different strength
Contribution
Group: iGEM22_Stony_Brook
Authors: Maulik Masaliya, Lori Saxena, Stephanie Laderwager
Contribution Summary
T7 promoter

Usage and biology
This T7 promoter is part of the Protein S expression circuit BBa_K4235030 which was generated by cloning our insert BBa_K4235011 into the vector BBa_K4235016 using LIC protocol.
T7 promoter regulatory gene circuit employs transcriptional control by a repressor protein. The lac operon circuit consists of an operator site in the promoter region, to which the lacI repressor protein can bind and establish transcriptional repression. For initiating transcription, an inducer must bind to the lac repressor protein (lacI) which prevents the repressor from binding to the operator. The T7 promoter is induced using IPTG, which mimics allolactose and binds the lac repressor protein, allowing for the T7 RNA polymerase to bind to the promoter and induce transcription of the downstream gene sequence.
Mathematical modeling
We used MATLAB simulations to model our genetic circuits. We used a system of ODEs derived for both constitutive and regulatory genetic circuits(IPTG inducible lac operon) for our E coli expression system. We were able to input our system of ODE’s into MATLAB to predict our steady state concentrations prior to starting wet lab in order to determine the process that would yield more favorable results. Those plots can be found below:
E coli constitutive gene circuit model:
(1.) Protein vs time:

(2.) mRNA vs time:

(3.) Effects of altering DNA concentration on protein production:

E coli Regulatory Gene Circuit Model:
Here, we modeled our T7 promoter regulatory gene circuit which employs transcriptional control by a repressor protein. The lac operon circuit consists of an operator site in the promoter region, to which the lacI repressor protein can bind and establish transcriptional repression. For initiating transcription, an inducer must bind to the lac repressor protein (lacI) which prevents the repressor from binding to the operator. The T7 promoter is induced using IPTG, which mimics allolactose and binds the lac repressor protein, allowing for the T7 RNA polymerase to bind to the promoter and induce transcription of the downstream gene sequence.
(1.) Protein as a function of mRNA and time:

(2.) mRNA vs time:

(3.) Protein vs time:

Contribution by TAS_Taipei 2020
Authors: Wilson Huang, Hannah Hsu
We improved the characterization of BBa_J64997. The part T7 consensus -10 and rest serves as a T7 promoter that allows the binding of T7 RNA Polymerase to initiate transcription (Arnaud-Barbe, 1998). We decided to further characterize this part to provide data on whether this promoter sequence serves a benefit to the expression of enzymes compared to other promoters, specifically enzymes such as ligases, which are not only indispensable in bioanalytical techniques but also in viral diagnostic kits such as ours.
In order to characterize this existing part, we flanked a pET3a T7 promoter with downstream BBa_K3352002, BBa_K3352000, and BBa_K3352003, which forms the composite part BBa_K3352008. Since the pET3a T7 promoter has the same sequence as the T7 consensus -10 and rest, the SplintR Ligase enzyme expressed through this construct serves as an indicator of protein expression levels for this T7 promoter sequence.
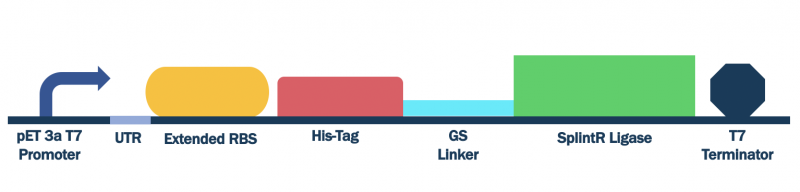
Figure #1. Design of pET Parts + SplintR Ligase Expressing Construct (BBa_K3352008).
Plasmids containing this construct was transformed into DH5⍺ E. coli cells for plasmid replication and subsequently miniprepped to obtain a high yield of plasmid. We then transformed these plasmids into BL21(DE3) E. coli cells. Growing an overnight culture and measuring the OD600 to dilute cells to standardized populations, we induced expression with 0.1M IPTG once the OD600 surpassed 0.5. Liquid cultures were grown for an additional 2 hours.
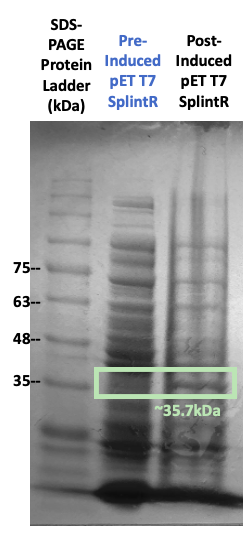
Figure #2. SDS-PAGE on protein expression before and after IPTG induction with the pET3a Parts SplintR Ligase expressing construct (BBa_K3352008).
While growing our cultures, we collected culture samples both before and after IPTG induction. We subsequently ran SDS-PAGE with these samples. Our results in Figure #2 indicates that bands of the enzyme were in fact present at the 35.2kDa band, the molecular weight of our SplintR Ligase enzyme (including the 6x histidine tag and GS linker attached). However, due to the presence of other notable proteins, we seeked further validation to ensure that our enzyme of interest was expressed.
After protein expression, we harvested and lysed the cells with xTractor Lysis Buffer and centrifuged them for sample preparation (XTractorTM Buffer & XTractor Buffer Kit User Manual, n.d.). This was followed by protein purification through Ni sepharose affinity chromatography, which could isolate our his-tagged SplintR Ligase enzymes.
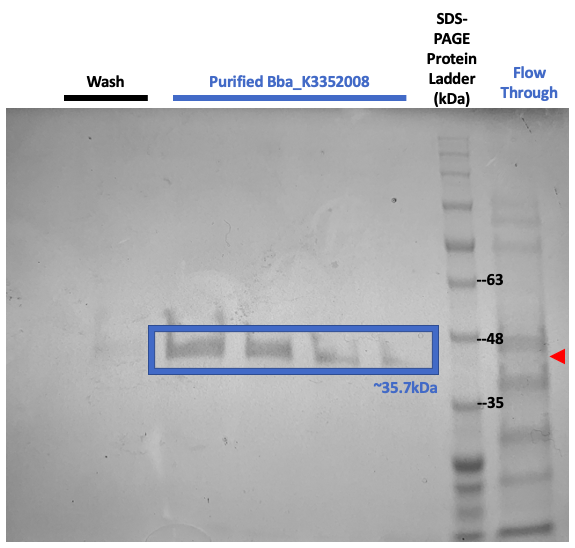
Figure #3. SDS-PAGE on purified proteins with the pET3a Parts SplintR Ligase expressing construct (BBa_K3352008).
We once again ran SDS-PAGE but with the purified samples. These results shown in Figure #3 once again suggests that our now purified enzyme of interest, SplintR Ligase, was produced through the expression of our construct design as seen through the band at 35.2kDa.
To compare the protein expression capability of this T7 promoter, we conducted the same test but replaced our T7 promoter from our previously used composite part BBa_K3352008 with a strong constitutive promoter BBa_J23100. This formed our construct BBa_K3352004, whose SplintR Ligase expression can be compared to that of BBa_K3352008.
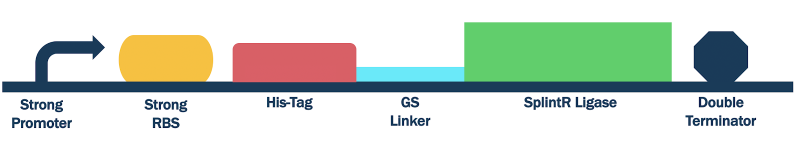
Figure #4. Design Strong Promoter SplintR Ligase Expressing Construct (BBa_K3352004).
Due to the usage of a promoter that isn’t T7, we used both DH5⍺ E. coli cells for both plasmid replication and protein expression (Arnaud-Barbe, 1998; Biolabs, n.d.; T7 Promoter System Vectors for Highest Expression Levels in Bacteria, n.d.). IPTG also served no purpose in inducing protein expression as T7 RNA Polymerase is not relied on (Biolabs, n.d.). Beside these alterations, the transformation, culturing, protein expression and purification were conducted in the same manner.
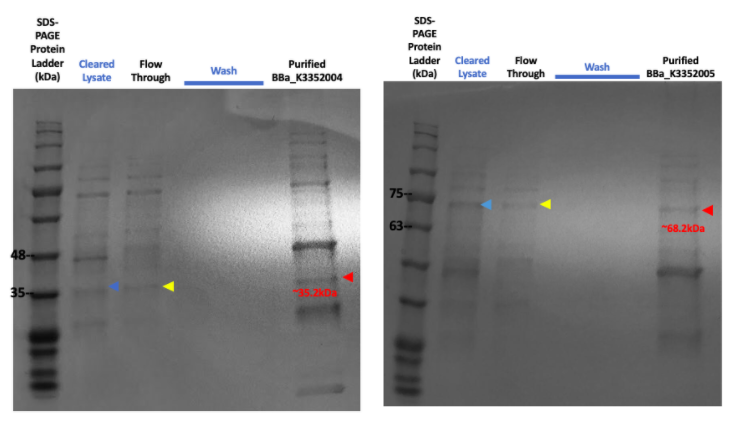
Figure #5. SDS-PAGE on purified proteins with the strong promoter SplintR Ligase expressing construct (Left, BBa_K3352004) and strong promoter phi29 DNA Polymerase expressing construct (Right, BBa_K3352005).
The SDS-PAGE results for the purified SplintR Ligase expressed through the strong promoter showed an array of enzymes and a faint band at the 35.22kDa lane. Upon further investigation, the presence of a similar band on the purified phi29 DNA Polymerase expressed through the strong promoter further shows ambiguity in our results, highly indicating that the protein band for the purified SplintR Ligase may not be SplintR Ligase at all.
This provides convincing evidence that the T7 promoter expresses certain proteins that cannot be properly expressed through other promoters. In this case, the protein tested would be SplintR Ligase, and could suggest that the expression of these crucial enzymes for viral testing should be conducted through a T7 construct.
Characterization:
1. Construction of the T7 Promoter Library
A T7 promoter library was constructed through site-saturation mutagenesis, and an efficient screening method based on GFP fluorescence detection was established.
The site-saturation mutagenesis DNA fragment pET30a(+)-PT7-RFP vector 1 was obtained using the plasmid pET30a(+)-PT7-RFP as the template and vector 1.F (the sequence containing the mutation in promoter)and vector 1.R as the primers. At the same time, vector 2.F and vector 2.R as the primers to obtain pET30a(+)-PT7-RFP vector 1 by PCR. And then construct pET30a(+)-PT7 mutagenesis -RFP with pET30a(+)-PT7-RFP vector 1 and vector 2 by Gibson Assembly.

Fig 2. Site-saturation mutagenesis was conducted to obtain the T7 mutants
vector 1.F |
CCCGCGAAATTAATACGACTCACTNNNNNGGAATTGTGAGCGGATAAC |
vector 1.R |
TACCGCACAGATGCGTAAG |
vector 2.F |
TTCTCCTTACGCATCTGT |
vector 2.R |
AGTGAGTCGTATTAATTTCG |
Table 1: Primers for site-saturation mutagenesis
2. T7 Mutant Screening and Determination of GFP Fluorescence
T7 mutants were preliminarily selected by fluorescence of colonies grown on LB agar plates with Lactose. These mutants were inoculated in 2ml LB medium and cultured at 37 °C with agitation at 250 rpm for 12 h. Then, 1:100 inoculate to 200μl LB medium (with 0.2mM IPTG) in 96 - well plates at 30°C with agitation at 250 rpm for 16 h. The excitation wavelength was set to 553 nm, and the emission wavelength was set to 583 nm. The optical density of bacteria at 600 nm was detected with a spectrophotometer.
Finally, we have screened 8 different strength T7 mutants. The following figure is fluorescence/OD600 of them.

Fig. 2: fluorescence/OD600 of T7 mutants
Reference:
[1] Nie, Z., Luo, H., Li, J. et al. Appl Biochem Biotechnol (2019). https://doi.org/10.1007/s12010-019-03113-y
Arnaud-Barbe, N. (1998). Transcription of RNA templates by T7 RNA polymerase. Nucleic Acids Research, 26(15), 3550–3554. https://doi.org/10.1093/nar/26.15.3550
Biolabs, N. E. (n.d.). E. coli Expression Strains | NEB. Retrieved October 22, 2020, from https://international.neb.com/products/competent-cells/e-coli-expression-strains/e-coli-expression-strains
T7 Promoter System Vectors for Highest Expression Levels in Bacteria. (n.d.). Sigma-Aldrich. Retrieved October 22, 2020, from https://www.sigmaaldrich.com/life-science/molecular-biology/cloning-and-expression/vector-systems/t7-promoter-system.html
XTractorTM Buffer & xTractor Buffer Kit User Manual. (n.d.). 10.
Sequence and Features
- 10COMPATIBLE WITH RFC[10]
- 12COMPATIBLE WITH RFC[12]
- 21COMPATIBLE WITH RFC[21]
- 23COMPATIBLE WITH RFC[23]
- 25COMPATIBLE WITH RFC[25]
- 1000COMPATIBLE WITH RFC[1000]
//direction/forward
//chassis/prokaryote/ecoli
//promoter
//regulation/constitutive
//chassis/bacteriophage/T7
| negative_regulators | |
| positive_regulators |