Part:BBa_J428351:Experience
This experience page is provided so that any user may enter their experience using this part.
Please enter
how you used this part and how it worked out.
Contents
- 1 Applications of BBa_J428351
- 2 Cambridge 2022 JUMP DV Characterisation
- 2.1 Experimental approach
- 2.1.1 Why Ammonium?
- 2.1.2 JUMP DV Considerations
- 2.1.3 Experimental Setup & Protocol
- 2.1.4 Results and Discussion
- 2.1.4.1 Prize Data - Protein Expression
- 2.1.4.2 Growth (OD600) Comparison
- 2.1.4.3 Growth (OD600)
- 2.1.4.4 0-1000mM Ammonium Sulphate
- 2.1.4.5 0-720mM Ammonium Sulphate
- 2.1.4.6 Growth AVOVAs
- 2.1.4.7 Growth Sigmoidal Curve fit & Stats
- 2.1.4.8 Fluorescence Intensity (protein expression)
- 2.1.4.9 0-720mM Ammonium Sulphate
- 2.1.4.10 Fluorescence Intensity AVOVAs
- 2.1.4.11 Fluorescence Intensity Sigmoidal Curve fit & Stats
- 2.2 User Reviews
- 2.1 Experimental approach
Applications of BBa_J428351
Cambridge 2022 JUMP DV Characterisation
Experimental approach
Why Ammonium?
-
Our iGEM project this year involves perturbations that cells can be subjected to. We are creating an 'antithetic integral controller' used to ensure that protein expression remains at a stable, desired level in the presence of conditions that could perturb it. During one of our Integrated Human Practice discussions with protein engineering company, Codexis, the Cambridge team discussed common perturbations that cells are likely to be subjected to in industry, where we were informed about ammonium build up in bioreactors in the case of insufficient mixing. We thought that we could then use this to access the effect of ammonium on different copy number plasmids and see whether they would respond differently to each other.
- Label 5 snap caps with plasmid/sample name: ‘just cells’, ‘lvl 1’, ‘pSC101’, ‘pBBR1’, ‘pUC’
- 2mL of EZRDM added to all 5
- In all but ‘just cells’, 2uL of Kan antibiotic is added
- Innoculate liquid culture
- Put snapcaps in shaking incubator for 24 hours at 30 degrees at 180rpm
- Make 720mM (filter sterilised) stock:
14.4mL of 1000mM [NH4]2SO4 & 5.6mL EZRDM (0mM) =20mL - Label 5 snapcaps with the 5 ammonium sulphate concentrations:
720mM: 4mL 720mM ([NH4]2SO4)
540mM: 3mL 720mM ([NH4]2SO4) & 1mL 0mM (EZRDM)
360mM: 2mL 720mM ([NH4]2SO4) & 2mL 0mM (EZRDM)
180mM: 1mL 720mM ([NH4]2SO4) & 3mL 0mM (EZRDM)
0mM: 750mM: 4mL 0mM (EZRDM) - Pipette up 10mL of [NH4]2SO4 using stripette and release 4ml,3ml,2ml,1ml into 720mM, 540mM, 360mM, 180mM. (leave 0mM empty)
- Then pipette up 10mL of EZRDM using stripette and release 4ml,3ml,2ml,1ml into 0mM, 180mM, 360mM, 540mM. (leave 720mM alone)
- They should all have final vol. of 4mL
- Get red pen to mark of wells I’ve added ammonium sulphate sol. to
- Get green pen to mark when cells have been added.
- ‘Just cells’ will be the only wells with things in without Kanamycin. So pipette 3x 200uL of each stock (into the wells with their replicates:
‘Just cells’ = 0,0,0,180,180,180,360,360,360,540,540,540,720,720,720.) - All the stock now need Kanamycin added so 600uL is gone from each, leaving 3400uL left.
- Add 3.4uL Kan to all the 5 stocks - our just EZRDM with diff ammonium sulphate conc.s wells will also have Kanamycin
- Pipette 200uL of the respective stocks into their wells
- Pipette 1uL of the respective cells into their wells.
- Put transparent film on top of well plate and put in plate reader.
- DV pSC101 (low copy no.) : Ammonium enhances fluorescence intensity up to 540mM. Despite the fluorescence rate decrease, the maximum fluorescence increases as we increase ammonium to 540mM with the cells reaching their limit at 720mM. Therefore, ammonium sulphate can be added to the growth media of cells containing pSC101 DV in order to enhance the expression of the protein of interest (in place of the sfGFP).
- DV pBBR1 (low-med copy no.) : Ammonium enhances fluorescence intensity up to 360mM. Despite the fluorescence rate decrease, the maximum fluorescence increases as we increase ammonium to 360mM with the cells having lower expression at 540mM, reaching their limit at 720mM. Therefore, ammonium sulphate can be added to the growth media of cells containing pBBR1 DV in order to enhance the expression of the protein of interest (in place of the sfGFP).
- DV pUC (high copy no.) : For high copy number plasmids, we can report that any ammonium concentration is detrimental to the cells expression. The greatest fluorescence was recorded with 0mM of ammonium sulphate, with decreasing expression as it was increased.
Growth (OD600) Comparison
However, we did not observe the same scenario with growth. In fact, we found that ANY concentration of ammonium was detrimental to the cells, regardless of the copy number plasmid it contained. This means that if you were to use pSC101 with 540mM of ammonium to maximise protein expression, you will have to compromise on the growth rate.
Growth (OD600)
0-1000mM Ammonium Sulphate
- At 0mM, pUC, the highest copy number plasmid containing cells has the longest stationary phase and has the greatest amount of growth. This is followed by pBBR1 at med/low copy number, with a similar high growth but dies off quickly. pSC101 is the lowest copy number plasmid and has even less growth. These are the controls to compare the ammonium effects to.
- {From the paper, we were told to expect ammonium “impairs growth” as a “result of general osmotic or ionic effects.”}
- At 250mM [NH4]2SO4, the higher the copy number of the plasmids, the more their growth is affected by the ammonium. pUC is effected the most with the lowest growth, then pBBR1 and pSC101. The metabolic burden of having a higher copy number may be making the E. coli more susceptible to ionic/osmotic effects.
- At 500mM [NH4]2SO4 similar results are observed, with pSC1010 and pBBR1 (lowest) copy number plasmids being effected similarly to each other. BUT more interestingly is that at this level of ammonium, all the cells that contain plasmids have extended growth times, only reaching their maximum growth at the end of the experiment. So, ammonium exposure of a high enough level can slow down the growth rate of the cells regardless their copy number but will ALSO effect the maximum growth reached by higher copy numbers too.
- At 750mM and 1000mM [NH4]2SO4, there is minimal growth - all cells are unable to grow significantly under this high molarity of ammonium.
0-720mM Ammonium Sulphate
- At 0mM, pUC, the highest copy number plasmid containing cells has the longest stationary phase and has the greatest amount of growth. This is followed by pBBR1 at med/low copy number, with a similar high growth but dies off quickly. pSC101 is the lowest copy number plasmid and has even less growth.
These are the controls to compare the ammonium effects to. - {From the paper, we were told to expect ammonium “impairs growth” as a “result of general osmotic or ionic effects.”}
- At 180mM [NH4]2SO4, all growths are effected but it looks like pBBR1 has a similar maximum growth as pUC, though pUC had a slower growth rate due to the metabolic burden of the high copy number.
- At 360mM [NH4]2SO4 pUC no longer has the greatest growth whilst the lower copy number plasmids are effected similarly.
- 540mM [NH4]2SO4 effects the higher copy number plasmids worse but overall slows down the growth rate of all cells with them all only just finishing exponential phase at the end of the experiment.
- At 720mM [NH4]2SO4, it appears that this level as well as 750mM, is too high for the cells. All cells are unable to grow significantly under this high molarity of ammonium.
Growth AVOVAs
- With our ANOVA plots, the peaks above our dotted line show significant difference between the growth of the plasmids at these times. They were coded with rolling averages in 5 min increments up to 50mins.
- For 0mM:
We see 3 main significance peaks at stages of growth: exponential, stationary and death
- For 180mM:
We see large significances at exponential phase and as the cells go into death phase
- For 360mM and 540mM:
Growth seems to be significantly different all throughout the cells growth phases
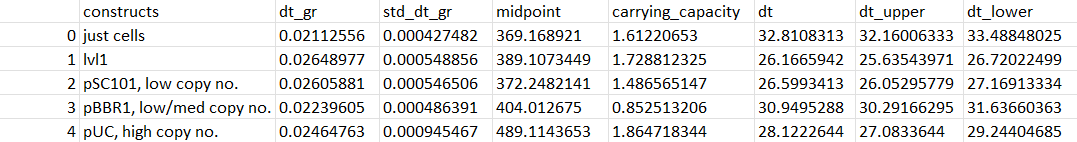
Growth Sigmoidal Curve fit & Stats
Using the sigmoidal function: L / (1 + np.exp(-k*(x-x0))) + b, we fit each of our growth curves to a sigmoidal curve to smoothen them out. As we have quite dramatic death phases, we gave the curve the max values of our data to stop fitting at
- For 0mM:
As copy number increases midpoint increases (it takes longer for the cells to reach half of their maximum growth - copy number burden delays growth).
BUT carrying capacity order goes pBBR1<pSC101<pUC and dt (doubling time) has the pattern pSC101<pUC<pBBR1.
- For 180mM:
The midpoint increases as copy number does here, and so does doubling time so the greater metabolic burden effects it growth in the presence of ammonium. pBBR1 has the greatest carrying capacity though so it is able to push through and still grow the most despite the ammonium despite how long it takes.
- For 360mM:
Carrying capacity decreases with copy number at this high ammonium concentration - the cells may have reached their ammonium limit in terms of maximum growth
- For 540mM:
Carrying capacity decreases with copy number here too with the greatest doubling time for the lowest copy number plasmid.
Fluorescence Intensity (protein expression)
0-720mM Ammonium Sulphate
Here, the plasmids in the distribution kit contain sfGFP which is easy for us to measure. However, our contribution also has a greater significance as this sfGFP can stand in for any coding sequence that can be cloned into these destination vectors. For certain levels of expression, synthetic biologists can use our data to determine which copy number would suit their application best, and how osmotic/ionic effects are portrayed through the expression.
- At 0mM, pUC, the highest copy number plasmid containing cells has a significantly greater expression of sfGFP. This is to be expected as more plasmids = more sfGFP = greater fluorescence intensity
- {From the paper, we were told to expect ammonium “impairs growth” as a “result of general osmotic or ionic effects.” so let’s investigate its effect on fluorescence}
- At 180mM [NH4]2SO4, the higher the copy number plasmid, pUC fluorescence has been lowered slightly, but with minimal effect on the lower copy plasmids. The metabolic burden of having a higher copy number may be making the E. coli more susceptible to the ionic/osmotic effects.
- At 360mM [NH4]2SO4 the pUC fluorescence is lowered much more but pSC101 and pBBR1 seem to have increased their fluorescence
- At 540mM, pUC fluorescence intensity increases at a slower rate, not even reaching its maximum during the experiment
- At 720mM [NH4]2SO4, no fluorescence is observed.
Fluorescence Intensity AVOVAs
- With our ANOVA plots, the peaks above our dotted line show significant difference between the growth of the plasmids at these times. They were coded with rolling averages in 5 min increments up to 50mins.
- For 0mM:
Large significance at all stages of growth
- For 180mM:
Large significance at all stages of growth
- For 360mM:
Large significance specifically entering stationary phase
- For 540mM:
Significance all throughout specifically entering stationary phase
Fluorescence Intensity Sigmoidal Curve fit & Stats
Using the sigmoidal function: L / (1 + np.exp(-k*(x-x0))) + b, we fit each of our growth curves to a sigmoidal curve to smoothen them out. As we have quite dramatic death phases, we gave the curve the max values of our data to stop fitting at.
- For 0mM:
As copy number increases, the midpoints increase (takes longer for the cells to reach half of their maximum fluorescence), their carrying capacity and doubling time also increases.
- For 180mM:
The pattern remains the same but for pBBR1, the doubling time is the lowest (doubled the fastest)
- For 360mM:
The pattern remains the same again but for pBBR1, the doubling time is the lowest (doubled the fastest) AND it has the lowest carrying capacity - so the cells grew that fastest but weren’t able to fluoresce much
- For 540mM:
As copy number increases: midpoint increases (it takes longer for the cells to reach half of their maximum growth - copy number burden delays growth). Carrying capacity increases (cells reach higher max. growth) dt (doubling time) increases (it takes longer for the cells to double - again, copy number burden)
User Reviews
UNIQd11260e38cb4d84a-partinfo-00000000-QINU
UNIQd11260e38cb4d84a-partinfo-00000001-QINU
JUMP DV Considerations
Out of the 3 JUMP DVs that we characterised in E. coli, we aim to focus on pSC101 (low copy no.) as its growth, compared to the other 2 DVs, was less sporadic and didn't go through such a dramatic death phase, instead remaining at the stationary phase, once it had finished growing, until the end of our experiment. Low copy number plasmids are also often used as a default as they exert less burden on cells so this allows us to made a larger contribution to the iGEM and synthetic biology community. pSC101 being a low-copy number plasmid, will therefore exert less burden on our cells - this is in particular important for the construction and functionality of the complex 'robust perfect adaptation' circuit.
Experimental Setup & Protocol
We used a 96- well plate in the Clariostar Plate reader, changing the ammonium sulphate concentration in the growth media and the copy number plasmid in DH5a E. coli:

Liquid Culture Preparation
Pippetting the well plate
Results and Discussion
Prize Data - Protein Expression

We ran our first experiment using ammonium sulphate concentrations of 0mM, 250mM, 500mM, 750mM and 1000mM after reading ‘Ammonium Toxicity in Bacteria’ by Müller et al., 2005, and finding this a reasonable range in order to gather data within and beyond the scope of their testing parameters. The paper claims that ‘in E. coli, addition of 750 mM and 1000 mM ammonium (375 mM and 500 mM (NH4)2SO4) impaired growth’ and with 0-1000mM ammonium sulphate, we aimed to record all stages of detriment to the point at which the bacteria are no longer able to cope.
After running this experiment we confirmed that at 750mM ammonium sulphate, the cells were unable to grow at all so we narrowed down our parameters for the 2nd test. Still using 5 concentrations, this allowed us to interpret more precise details about each plasmid's limits.