
 1 Registry Star
Part:BBa_J04450
RFP Coding Device
- 10COMPATIBLE WITH RFC[10]
- 12COMPATIBLE WITH RFC[12]
- 21COMPATIBLE WITH RFC[21]
- 23COMPATIBLE WITH RFC[23]
- 25INCOMPATIBLE WITH RFC[25]Illegal AgeI site found at 781
Illegal AgeI site found at 893 - 1000COMPATIBLE WITH RFC[1000]
The colonies are clearly red in color under natural light after about 18 hours. Smaller colonies are visibly red under UV. The RFP part does not contain a degradation tag and the RBS is strong.
- LacI sensitive
- CAP sensitive
This part is commonly used, but can fail if the system contains LacI or CAP protein.
(--Meagan 15:39, 23 July 2009 (UTC))
[http://2012.igem.org/Team:TU_Munich Team TU_Munich 2012] improved this part by making it compatible to RFC10 and RFC25 (see: BBa_K801100)
(--VolkerMorath 15:02, 21 October 2012 (UTC))
[http://2013.igem.org/Team:NRP-UEA-Norwich Team NRP-UEA 2013] improved this part by adding a NdeI restriction site before the RFP gene. (see: BBa_K1041000)
(--holusac 20:46, 14 August 2013 (UTC))
[http://2015.igem.org/Team:Warwick Team Warwick 2015] improved this part by analysing the effect of copy number on gene expression.
(--Lcarroll 20:48, 25 September 2015 (UTC))
[http://2016.igem.org/Team:Leiden Team Leiden 2016] contributed to the characterisation of this part by showing equal functionality in simulated microgravity (0g) as in the normal gravity of the Earth.
(--Valentijn 19:38, 19 October 2016 (UTC))
[http://2017.igem.org/Team:UChicago Team UChicago 2017] contributed to this part by improving/changing the documented sequence through mutagenesis to create blunt-end restriction sites for cloning not within the prefix/suffix region (created BBa_K2428000).
(--pzulueta97 21:14, 25 October 2017 (UTC) )
[http://2017.igem.org/Team:Grenoble-Alpes Team Grenoble-Alpes 2017] contributed to the characterisation of this part by testing the time of apparition of fluorescence, in presence of IPTG or not (because the promoter leaks), as well as they contributed to the improvement of this part by using its fluorescence as a detection signal to be able to detect Vibrio Cholerae.
(--NoreenLouis 20:47, 26 October 2017 (UTC) )
[http://2017.igem.org/Team:Kingsborough_NY Team Kingsborough NY 2017] contributed to the characterization of this part by showing decreased fluorescence when expressed either in a higher salt media - such as LB with 3% sodium chloride - or E. coli that lacks tmRNA, the principal component of the cell's ribosome rescue system. View the data on the experience page or [http://2017.igem.org/Team:Kingsborough_NY/RFP visit our Wiki]
(--djcamenares 17:56, 27 October 2017 (UTC) )
[http://2017.igem.org/Team:iTesla-SoundBio Team iTesla SoundBio 2017] contributed to the characterization of this part by analyzing the rate of false positives when using the coloring of transformed colonies as a red/white screen for determining experimental success.
(--gladish 01:26, 28 October 2017 (UTC) )
[http://2018.igem.org/Team:Grenoble-Alpes Team Grenoble-Alpes 2018] contributed to the characterisation of this part by testing the delay before apparition of fluorescence directly after transformation and the intensity of the leak, in three different E. Coli strains.
(--perrine 15:06, 9 October 2018 (UTC) )
[http://2018.igem.org/Team:H14Z1_Hangzhou Team H14Z1_Hangzhou 2018] contributed to the characterisation of this part by testing the fluorescence idensity in different condition(e.g.temperature,medium volume, IPTG concentration) ,in two different E. Coli strains.
(--ericxu 09:32, 17 October 2018 (UTC) )
[http://2018.igem.org/Team:SKLMT-China Team SKLMT-China 2018] improved this part by replacing the induced promoter lacI with the strong constitutive pf-5 promoter PampC.(see: BBa_K2569029)
(--DDY 16:47, 17 October 2018 (UTC) )
Team Grenoble-Alpes 2019 contributed to the characterisation of this part by testing the effect of cAMP on the promoter’s leakages and protein expression in Escherichia coli.
(--pinerol 19:50, 27 September 2019 (UTC) )
Team Lund 2019 contributed to the charazterization of this part by testing the effect of different media composition in different E. coli strains on RFP expression.
(-- ParselTMatts 18:40, 19 October 2019 (UTC) )
Team BUCT-China 2019 Contribute to the characterization of this part by introducing it in Trans10 to observe its growth and draw its growth curve.
(-- buct_china_ljh 12:18, 20 October 2019 (UTC) )
Team Aalto-Helsinki 2019 contributed to the charazterization of this part by testing the effects of different chloramphenicol concentrations on RFP expression levels.
(-- Toivanen 15:20, 21. October 2019 (UTC) )
Pictures
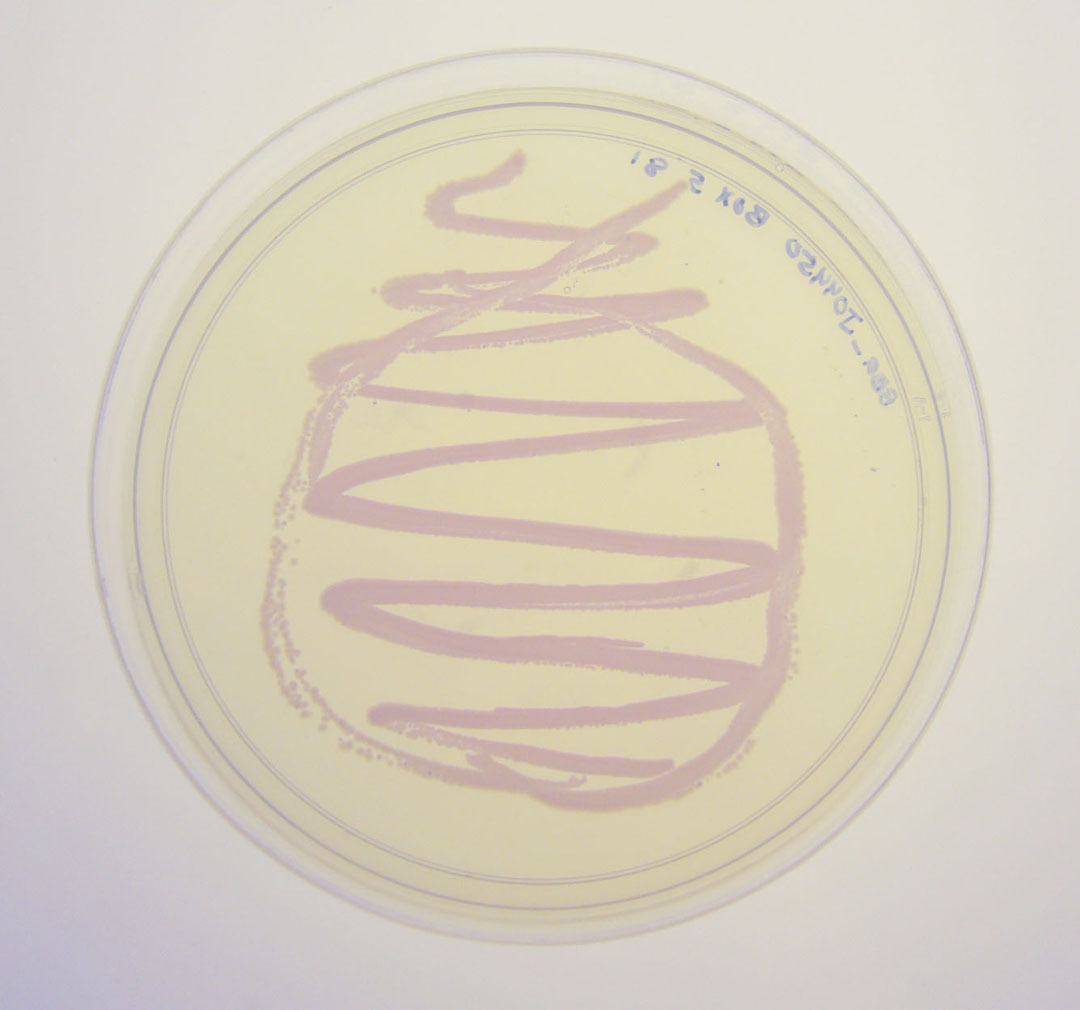
BBa_J04450 visualized under non-UV lightbox
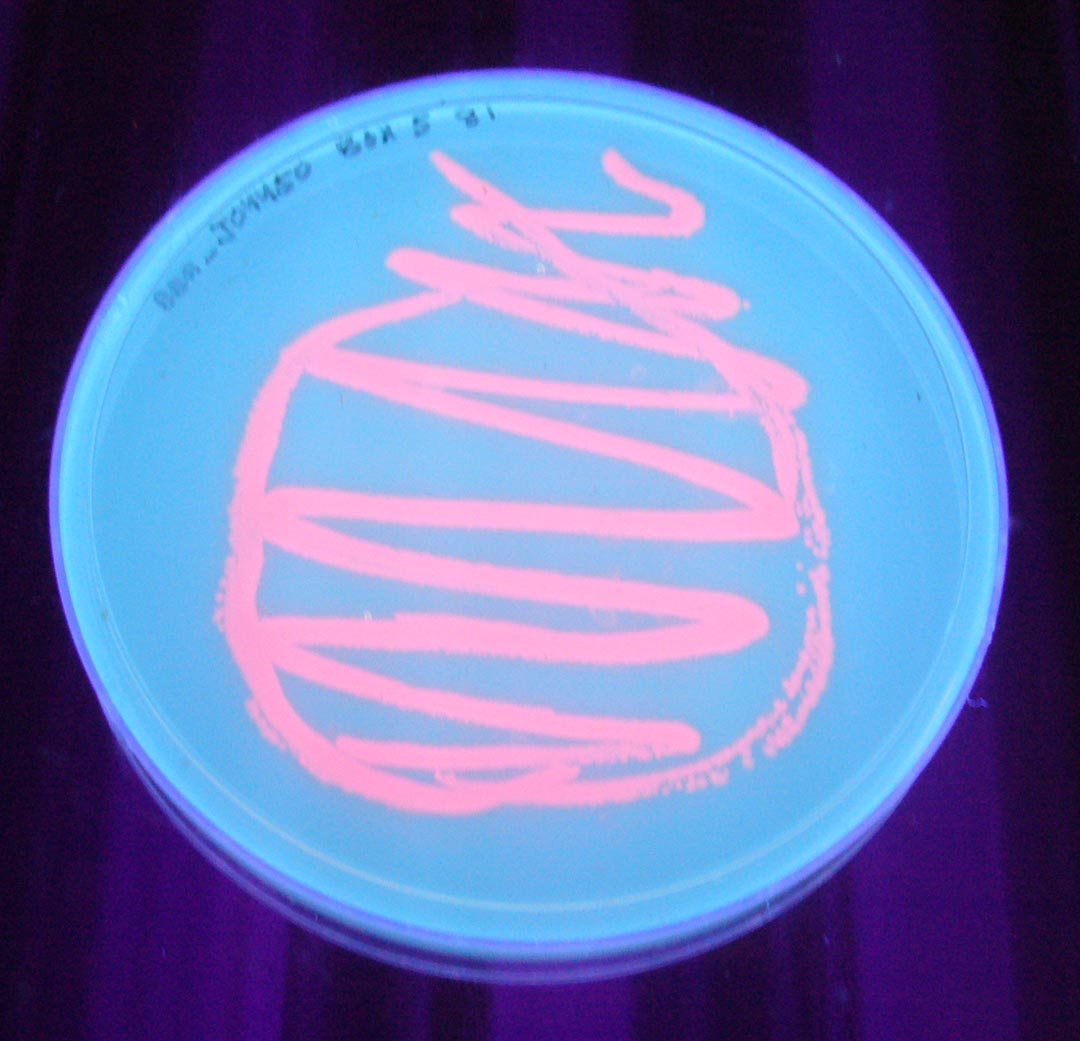
BBa_J04450 visualized under 254nm wavelength UV lightbox
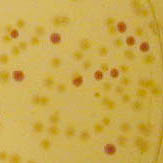
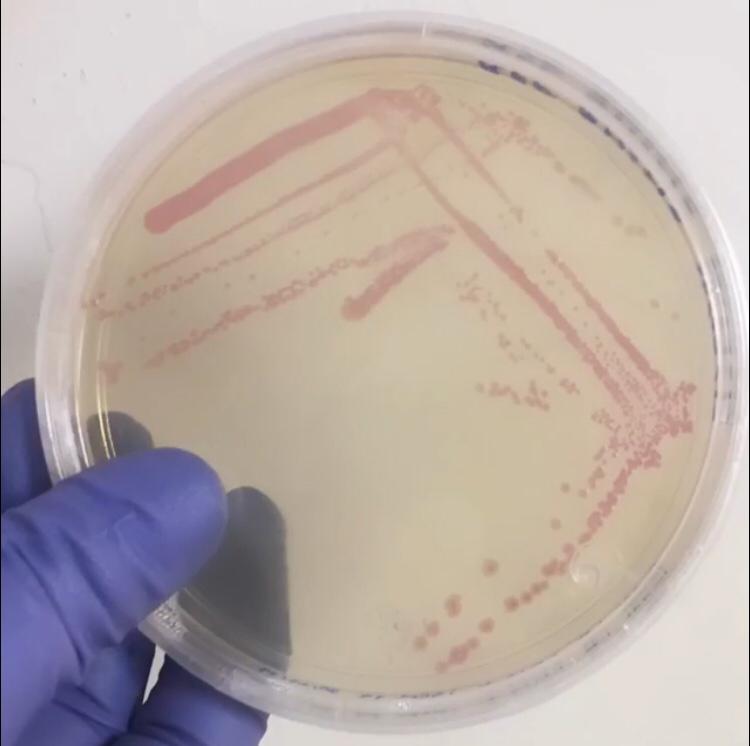
BBa_J04450 Colonies
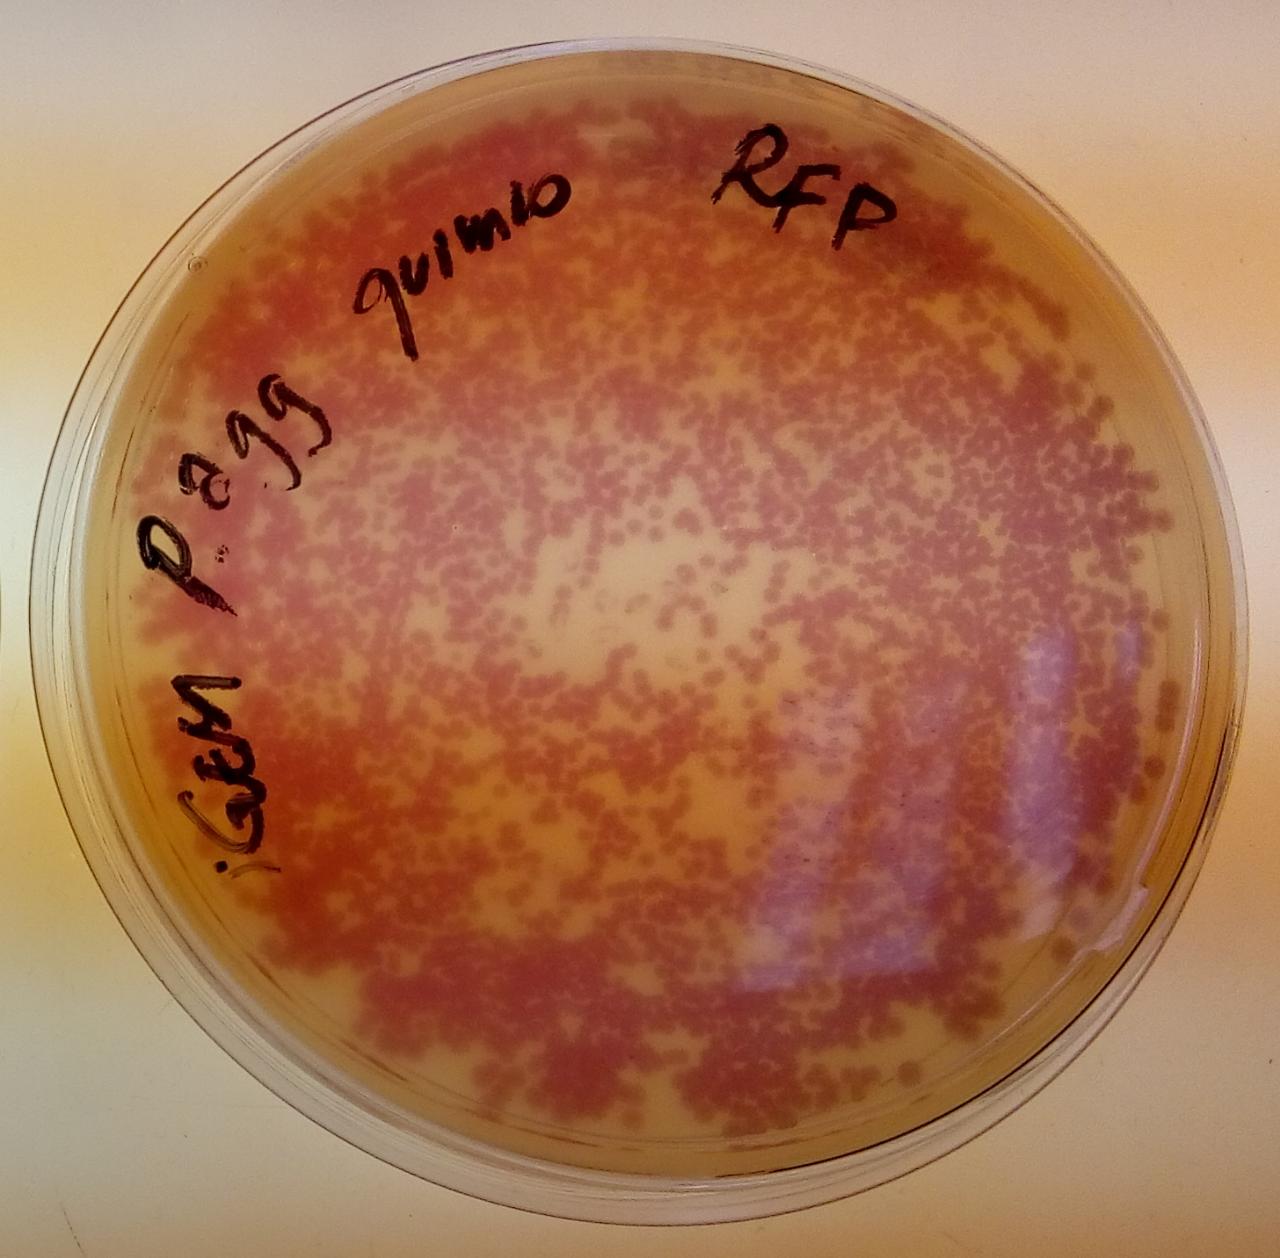
Pantoea agglomerans colonies in chloramphenicol, containing BBa_J04450 in the pSB1C3 backbone
E.Coli SHuffle colonies transformed with BBa_J04450


Team ITB_Indonesia 2017: Red color dynamics of cloned Escherichia coli strains in LB broth

In Team ITB_Indonesia 2017
characterization, we found in normal growth/incubation condition (37 oC, LB agar) that
BBa_J04450-transformed Escherichia coli BL21 colony appear to need longer incubation time (>18
hours) until it clearly shows red color under natural light.
We then investigate whether this phenomenon is influenced by the strain, and we try if there are
lac repressor in the system that can be released by inducing the culture with IPTG, hence
increasing the expression of mRFP.
Experimental Design
We used three different strains of transformed E. coli (BL21, DH5alpha, and Top10) for this
study. They were incubated in LB broth, 37 oC, and sampled every 4 hours for 2 days to
determine the red color absorbance at 588 nm. The amount of IPTG added for respective treatment is 500
µM.
Result and Findings
- There are no significant differences of mRFP expression in different strains of E. coli (BL21, DH5alpha, Top10)
- There are no significant effects of mRFP increased expression after IPTG induction.
- The red color absorbance under 588 nm wavelength is recorded around 2.5-3 OD units.
- The broth become red in color under natural light around 16-20 hours of incubation time.


 ==Pictures==


Team INSA-UPS France 2017 : usage in Vibrio harveyi strain engineered by conjugation
In the context of the iGEM INSA-UPS France project 2017, BBa_J04450 was tested in the Vibrio harveyi background. To the best of our knowledge, RFP has never been used in this strain. BBa_J04450 biobrick was cloned in a broad host range plasmid (pBBR1MCS-4) and conjugated into V. harveyi. The protocol of triparental mating can be found here. Its expression has been studied by fluoresence microscopy in Vibrio harveyi .

The microscopy results demonstrated the fonctional production of RFP in Vibrio harveyi, and hence, the functionality of part BBa_J04450 in this background.
IIT Madras 2016's Characterization


Experimentation
This BioBrick was used along with various GFP producing devices to understand the role of RBS and Promoter parts in giving rise to intrinsic noise in E. coli DH5alpha. Expression data for GFP and RFP proteins were obtained using flow cytometry (BD FACS Aria III) at 3hr, 6hr, 9hr and 12hr stage of growth along with cells expressing only GFP, only RFP and none. Cumulative intrinsic and extrinsic noise were measured using modified [http://2016.igem.org/Team:IIT-Madras/Model#Noise_in_Devices| Elowitz formula]. OD600 values for specific growth rate estimation were obtained using Spectrophotometer over an interval of an hour for 12 hours. Given specific growth rates are in it's logarithmic values. This BioBrick can be used to characterize noise and strength of complex devices by cloning this device with given device, which produces a different reporter protein. In graphs, we have R11-B32, R11-B34, J14-B3, J17-B34, R11-B30 and R11-B31 in pSB1A2 plasmid backbone.
[http://2010.igem.org/Team:Groningen Team Groningen 2010] reports the usage of this part as a cloning tool. When ligating any part, or part assembly, into any standard backbone that contains this part, the non-restricted and single-restricted backbones that self-circularize will produce red colonies on rich media plates (we use TY). These undesired transformants can than be avoided in the screening for the correct construct. With this method, the backbone desired for a new construct does not need to be purified from agarose gel to decrease the amount of undesired tranformants caused by ligation of the original part present in the backbone. The amount of incorrect transformants depends, of course, on the ratio of backbone (mixed with J04450) vs. BioBrick insert, the size of the BioBrick insert, and whether the insert is an assembly of two BioBricks. The images below show two ligations with different efficiencies.


Usage in Chromobacterium Violaceum
[http://2016.igem.org/Team:Tec-Monterrey Team Tec-Monterrey 2016] characterized the output of the part BBa_J04450 in a novel chassis, Chromobacterium Violaceum, as it produces a native purple pigment Violacein, we were curious whether RFP would be useful as a reporter gene. Furthermore, we characterized its expression under lac promoter. We did the transformation of C. Violaceum by a method that has not been reported yet, we made C. Violaceum competent cells with the protocol that is in our wiki, we concluded that the best O.D. for the heat shock transformation is 0.5 since it showed clearly better results than 0.4 or 0.6, we will continue to work in the transformation efficiency.
[Image: ]
]
H14Z1_Hangzhous 2018's Characterization
[http://2018.igem.org/Team:H14Z1_Hangzhou Team H14Z1_Hangzhou 2018]
Purpose
Previous experiments had shown that BBa_J04450-transformed E. coli BL21(DE3) would turn red color under natural light after 18 hours due to leaking expression. This part is useful for characterizing the expression of different proteins using the lacI sensitive promoter. For better application of this promoter in controlling protein expression, the effects of different hosts under various conditions were investigated systematically. The target hosts include E. coli BL21(DE3) and E. coli MC1061. The target culture conditions were temperature, inducer concentration and medium volume in the flask.
Experiment design
- Exploring the effect of temperatures on mRFP expression
1.Inoculate 5 ml LB with monocolony (BL21(DE3)/MC1061) from the plate. Grow the cells overnight at oC,200 rpm.
2.Dilute pre-culture 1:100 into 5ml LB (BL21(DE3)/MC1061) and cultivate at different temperature (26, 30, 34, 37 oC), 200 rpm, respectively.
3.Measure the fluorescence and OD600 every 4 hours. - Exploring the effect of medium volume on mRFP expression
1.Inoculate 5 ml LB with monocolony (BL21/MC1061) from the plate.Grow the cells overnight at 37oC, 200 rpm.
2.Dilute pre-culture 1:100 into 30ml, 50ml, 70ml LB (BL21(DE3)/MC1061) and cultivate at 37oC, 200 rpm.
3.Measure the fluorescence and OD600 every 2 hours. - Exploring the effect of concentration of IPTG on mRFP expression
1.Inoculate 5 ml LB with monocolony(BL21(DE3)/MC1061) from the plate. Grow the cells overnight at 37oC, 200 rpm.
2.Dilute pre-culture 1:100 into 5ml LB (BL21(DE3)/MC1061), cultivate at 37oC, 200 rpm. Protein expression are induced using 0.1, 0.3, 0.5, 0.8, 1.0 mM IPTG, respectively.
3.Measure the fluorescence and OD600 every 4 hours.
Results
- Exploring the effect of temperatures on mRFP expression
- Exploring the effect of effect of medium volume on mRFP expression
- Exploring the effect of concentration of IPTG on mRFP expression
There are some differences of growth rate at different temperatures for both E. coli (BL21(DE3), MC1061) (Fig.1). However, the differences of the fluorescence intensity at different temperature is much higher than those of the growth rate at various temperatures by using two E. coli cells (Fig 2). The fluorescence intensity followed same trend in two E. coli (BL21(DE3)/MC1061).The results indicated that the leaking expression was lower in low temperature (e.g.26 and 30oC) and higher in high temperature. Highest leak appeared in 34 oC. This finding is different from our expectation, where we expected that the highest leaking expression would be at 37 oC


The mRFP expression of two strains showed the same trend in different volume of medium in the flask. After 6 hours, the fluorescence intensity in 30 ml medium-containing flask is significantly higher than others, indicating that mRFP express fastest in this volume scale (Fig 3). This suggest that dissolved oxygen is an important factor which will affect the protein expressin and cell growth, since the lower medium volume in the same type flask will bring about higher level of dissolved oxygen in the medium.

Our results showed that significant fluorescence differences were not observed by using different IPTG induction (Fig 3). However, it is interesting that the fluorescence intensity of E. coli BL21(DE3) after IPTG induction are higher than those of E. coli MC1061, not similar to the trend in our previous experiment (Fig 2). It might be explained that the expression of mRFP can be accelerated by IPTG inductin in BL21(DE3) with regard to other E. coli hosts.

Pictures


SCAU-China 2018's improvement
The BBa_K2559005 is a amended eGFP coding part improved from BBa_l714891.
Usage and Biology
The part BBa_K2559005 has a sequence improvement on the basic part submitted by iGEM07_Peking (BBa_l714891) which encodes the SDY_eGFP. However, we found out a 16 bp nucleotides redundancy in the eGFP starting coding region in BBa_I714891, after checking the sequence of BBa_I714891 from NCBI. Therefore, we decided to delete the redundant 16 bp nucleotides in BBa_I714891 to amend the length of eGFP coding sequence. The amended eGFP coding biobrick is the BBa_K2559005. To test the function of BBa_K2559005, we designed a new E.coli expression vector containing our new part termed as BBa_K2559003under a strong E.coli endogenous promoter (PrplJ). Therefore, the amended eGFP in BBa_K2559005 was driven by PrplJ promoter, and expressed in DH10B. In addition, we also applied the BBa_K2559005 in the promoter intensity analysis of our other two new parts, the BBa_K2559004 and BBa_K2559011 which are relatively weaker E.coli endogenous promoters (PdapA and PcaiF) (Figure 1).


We summarized that our improvedpart, the amended eGFP coding biobrick BBa_K2559005 worked well in DH10B. We also hoped that our improvement on the BBa_I714891 can help their future applications by other groups in the future. However, it is difficult for us to perform additional experiments with BBa_K2559005 and BBa_I714891 due to the unavailable BBa_I714891.
To expand the application of BBa_K2559005, we searched theBBa_J04450 stored in registry and do another improvement in the BBa_J04450. The BBa_J04450 is a strong RFP expression vector in E.coli. As the main page of BBa_J04450 mentioned, the E.coli colonies with BBa_J04450 were in red color under normal light after about 18 hour culture on LB plate (Figure 2). We used the BBa_K2559005 to replace the RFP region in BBa_J04450, the modified part is BBa_K2559009. We transferred the BBa_K2559009 to DH5α by heat-shock, and found that the fluorescence signal can be observed under the UV (Figure 2).

So, we confirm that our improved part BBa_K2559005 can work in different E.coli expression system. We are also looking forward to more application of the BBa_K2559009! </html>
Grenoble-Alpes 2019 Characterization
The goal was to characterize the effect of cAMP on the promoter’s leakages and overall proteins expression
MAIN RESULTS
More informations here or in experience page.
DH5α : standard strain with endogenous adenylate cyclase
activity.
BTH101 : strain without endogenous adenylate cyclase activity
and so without production of cAMP. BTH101 strain is streptomycin
resistant.
BTH101 + adenylate cyclase (BTH101-Zip) to generate cAMP in the
strain.
To restore the adenylate cyclase activity we used two plasmids: one
containing pUT18-LeucineZipper (pUT18-LZ) and the other containing
pKT25-LeucineZipper (pKT25-LZ).
The Leucine Zipper’s (LZ) will
homodimerize and will bring T18 and T25 closer which will restore the
adenylate cyclase activity thus allowing the production of cAMP by
BTH101. Both T18 and T25 are under the control of an IPTG inducible
promoter (lactose promoter) to create an auto amplifier system.
BBa_J04450 was cloned in pKT25-LeucineZipper, and the bacteria was co-
transformed with both plasmid T25-LeucineZipper + BBa_J04450 and
T18-LeucineZipper.

It is apparent that without IPTG there is a visible difference between
strains that can produce cAMP (DH5α and BTH101-Zip) when compared with the BTH101 strain that do not produce any cAMP.
The DH5α red colonies reveal a substantial RFP expression as the result of the
leakage of the promoter.
BTH101 has white colonies indicating that no visible RFP was produced. This data
suggest that the promoter does not leak in that condition.
BTH101-Zip presents same red colonies than the DH5α strain.

RFP expression by BTH101 with or without cAMP shows that without cAMP, the lactose promoter has almost no leakage suggesting that the leakage of the lactose promoter is due to cAMP in absence of IPTG. When the cAMP production is restored the promoter is activated and the protein is expressed.
It is also interesting to note that with the BT101-Zip there are very little protein expression if no IPTG is added.
Tec-Chihuahua 2019 Characterization: RFP expression in E.Coli SHuffle strain
Introduction
E. coli SHuffle T7 Express®️ form New England BioLabs®️ was chosen for its ability to produce disulfide bonded proteins in its cytoplasm. However, no information was found in the Registry about the usage of part BBa_R0010 in SHuffle strains. In order to test this lacI regulated promoter in our chassis, we transformed part BBa_J04450, which expresses RFP under this promoter, into E. coli SHuffle T7 Express®️.Parts BBa_R0010 and BBa_J04450 were characterized. RFP expression was induced in different temperature conditions and IPTG concentration to determine the ideal conditions for the proper functionality of the promoter. Protein expression was analysed through an SDS-PAGE.
Experimentation
First, 3 μL of the 10 pg/μL vial of Part BBa_J04450 (RFP construct) from the Competent Cell Kit were transformed into chemically competent E. coli SHuffle T7 Express®️ cells. Transformed cells were grown on LB agar with chloramphenicol, for BBa_J04450 was located in the pSB1C3 backbone. Small, rounded, and red colonies grew on the surface of the agar.

Once the expression chassis was transformed, protein expression was induced. To do so, two tubes of 10 mL of liquid culture of untransformed E. coli SHuffle T7 Express®️ and six of SHuffle cells transformed with BBa_J04450 were prepared. Once the tubes reached an OD600 of 0.4, they were incubated for 5 hours under the conditions of temperature and IPTG concentration shown in the following table.
| Well | 37°C | Well | 30°C |
|---|---|---|---|
| Negative control | Untransformed control | Negative control | Untransformed control |
| Uninduced control (without IPTG) | Uninduced control (without IPTG) | ||
| |
Transformed cells, 0.2 mM IPTG | |
Transformed cells, 0.2 mM IPTG |
| |
Transformed cells, 0.4 mM IPTG | |
Transformed cells, 0.4 mM IPTG |
Induction temperatures were chosen based on commonly used conditions (37°C) and recommendations of the supplier (30°C). The uninduced control consists of transformed cells without IPTG which meant to serve as an indicator of leakiness in the promoter. IPTG concentrations were chosen based on conditions worked previously when using a T7 promoter (0.2 mM) and recommendations of the supplier (0.4 mM).
After 5 hours of incubation at 225 rpm, cells were centrifuged at 5000 rpm and 4°C for 7 minutes. The pellet was resuspended in a lysis solution with lysozyme and cells were lysed through multiple freeze/thaw cycles. The cell lysates were centrifuged at 21,380 g to separate the soluble protein fraction (supernatant) which was retrieved for its evaluation and quantification. 10 μL of each sample with 50 μg of total protein were mixed with 10 μL of SDS loading buffer and loaded into a 12% polyacrylamide gel. The gel was ran at 10 mA until the running front entered the separating gel; then, the current was increased to 15 mA.
Results
The following image shows the results obtained from the SDS-PAGE.

Two prominent bands can be appreciated in the last two columns, corresponding to induction conditions of 0.2 and 0.4 mM IPTG at 30°C, close to the 25 kDa band of the Precision Plus ProteinTM Dual Xtra Prestained Protein Standards. It was concluded that they correspond to RFP, a 26 kDa protein.
The band corresponding to RFP can be seen in each column with exception of the untransformed cells controls (negative controls). The uninduced controls (column 1 for 37°C and column 4 for 30°C) without IPTG were expected not to show bands if the promoter lacked leakiness; nevertheless, a faint band can be seen for both controls. Bands corresponding to 0.2 and 0.4 mM IPTG for both temperatures (columns 2 and 3 for 37°C and columns 5 and 6 for 30°C) show stronger bands compared to the uninduced control. Thus, the promoter is slightly leaky, but the addition of proper amounts of IPTG increases protein production. When comparing temperatures, incubation at 30°C clearly yields a higher amount of RFP, but yields similar amounts of expression between both concentrations.
Conclusion
We have demonstrated the functionality of promoter BBa_R0010 in E. coli SHuffle T7 Express®️ as well as ideal conditions for protein production by characterizing part BBa_J04450, an RFP construct. E. coli SHuffle T7 Express®️ produces higher amounts of protein at 30°C, and concentrations of 0.2 and 0.4 mM IPTG are enough to induce expression when using this lacI regulated promoter.
Team Lund 2019 charecterization
Aim
The aim of this characterization was to investigate the correlation between the different strains and how the varying amounts of salts and sugars in the media stimulate cell growth and protein expression. RFP was incorporated in the construct to compare the protein expression in various conditions. Three different E.coli strains were tested in three different complex media. The strains that were tested: E. coli TG1 E. coli BL21-DE3 E. coli Nissle 1917 (EcN) While the prepared media were: LB Media TB Media Enriched Complex Media The recipe for the three types of media can be found in our protocols.
Method
The plasmid from the registry was successfully transformed using heat shock to each of the mentioned strains. Three 1 L Erlenmeyer flasks containing 250mL of each media were prepared (9 flasks in total). Cultivation was performed at a temperature of 37 °C and 175 rotations per minute (rpm) , during which the growth was monitored spectrophotometrically. The protein expression could be detected optically from the color formation as well as with the use of Agilent Technologies Cary Eclipse Fluorescence Spectrophotometer at excitation wavelength of 532 nm and emission wavelength of 605 nm. For this experiment, a wavelength of 660 nm was used to measure optical cell density (OD) following the suggestion from iGEM headquarters.
The calibration curves for Rhodamine B (dye equivalent of RFP, obtained from Thermo Fisher Scientific - D1841) and for microbeads (equivalent of cells, provided by iGEM headquarters) were used to create a conversion factor for auxiliary fluorescence unit and Abs 660 nm. Two excitation wavelengths have been used 532 nm (recommended for RFP) and 570 nm (recommended for Rhodamine B). The protocol used to make the standard curves was the iGEM protocol “iGEM 2019 Plate Reader Fluorescence Calibration” for RFP.
Results
Standard curve
The emissions for these two excitation wavelengths can be seen in Figure 1 below.

Figure.1 The emission spectra for various concentrations of Rhodamine B (0 to 50μM): a) excitation at 532nm; b) excitation at 570nm.
One can notice that at excitation wavelength of 532 nm, a clear emission peak can be obtained approximately at 590 nm with the increase in signal intensity for each Rhodamine B concentration. While at excitation wavelength of 570 nm there are no clear peaks but the signal increases with the concentration of the fluorescent dye. Therefore, several standard curves have been plotted. The 532 nm/605 nm (ex./em.) was the one that was used for RFP, the 605 nm was a result of fluorescence shift due to presence of RFP in the cells. The 532 nm/590 nm was the setting to check the theoretical emission Rhodamine B at 590 nm using the same excitation as RFP. The last set of wavelengths 570 nm/590 nm was recommended by the manufacturer of Rhodamine B. The results are presented in Figure 2 below.

Figure 2. Rhodamine B standard curves showing mean fluorescence of four replicates of different concentrations of Rhodamine B (0 µM to 50 µM): a) excitation: 532nm, emission: 605nm; b) excitation: 532nm, emission: 590;c) excitation: 570, emission: 590
It can be clearly seen that in all cases there was an oversaturation of detector at concentrations of 12.5 μM and above. Therefore, it was decided that these concentrations should not be used for creation of standard curve and have been excluded. In case of 532/605, the noise is disturbing the measurement at lower concentrations but both 532/590 and 570/590 do not seem to have the same issues.

Figure 3. Rhodamine B standard curves showing mean fluorescence of four replicates of different concentrations of Rhodamine B (0 µM to 6.25 µM – the higher values were excluded due to oversaturation):a) excitation: 532 nm, emission: 605 nm; b) excitation: 532 nm, emission: 590 nm;c) excitation: 570 nm, emission: 590 nm
It can be seen that all the curves show similar linearity. The data from the curves was used to determine a unit scaling factor (μM Rhodamine B/ fluorescence a.u.) that can be found in Table 1, below.
Table 1. The mean μM of Rhodamine B per fluorescence auxiliary unit (a.u.)

Since all the standard curves have similar linearity but the scaling factors are significantly different, it was decided to choose the manufacturers recommendation and use the date from 570nm excitation and 590nm emission, that is 0.23 μM Rhodamine B/a.u.. It was hence used to convert the fluorescence auxiliary units in the characterisation experiment.
The calibration curve for the particles can be seen in Figure 4. below.

Figure 4. The calibration curve for absorbance of various concentrations silica particles at 660 nm.
The calculated unit conversion factor was 1,23E+09 particles/Abs660 and it was used to convert units in characterization experiments.
The RFP/Rhodamine B Fluorescence Standard Spreadsheets found here for all excitation/emission can be found here:
Characterization results
Figure 5a below shows the growth of EcN in different media in a fraction of time. Enriched Complex Media appears to be the most suitable for the growth of EcN. The lag phase is shorter compared to the other two media, while the logarithmic phase is longer. In TB Media the lag phase is extended, and the growth is not as high as before but still exhibits a clear logarithmic phase. In sharp contrast to that, the lag phase in LB Media is almost double and the exponential phase is quite brief. These results are expected since the media most enriched with salts and sugars are the media with the highest growth rate. The same applies to all strains (Figure 5b and Figure 5c).

Figure 5. The growth of various E. coli strains expressing RFP in different media: a) EcN in LB (blue), TB (orange), EM (grey). b) E. coli BL21-DE3 in LB (blue), TB (orange), EM (grey) c) E. coli TG1 in LB (blue), TB (orange), EM (grey). The OD was converted to equivalent particle count/100μL.
Figure 6 below shows the expression of RFP in different media. In EcN (Figure 6a), the expression of RFP for TB and Enriched Media are comparable, whereas the RFP production in LB is significantly lower. For E. coli BL21-DE3 (Figure 6b), however, the expression levels in TB and LB Media are similar and in Enriched media the RFP production was considerably higher. Finally, in E. coli TG1 (Figure 6c) contrary to the other two strains the Enriched Media gives the lowest RFP levels. The expression in LB media is only slightly higher than in Enriched media. The protein expression in TB Media, however, is notably higher than the other two media, and in comparison to the other strains in the same media. In all three strains, the production of the protein was initiated in LB Media but it could not reach as high values as in the more fortified media, which was expected.

Figure 6. The expression of RFP in various E. coli strains in various cultivation media: a) EcN in LB (blue), TB (orange), EM (grey). b) E. coli BL21-DE3 EcN in LB (blue), TB (orange), EM (grey) c) E. coli TG1 EcN in LB (blue), TB (orange), EM (grey). The OD was converted to equivalent particle count/100μL.
Figure 7 below shows the expression of RFP (converted to Rhodamine B equivalents) per OD (converted to particle/100uL). When it comes to growth, all strains prefered Enriched media. However, it can be noted that each strain has a different preference regarding the RFP expression. EcN produces the most RFP per cell in TB media, BL21 in LB media while in TG1 the expression is favored in both LB and TB media.

Figure 7. The production of RFP per particle count (OD equivalent) for each strain in various media at the end of cultivation: LB (blue), TB (orange), EM (grey).
Figure 8 displays growth of the three strains of E.coli during the characterization of RFP. Overall, the darkest red color was from cells grown in TB media. This was where the protein expression was higher. The other two media, complex Enriched media and LB media both gave a quite pale pink color and low protein expression, with one exception of the BL21-DE3 cells which gave a dark red color and high protein expression. For BL21-DE3 cells, the complex enriched media showed the darkest color. For TG1 cells the TB media gave the darkest color. For EcN cells the TB media also gave the darkest color. These correspond to the results presented in Figure 7.

Figure 8. Growth of three strains of E.coli cells transformed with RFP plasmid BBa_J04450. The cells were grown in different media. The three flasks on the left were grown in TB media, and the strains were from left to right; BL21-DE3, TG1, EcN. The three flasks in the middle were grown in complex Enriched media, and the strains were from left to right; BL21-DE3, TG1, EcN. The three flasks on the right were grown in LB media, and the strains were from left to right; BL21-DE3, TG1, EcN.
Usage and Biology
Using cAMP depleted strains and T18-leucineZipper/T25-leucineZipper under the control of a lactose promoter is a good alternative to produce inducible proteins without leakage
Team BUCT_China 2019
Experimental Design
1.The target gene was obtained by PCR cloning.
2. Digest the gene and plasmid pSB1C3 with enzymes Dpn,IEcoR,Pst I.
3.Ligate the digested gene fragment and plasmid pSB1C3 with T4 enzyme.
4.Transfer the ligation product to Trans 10 by thermal conversion.
5.Plate the transformed strain and culture at 37℃ for 12h.
6.Pick a single colony from the plate to make a bacterial solution.The cells were cultured separately in 24 tubes, and every tube was measured the absorbance in order for each 1 hour.
Results
The growth of the plate colonies was observed as shown in the Figure a. We could see that an appropriate amount of colonies grew on the plate, indicating that the target gene fragment was successfully cloned into Trans 10.

We quantitatively described the growth curve of Trans10 single colony in medium.(Figure b) According to the growth rate constant of the bacteria, we could divide 24h into three different growth phases:0~2h is lag phase; 2~ 15h is an exponential phase; 15~ 24 is a stationary phase.

Newcastle 2019 characterisation
The Newcastle iGEM team aimed to develop a suite of biosensors using fluorescence proteins as a reporter. Our goal was to investigated if we can measure fluorescence level correctly when fluorescence proteins are combined. We investigate whether mixing cultures of cells expressing different fluorescent proteins would affect the fluorescence intensity of the individual fluorescent proteins. The fluorescent proteins we chose were sfGFP (BBa_K515105) and mCherry (BBa_J04450).
We obtained sfGFP and mCherry into pSB1AT3 from iGEM distribution kits. The resuspended DNA was transformed into E. coli DH5 alpha cells. Cells were inoculated in LB media and grown to an optical density 600 (OD600) of 0.6. Half of the culture was diluted to OD600 0.3 and the individual fluorescence levels were measured at: sfGFP - excitation 480nm and emission 507 nm and mCherry – excitation 580 nm, emission 610 nm. The sfGFP and mCherry cultures at OD600 0.6 were mixed together in equal amounts and the fluorescence level of the combined mixture was measured in a BioTek Synergy H1 Microplate Reader with a gain of 100.
The sfGFP and mCherry cultures at OD600 0.6 were mixed together in equal amounts and the fluorescence level of the combined mixture was measured. Theoretically, the OD600 of each fluorescence protein in the mixture will be 0.3. By comparing the individual fluorescence level at OD600 of 0.3 to the fluorescence level of the equivalent fluorescence protein minus the opposing fluorescent protein, the effect of mixing fluorescent proteins can be observed.
The emission spectra for sfGFP ranges from 469 nm to 628 nm and the emission spectra for mCherry ranges from 551 nm to 800 nm. There is an overlap of 77 nm in the emission spectra of the two fluorescent proteins. This small overlap suggests that there will not be much effect on the fluorescence intensity of the individual fluorescent proteins as the overlap will be at an emission with a low percentage emission.

Figure 1. A) Bar chart showing the mean fluorescence intensity of E. coli DH5 alpha cells expressing sfGFP individually at an OD600 of 0.3 with standard deviations compared to the mean fluorescence intensity when mixed with cells expressing the fluorescent protein mCherry Excitation 480 nm, emission 507. B) Bar chart showing the mean fluorescence intensity of E. coli DH5 alpha cells expressing mCherry individually at an OD600 of 0.3 with standard deviations compared to the mean fluorescence intensity when mixed with cells expressing the fluorescent protein sfGFP. Excitation 580 nm, emission 610 nm.
The results of mixing sfGFP and mCherry at sfGFP excitation and emission (Figure 1A) showed that there was no significant difference in fluorescence intensity of sfGFP when mixed with mCherry (Figure 13A). The mean fluorescence of sfGFP individually was 168008 ± 2503.4 compared to the mean fluorescence of sfGFP mixed with mCherry at 172678.2 ± 6826.9. Similarly, at mCherry excitation and emission, similar results were observed and there was no significant difference in fluorescence intensity (Figure 1B). The mean fluorescence of mCherry individually was 4524.8 ± 5.1 compared to the mean fluorescence of mCherry mixed with sfGFP at 4693.6 ± 162.5.
In conclusion, mixing of sfGFP and mCherry did not significantly alter the fluorescence intensity of each individual fluorescent protein. It can be concluded that despite the mixing of fluorescent proteins, when measuring fluorescence intensity, it can be confidently assumed that the results for each fluorescent protein is accurate.
For more detail see - https://2019.igem.org/Team:Newcastle/Results/bronzecharacterisation
Team Aalto-Helsinki 2019 characterization: Effect of antibiotic concentration on fluorescence intensity
Aim
The aim was to characterize the RFP coding device (BBa_J04450) by measuring the effect of a range of different chloramphenicol concentrations on fluorescence intensity in Escherichia coli DH5a.
Method
For the experiment, a DH5a colony harboring the BBa_J04450 was used to inoculate 20 ml of LB medium supplemented with 25 ug/ml chloramphenicol. The culture was grown for 24 h at +37 C with 250 rpm shaking. The experiment was carried out on a 96-well plate with 90 ul of LB+cam and 90 ul of cell culture in each well. The following chloramphenicol concentrations were tested: 12,5 mM; 17,5 mM; 25 mM; 32,5 mM; 62,5 mM; 87,5 mM. Concentrations represent final concentrations in each well after addition of cell culture.
Measurement was carried out with Synergy H1 microplate reader (Biotek). Excitation read was set to 556 nm and emission to 586 nm. OD600 was measured from each well. Optics were read from the bottom of each well. Temperature was set at 37 C (+ preheat) and the plate was under continuous shaking with 230 rpm. Fluorescence and absorbance readings were measured every 10 min over 8 h. Mean fluorescence and OD600 values were calculated from three replicates at each time point. Fluorescence values were normalized with OD600 values so that differences in cell growth would be considered. As a reference for this method, we used a protocol kindly provided by Christopher Jonkergouw from Aalto University. The protocol can be found in our WIKI page under Protocols (18. Fluorescence expression in Microtitre).
Results
OD600 values for each tested antibiotic concentration are presented in Figure 1. Absolute fluorescence values are presented in Figure 2, and normalized fluorescence values in Figure 3.

Initial OD600 levels were between 0.1-1. Cell density of cultures supplemented with lowest antibiotic concentration (12,5) increased from 1.0 to 1.3 during 8 h incubation. Cell density of cultures with higher antibiotic concentrations increased slightly less, up to 1.1 approximately.

Fluorescence values were highest in cell cultures supplemented with lowest antibiotic concentrations (12,5 mM), following a similar pattern to cell density. Second highest fluorescence values were observed with cells supplemented with 25 mM, followed by 62,5 mM concentrations.

Normalized fluorescence values increased in all chloramphenicol concentrations we tested. Fastest increase was observed with the lowest antibiotic concentration. After 8 hours of incubation, highest antibiotic concentration showed the highest fluorescence readings. This is probably because cell density in 87,5 mM cultures increased after 6,5 h incubation.
//classic/reporter/pret
//function/reporter/color
//function/reporter/pigment
| emission | RFP |
| excitation | |
| tag | None |