Part:BBa_K1355001
Regulation and transport of mercury ions
We call this part an “Essential biobrick”. We designed it meaning to be the key piece of many genetic construction related to mercury, eg. Bio-sensor, bio-remediator, bio-accumulator, and among others. This biobrick has bidirectional promoter, having dual functions: A) In reverse: transcription of the MerR regulator protein; and B) In forward: transcription of the MerP and MerT proteins, as represented below:
The operon expression regulation is performed by MerR protein. In the absence of mercury, merR forms a merR-promoter-operator complex, preventing RNA polymerase to recognize the promoter consequently, messengers RNA MerPT will not be transcript. In the presence of Hg 2+ ,MerR protein binds to this element and dissociates from the promoter-operator complex, allowing MerPT expression.
The MerP is a carrier protein that is located in the periplasmic space and has about 91 amino acids. It binds and transports mercury from the inner membrane to the periplasm, the next mercury transport protein is MerT. The MerT has about 116 amino acids and is also a carrier protein it is located in the inner membrane and when binds to mercury transport it from the inner membrane to the cytoplasm.
Essential biobrick (BBa_K1355001) doesn’t have a transcription terminator, because it was made to be attached to others coding regions that permit a new function for bacteria. For this project, we used Escherichia coli DH5-alpha with Essential Biobrick attached to encoding region for Green Fluorescent Protein (BBa_E0840) to build a biosensor; as well as encoding region for Metal Binding Peptide (BBa_K346004) to build a bioaccumulator; and encoding region to mercury reductase (BBa_K1355000).
Source
This construction is based on sequences present in the pO26-CRL plasmid found in Escherichia coli O26. We added a reverse tryptophan operon terminator to ensure transcription termination of the merR messenger RNA. However we didn’t add transcription terminator after the merP gene, aiming connect this biobrick with others, enabling various functions related to mercury (eg. Bio-sensor, bio-remediator, bio-accumulator)

Figure 1: A) p26-CRL plasmid map; B) Illustration of the tryptophan operon terminator.
Experiments and Results
The experiment to quantify GFP expression induced by Hg was made according to the protocol “Quantification of Green Fluorescent Protein (GFP) induced by different concentrations of mercury in Escherichia coli DH5α”. DH5α transformed with BBa_K1355002 was inoculated in LM (LB with low concentration of NaCl) liquid medium with chloramphenicol and grew until the Optical Density was 0.4 to 0.6abs (measured on spectrophotometer at 600 nm wavelength). After cell growth, an aliquot of 500μl in 5 eppendorf tubes (2ml) was taken and then added mercury chloride in order to achieve the concentrations of: 0 µg/ml, 0.01 µg/ml, 0.02 µg/ml, 0.1 µg/ml, 0.2µg/ml and 1 µg/ml. The samples were incubated at 37°C on shaker. We collected each eppendorf tube at time 1 (01:30 hours of incubation), time 2 (03:00 hours of incubation) and time 3 (04:30 hours of incubation). Every sample was centrifuged at 12000g for 3 minutes and the pellet washed with TN Buffer (Nacl 0.15M + Tris HCl 10mM) and then re-suspended with 500μl of the same buffer. The same process was made to the bacterium without construction as a control to GFP expression/intensity. GFP expression was measured using the Hidex Chameleon spectrofluorimeter with excitation filter 340 nm and emission filter 500 nm wavelength. The Optical Density was measured simultaneously. All samples were analyzed in triplicate.
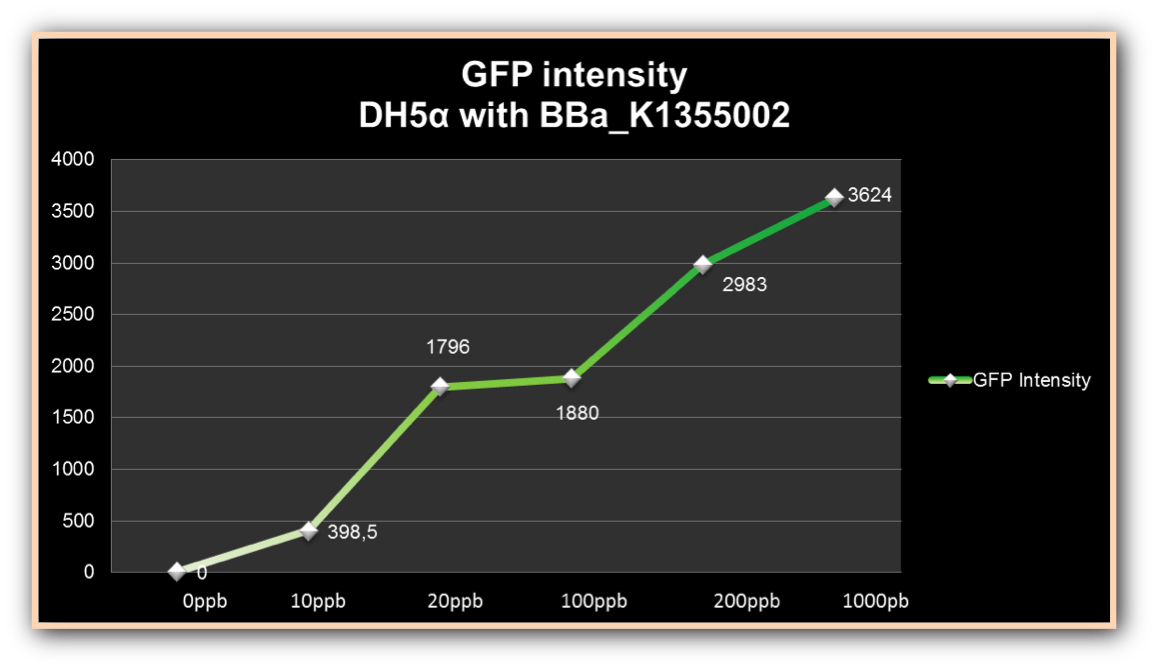
The graph represented on Figure 1 shows the Optical Density of transformed DH5α with BBa_K1355002 in different Hg concentrations in function of time:
Figure 1. Optical Density measured in the four given times, at mercury chloride concentrations of 0 µg/ml, 0.01 µg/ml, 0.02 µg/ml, 0.1 µg/ml, 0.2µg/ml and 1 µg/ml.
As we can observe, after four hours of induction by mercury, GFP expression increases according to the concentration. Mercury Bacter biosensor was efficient even in concentrations as low as 10 ppb, and got still higher emissions in solutions of 1000 ppb. This versatilty makes it a good indicator of water polluted with mercury.
Experiments and Results as a BIOACCUMULATOR (BBa_K1355001 + BBa_K346004) = BBa_K1355003
The experiment for Hg bioaccumulation was made according to the protocol “Quantification of Mercury bio accumulated by metal binding peptide (MBP) in recombinant DH5-alpha in different Hg concentrations”. DH5-alpha transformed with BBa_K1355003 was inoculated in LM (LB with low concentration of NaCl) liquid medium with chloramphenicol and grew until the optical density was 0.4 to 0.6abs (measured on spectrophotometer at 600 nm wavelength). After cell growth, an aliquot of 400μl was taken and distributed in 4 eppendorf tubes (1.5ml) and then added mercury chloride in order to achieve the concentrations: 50 ppb, 100 ppb, 250 ppb and 500 ppb. The samples were incubated at 37°C on shaker. We collected each eppendorf tube at time 1 (01:30 hours of incubation) and time 2 (03:00 hours of incubation). After the designated time, both were centrifuged at 12000g for 3 minutes and the supernatant recovered (LM medium). We washed the pellet with TN Buffer (Nacl 0.15M + Tris HCl 10mM) and then re-suspended with 400μl of the same buffer. To measure bio accumulated Hg, we need to quantify the Hg inside and outside of bacterium after the incubation/exposure time. So we collected and measured the amount of Hg in LM medium supernatant recovered and bacterium re-suspended in TN Buffer. For this we used the equipment Direct Mercury Analyzer (DMA-80). As a control to normal Hg bio accumulated in bacteria, we used DH5-alpha transformed with BBa_K1355002 (Hg bio detector device) which does not present the metal binding peptide. We also measured the Optical Density of each sample. The graph represented on Figure 1 shows the amount of Hg in supernatant (LM medium recovered) and in bacterium (DH5-alpha transformed with BBa_K1355003) at the time 1 (01:30 hours of incubation);
Figure 1: Metal binding peptide activity after 01:30 hours of incubation in five given concentrations of mercury chloride: 50 ppb, 100 ppb, 250 ppb e 500 ppb
It can be observed that the amount of Hg in the Mercury Bacter bioaccumulator increases according to the raise of Hg concentration. The amount of Hg increased 22 times comparing the 50 ppb sample with 500 ppb sample. In the 500 ppb Hg concentration the control bacterium just accumulated 2 per cent of total Hg amount. On the contrary, Mercury Bacter accumulated 40 per cent of total Hg amount in just 01:30 hours of incubation!!! The data keeps raising on the time 2! Check it out!
The graph represented on Figure 2 shows the amount of Hg in supernatant (LM medium recovered) and in bacterium (DH5-alpha transformed with BBa_K1355003) at the time 2 (03:00 hours of incubation);
Figure 2: Metal binding peptide activity after 03:00 hours of incubation in five given concentrations of mercury chloride: 50 ppb, 100 ppb, 250 ppb e 500 ppb.
It can be observed that the amount of Hg in Mercury Bacter bioaccumulator, increases according to the time of incubation. The amount of Hg increased 30 times comparing the 50 ppb sample with 500 ppb sample. In the 500 ppb Hg concentration the control bacterium just accumulated 4% of total Hg amount. Instead, Mercury Bacter accumulated 58% of total Hg amount in just 03:00 hours of incubation!!! The data can be analyzed individually in each concentrations samples as shown in graphs represented in the figures below:
Figure 3: Metal binding peptide activity at 50 ppb in time 1 and 2;
Figure 4: Metal binding peptide activity at 100 ppb in time 1 and 2;
Figure 5: Metal binding peptide activity at 250 ppb in time 1 and 2;
Figure 6: Metal binding peptide activity at 500 ppb in time 1 and 2
Experiments and Results as a BIOREMEDIATOR (BBa_K1355001 + BBa_K1355000) = BBa_K1355004
The experiment for Hg bioremediation was made according to the protocol “Cell growth quantification of mercury resistant Escherichia coli DH5α at differents Hg concentrations by Optical Density”. DH5-alpha transformed with BBa_K1355004 was inoculated in LM (LB with low concentration of NaCl) liquid medium with 0.05μg/ml of mercury chloride and 34μg/ml of chloramphenicol. The inoculum was incubated in shaker overnight at 37°C. After cell growth, we measured Optical Density (O.D.) of the cell culture in spectrophotometer at 600 nm wavelength. A standard quantity aliquot of bacterial suspension was taken in six falcons (50ml) with 10 ml of LM liquid medium and then added mercury chloride in order to achieve the concentrations: 0μg/ml, 1 μg/ml; 2.5 μg/ml; 5 μg/ml; 10μg/ml; 20 μg/ml. The samples were incubated at 37°C on shaker. We collected each sample at the given times, 1 (02:30 hours of incubation), time 2 (04:30 hours of incubation), time 3 (06:30 hours of incubation), time 4 (17 hours of incubation), time 5 (24 hours of incubation) to measure O.D. on spectrophotometer. As control, we used DH5-alpha transformed with BBa_K1355002 (Hg bio detector device) which does not present coding regions for the mercuric ion reductase. We also measured Optical Density of each sample. After cell growth measurement, the samples were frozen to subsequently quantification of Hg remediated by the Mercury Bacter.
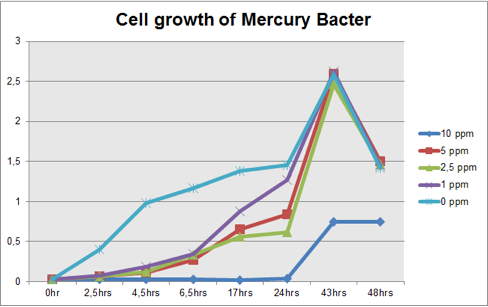
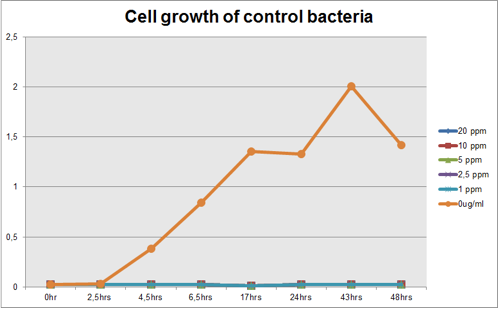
The graph represented on Figure 1 and Figure 2 shows Cell growth of Mercury Bacter and of the control bacteria in different Hg concentrations in function of time, respectively;
Figure 1: Cell growth of Mercury Bacter in different Hg concentrations in function of time;
Figure 2: Cell growth of control bacteria in different Hg concentrations in function of time
Comparing the graphs shown on figure 1 and 2, it can be observed that the biobrick BBa_K135504 provided resistance to high Hg concentrations. Control bacteria did not present resistance to Hg concentration equal or higher to 1 ppm. On the contrary, Mercury Bacter grew up even in 10 ppm Hg concentrations. Interestingly, at the concentration of 10 ppm Mercury Bacter needed 24 hours to exhibit increase in cell growth, and after 48 hours it maintained the same OD, unlike the others. At 1 ppm, 2.5 ppm and 5 ppm Mercury Bacter performed an overwhelming cellular growth after 24 hours of exposure to Hg, reaching approximately the same cellular growth as the non-exposed bacteria!!
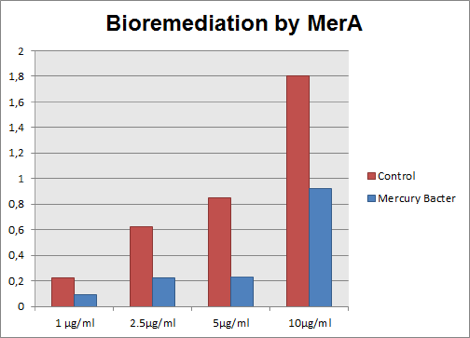
The graph represented on Figure 3 compares Hg concentration in LM medium after 48 hours of experiment, between medium with bacteria used as control and engineered Mercury Bacter.
Figure 3: Hg concentration in LM medium after 48 hours of cell growth in control bacteria and in the genetically engineered Mercury Bacter.
In the graph above it can be observed that our super Mercury Bacter bioremediated! In action, Mercury Bacter reduced 72% of the mercury levels, in comparison to control at the sample 5 ppm! In 1 ppm, Even though on 10 ppm concentration, where bacteria had a slow growth rate only after 24 hours, it bioremediated 48.02%! These results demonstrate our constructions’ efficiency, both for biobrick BBa_K1355001 as a promoter regulated by MerR protein and to BBa_K1355000 as MerA encoding gene!
References
Barkay, T., Miller, S. M., & Summers, A. O. (2003). Bacterial mercury resistance from atoms to ecosystems. FEMS microbiology reviews, 27(2‐3), 355-384.
BIONDO, R. Engenharia Genética de Cupriavidus metallidurans CH34 para a Biorremediação de efluentes contendo Metais Pesados. 2008. São Paulo, Brasil.
Nascimento, A. M., & Chartone-Souza, E. (2003). Operon mer: bacterial resistance to mercury and potential for bioremediation of contaminated environments. Genetics and Molecular Research, 2(1), 92-101.
DASH, H. R.; DAS, S. Bioremediation of mercury and the importance of bacterial mer genes. 2012. International Biodeterioration & Biodegradation 75: 207 – 213.
HAMLETT, N. V.; et al. Roles of the Tn21 merT, merP and merC Gene Products in Mercury Resistance and Mercury Binding. 1992. Journal of Bacteriology 174: 6377 – 6385.
PINTO, M. N. Bases Moleculares da resistência ao Mercúrio em bactérias gram-negativas da Amazônia brasileira. 2004. Pará, Brasil.
Sequence and Features
- 10COMPATIBLE WITH RFC[10]
- 12INCOMPATIBLE WITH RFC[12]Illegal NheI site found at 988
- 21COMPATIBLE WITH RFC[21]
- 23COMPATIBLE WITH RFC[23]
- 25INCOMPATIBLE WITH RFC[25]Illegal NgoMIV site found at 586
Illegal NgoMIV site found at 1160 - 1000INCOMPATIBLE WITH RFC[1000]Illegal SapI site found at 579
| None |


