
Difference between revisions of "File:BBa K2350020 LineGraph.png"
(Yang20051 uploaded a new version of File:BBa K2350020 LineGraph.png) |
(Yang20051 uploaded a new version of File:BBa K2350020 LineGraph.png) |
(No difference)
| |
Revision as of 10:51, 30 October 2017
File history
Click on a date/time to view the file as it appeared at that time.
| Date/Time | Thumbnail | Dimensions | User | Comment | |
|---|---|---|---|---|---|
| current | 10:53, 30 October 2017 |  | 1,180 × 942 (86 KB) | Yang20051 (Talk | contribs) | The line graph presents the general trend of O.D.600 value per hour after lactose is added. As the figure shows, the suicide mechanism is induced immediately when lactose is added into the samples. Besides, we can see that the lactose concentration and... |
| 10:51, 30 October 2017 | 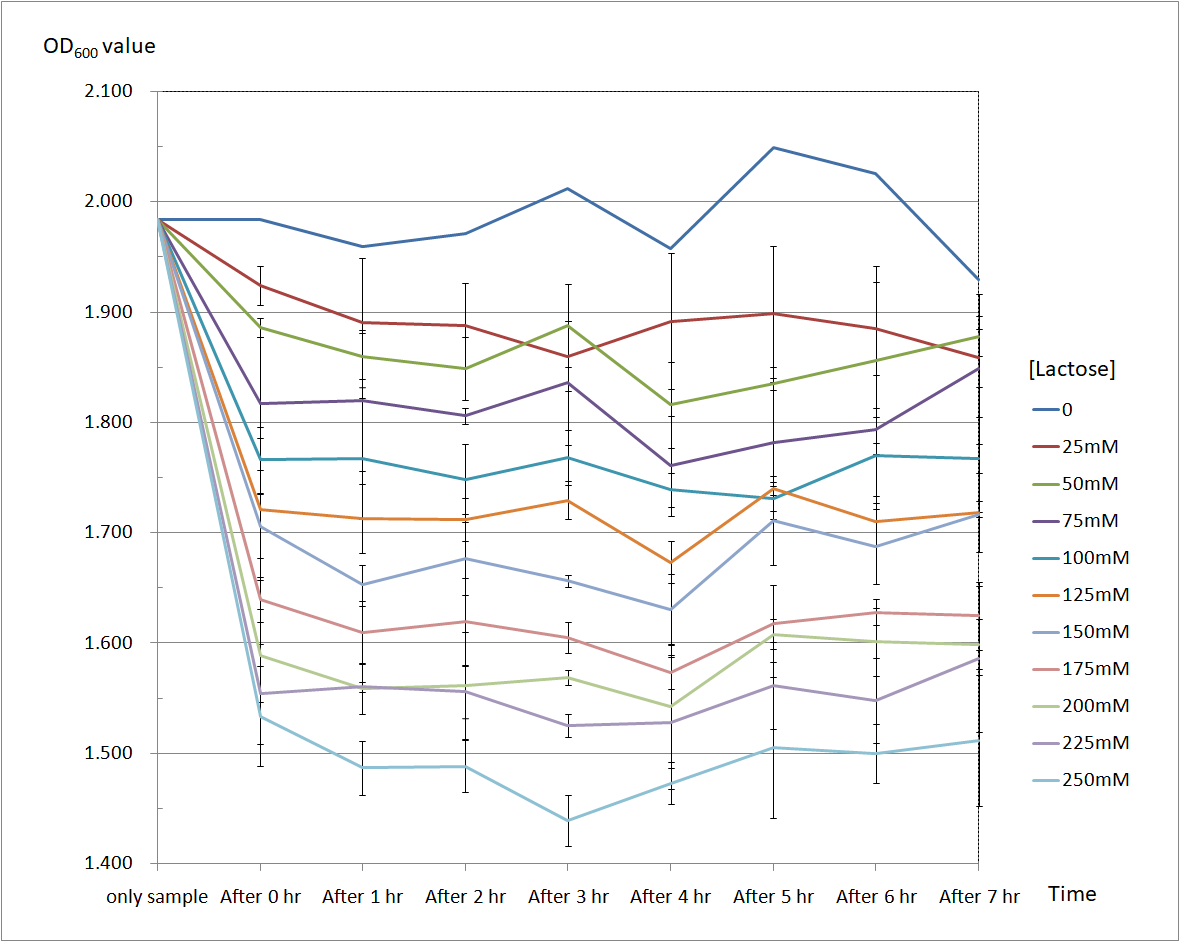 | 1,180 × 942 (86 KB) | Yang20051 (Talk | contribs) | The line graph presents the general trend of O.D.600 value per hour after lactose is added. As the figure shows, the suicide mechanism is induced immediately when lactose is added into the samples. Besides, we can see that the lactose concentration and... | |
| 03:15, 28 October 2017 | 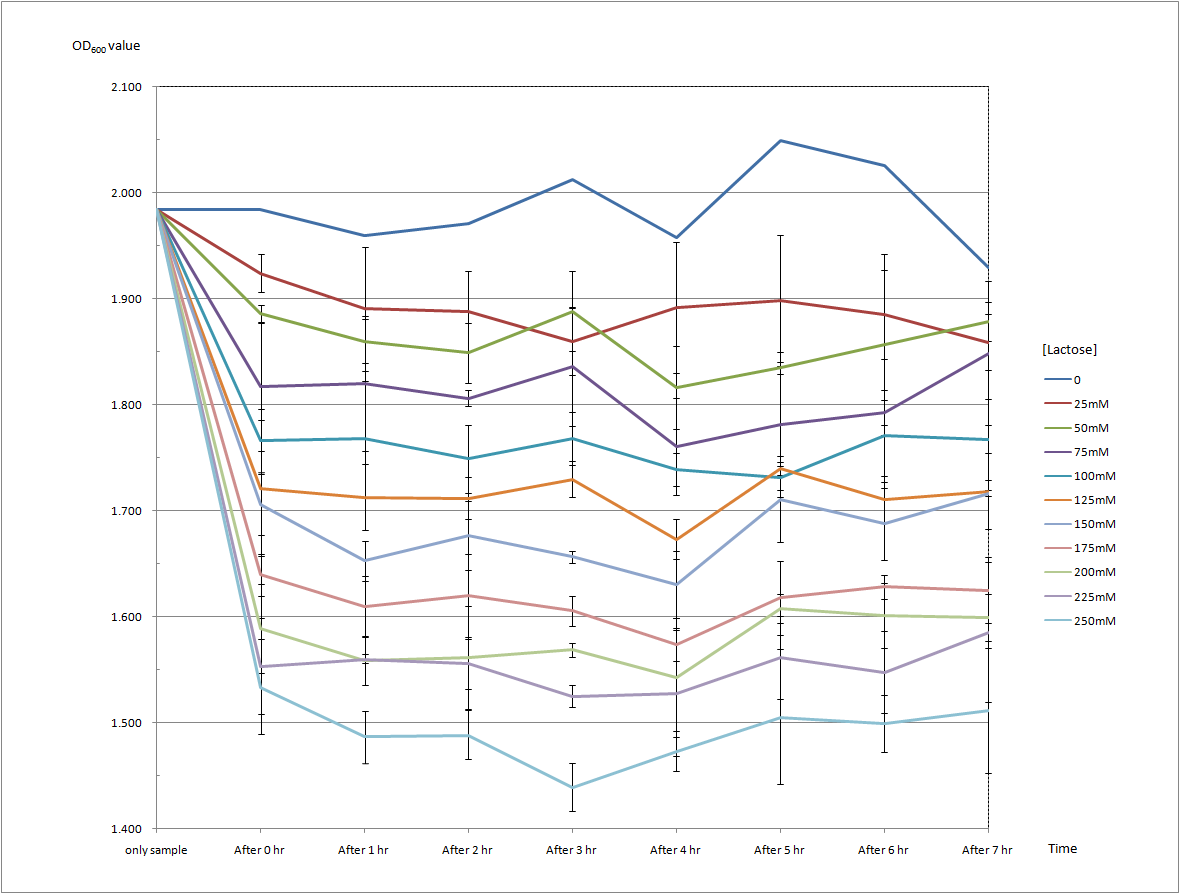 | 1,180 × 894 (73 KB) | Yang20051 (Talk | contribs) | This line graph presents the general trend of O.D.600 value per hour after lactose is added. As the figure shows, the suicide mechanism is induced immediately when lactose is added into the samples. Besides, we can see that the lactose concentration an... | |
| 07:36, 24 October 2017 |  | 1,180 × 894 (73 KB) | Yang20051 (Talk | contribs) |
- You cannot overwrite this file.
File usage
The following 5 pages link to this file: