Part:BBa_K1060000
AroG; DAHP synthase
The aroG gene, coding for 3-deoxy-D-arabino-heptulosonate-7-phosphate synthase, is a part of the Shikimate pathway. It converts phosphoenolpyruvate and erythrose-4P to chorismate. In our project chorismate was one of the precursors needed for the biosynthesis of methyl salicylate (see also BBa_K1060003). As basic chorismate levels inside E. coli are limited. We wanted to upregulate the biosynthesis of chorismate. The basic aroG gene can be repressed by phenylalanine. However, mutatations in the amino acid sequence (Pro150Leu and Leu175Asp) can prevent this repression by phenylalanine.
iGEM2022-UCAS-China-Contribution
We used aroG in one of our plasmids for the overproduction of tyrosine: tyrA-aroG-tktA-ppsA/pet-28a for vanillin synthesis BBa_K4256011.
Sequence and Features
- 10COMPATIBLE WITH RFC[10]
- 12COMPATIBLE WITH RFC[12]
- 21INCOMPATIBLE WITH RFC[21]Illegal XhoI site found at 934
- 23COMPATIBLE WITH RFC[23]
- 25COMPATIBLE WITH RFC[25]
- 1000INCOMPATIBLE WITH RFC[1000]Illegal SapI.rc site found at 241
2021 XJTU-China's Improvement
This part has been improved by 2021 team: XJTU-China. The improved version, AroG-S211F(BBa_K3832000), has been analyzed by structural modelling and measured by experiments.
Here some important results of our improvement have been shown below. And for more detailed methods and results, please check pages of Part:BBa_K3832000 and our wiki Team:XJTU-China/Improve
Structural Modelling Result
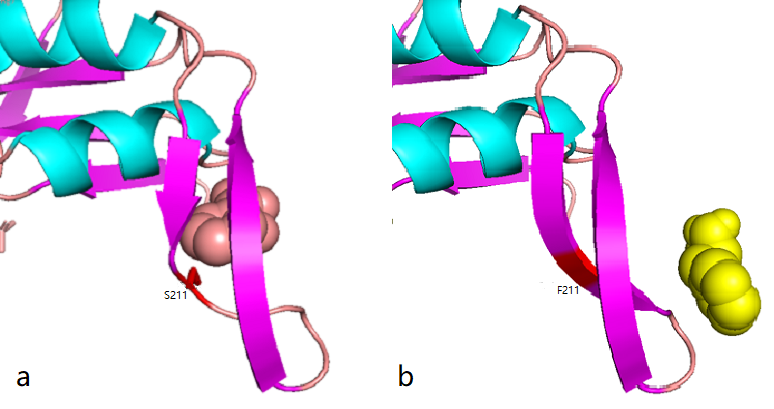
According to the docking results, the protein pocket conformation of wild-type and mutant AroG bound to PEP has not changed significantly. The Red is the experimentally measured conformation of Phe in the crystal protein bound by aroG and Phe, and the pink is the docking site and the conformation of Phe predicted by AutoDockTools software. In general, the changes in binding PEP sites are not very significant.
Phe site:

Figure 1.1 Comparison between docking site of Phe, (a)Binding site of wild-type AroG and Phe;(b)Binding site of mutant AroG-S211F and Phe, in which mutant site is shown as red
It can be seen from the docking results that the Ser at AroG 211 mutating to Phe changes the conformation of the protein pocket which originally binds to Phe, and the binding site of Phe changes accordingly. The binding energy calculated by AutoDockTools software shows that the binding ability of mutant aroG and Phe becomes weaker. Therefore, it can be concluded that the conformation of the mutant aroG and Phe binding protein pocket changes, so that the binding ability of Phe to it becomes smaller, and the allosteric inhibition effect of Phe is reduced, finally the catalytic efficiency of aroG on PEP increases.
2 Characterization & Measurement
We have constructed the inducible circuit BBa_K3832008to characterize and measure the function of aroG-S211F, by detecting the yield of tryptophan. Besides, to verify the impact of aroG-S211F to the cell proliferation, we measured the growth curve of the wild-type E.coli and the engineered E.coli with aroG-S211F.
The circuit BBa_K3832008 is inserted into pET28a+ vector. DH5alpha with empty pET28a+ plasmid is used as negative control, representing the function of native aroG which is contained in the genome of E.coli .
For more information on our methods and results, please see our wiki: Team:XJTU-China/Improve
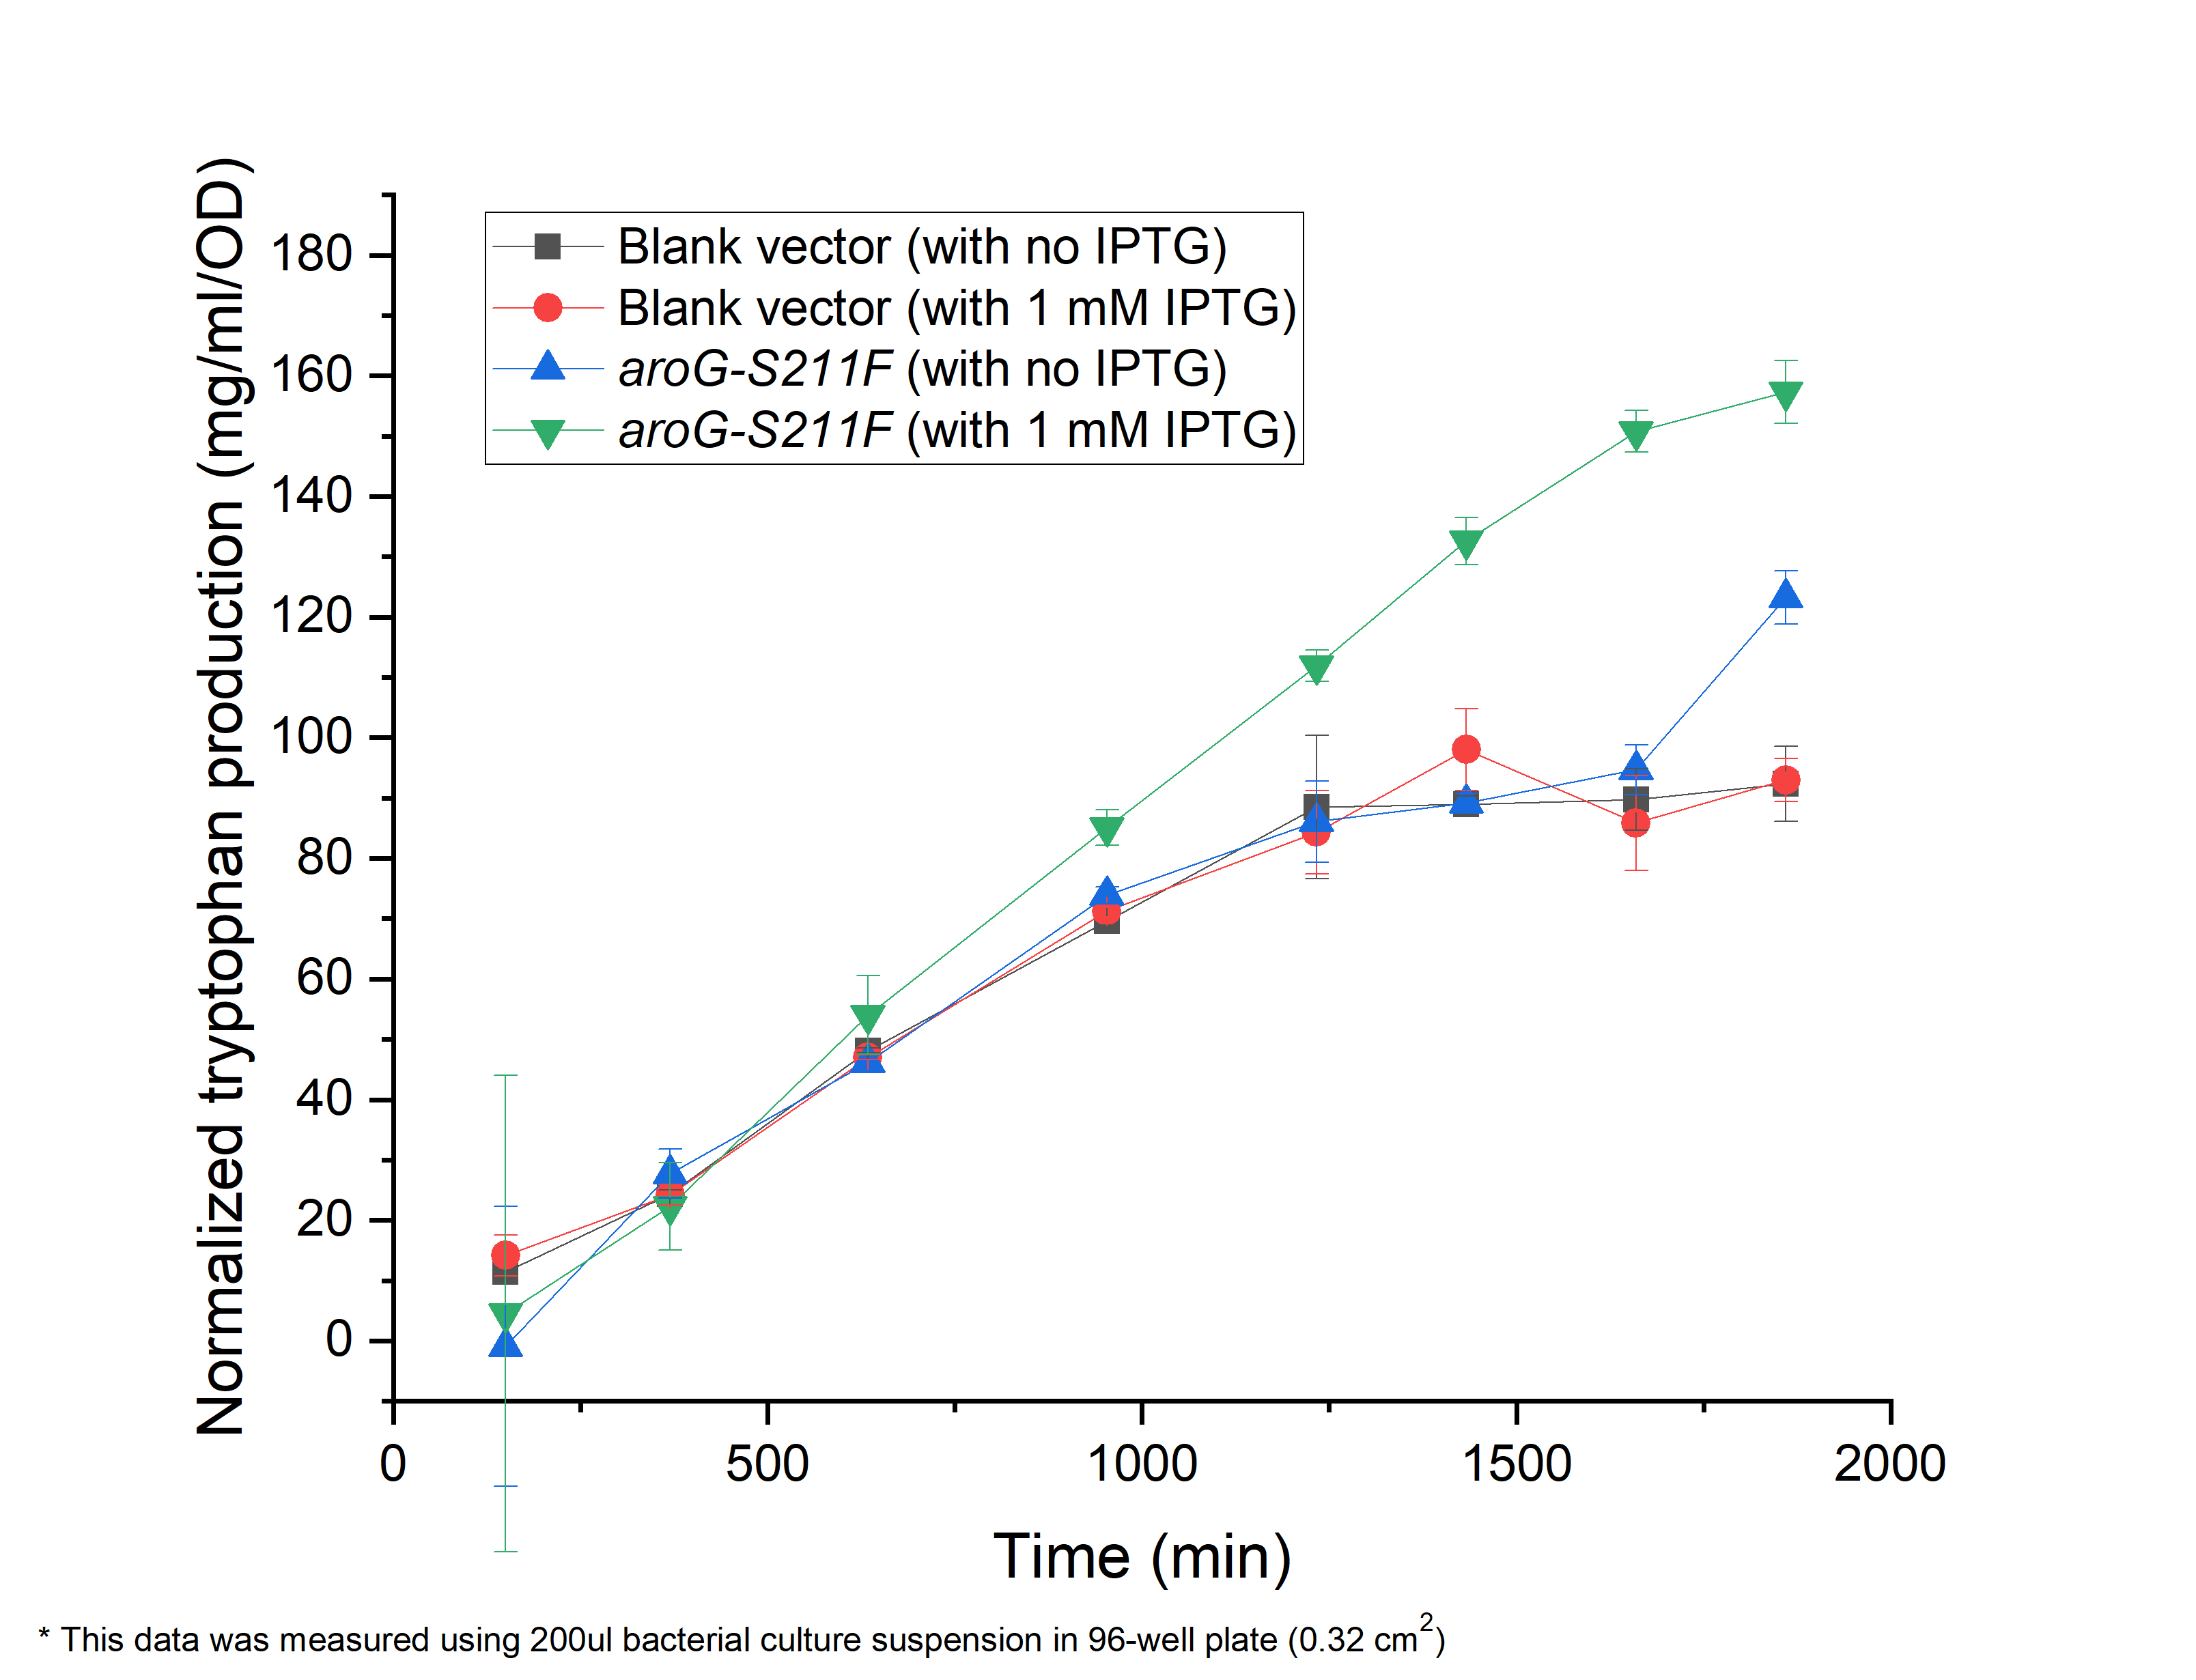
As shown in Fig. 2.1, compared with the E.coli harboring the blank vector and native aroG gene (BBa_K1060000), the yield of tryptophan in the engineered E.coli with aroG-S211F induced by 1 mM IPTG continuously increased in the 30 h cultivation (green triangle), reaching a maximal productivity of 160 mg/ml per OD, while the blank controls slowly increased and maintained its production at about 1200 min, arriving about 80 mg/ml per OD, half of the previous one (circle and square). It is the same case in absent of IPTG (blue triangle), indicating the low leaky expression of our circuit. In all, our circuit containing AroG-S211F can efficiently produce tryptophan with the highest productivity of 160 mg/ml per OD, which can be further improved under the control of toggle-switch.
Fig. 2.1 The relationship between tryptophan concentration in culture medium and culture time. The concentration of tryptophan is measured by PDAB chromogenic method.
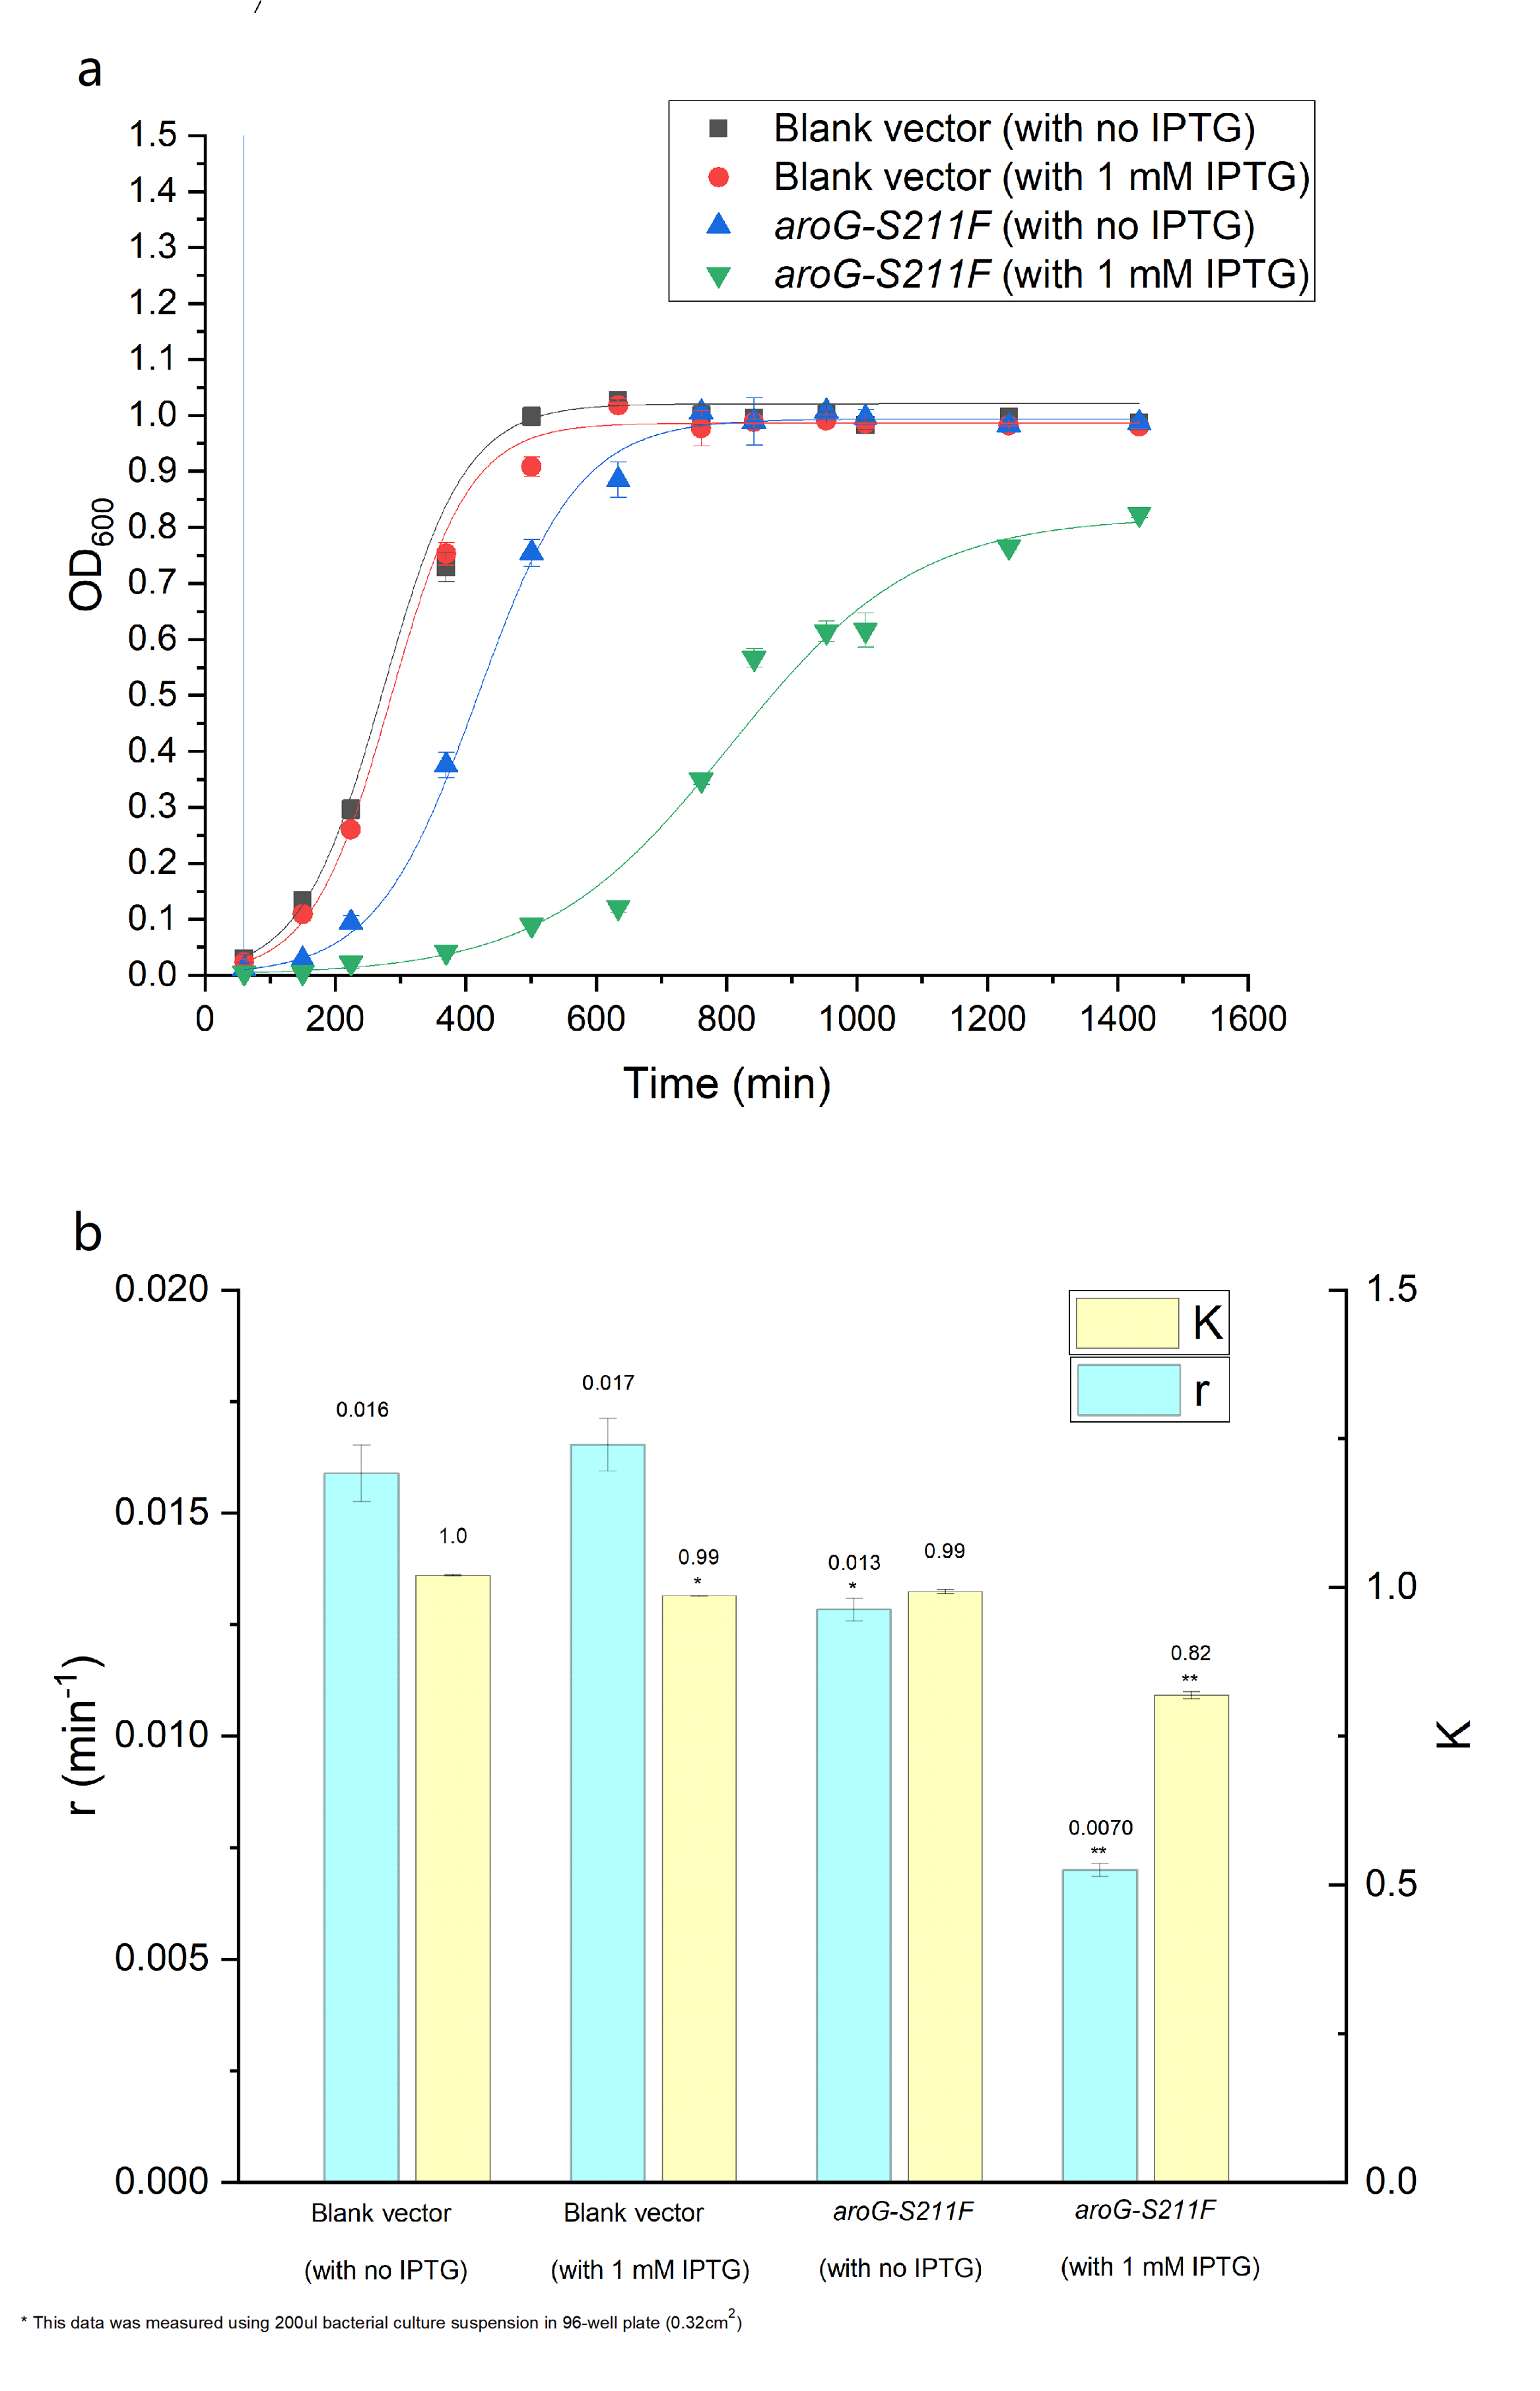
The over-expression of aroG inhibits the glycolysis pathway, thus definitely affecting the cell growth. So the effect of aroG-S211F on cell proliferation was also detected. The OD600 of engineered E.coli and blank strain were continuously monitored, as shown in Fig.2.2 The Logistic equation was used to fit the growth curve, the obvious inhibitory effect of aroG expression on cell proliferation was observed, especially with IPTG induction. The growth parameters K (environmental capacity) and r (intrinsic growth rate) of different experimental groups was also obtained from the fitting Logistic curve, and the parameter r decreased dramatically in E.coli with aroG-S211F induced by IPTG, indicating the increased doubling time of the cell.
Fig. 2.2 (a) The population density of E.coli was measured at 600nm by colorimetry. The scatter represents the result of the measurement. The Logistic equation was used to fit the growth curve, and the fitting results were shown in the curve. (b) shows the growth parameters K (environmental capacity) and r (intrinsic growth rate) of different experimental groups obtained from the fitting results in (a).
Here DH5alpha with empty vector has been used as the control, which can represent the function and character of wild-type aroG, for this gene is contained in the genome of E.coli.
2022 BUCT's Improvement
This part has been improved by 2022 team BUCT,the adapted version aroG-fbr(BBa_K4146502)has been analyzed by bio-modeling and proved by a series of experiments.Please check out our wiki page for more information:LINK [1]
essential results shown below
We used aroG-fbr (BBa_K4146502) to enhance the synthesis pathway in the de novo synthesis of 2-phenylethyl alcohol.

Figure 1 Biochemical reactions catalyzed by aroG
This gene encodes an enzyme that catalyzes the synthesis of DAHP, which directs carbon flow to the phenylalanine synthesis pathway. The phenylalanine-bound hydrophobic pocket consists of 12 amino acid residues, including Asp6, Asp7, Ile10, Pro150, Gln151, Leu179, Ser180, Phe209, Ser211 and Val221.
By reading the literature, we carefully interpreted the reasons behind the inhibitory effect of phenylalanine on aroG catalysis.

Figure 2 Figure 2 Structural changes in the DAHPS functional domain upon Phe binding. The protein chain (green, blue, red, black), Mn2+(cyan), phosphoenolpyruvate , and Phe (both in gold) are shown for +Phe DAHPS. The superimposed main chain of the -Phe enzyme is shown in gray . The main chains of four segments colored in red shift significantly upon Phe binding. These four segments are involved in transmission of the inhibition signal within a subunit from the Phe binding site to the active site. The change in conformation of the β8-α8 loop segment, shown in black, is due to differences in crystallization conditions.
When phenylalanine inhibits aroG, the crystal structure of the enzyme will undergo a large conformational change. The binding of Phe triggers the breaking and formation of many contacts between residuesIn this enzyme, the solvent enters the cavity of the binding site. Upon Phe binding, the entire N-terminal fragment of the constituent subunit of the compact dimer becomes ordered, forming a lid that participates in the coordination of the bound Phe and insulates its portion from solution.
The binding of Phe initiates the breaking and formation of many contacts between residues. They bind to each other to form many new hydrogen bonds, and these new interactions bind different segments of the polypeptide chain of the aroG protease together, allowing the enzyme to emerge in a new conformation.
BUCT modeled aroG-fbr homology and aligned the molecular model of the enzyme with the original type:

Figure 3 BUCT homology modeling aroG-fbr, original type on the left is blue and BUCT mutant on the right is pink.
We hypothesized that the conformational change of the enzyme protein caused by the mutation might be the main reason for weakening the inhibitory effect of Phe. In the model comparison results, we found that the mutated molecular pocket appears to be sealed by a larger lid.

Figure 4 The red and dark blue sections represent the molecular conformational changes after the aroG sequence mutation. The spatial position of residues in front of the molecular cavity increases
We also used this mutant gene to synthesize 2-phenylethyl alcohol (2-PE), and the yield results can be seen in the following figure. In our fermentation experiment, the highest yield of 2-PE reached 67.16mg/L.
Figure 5 yield of 2-PE in E. coli Nissle 1917
| None |


