Part:BBa_K3716009
Modified T7 promoter (C4)
Modified T7 promoter (C4)
Usage and Biology
This biological part is a promoter that can be recognized by T7 RNA polymerase and efficiently transcribe downstream genes. It is designed by mutations of a T7 promoter [1, 2]. A series of modified promoters by mutations of T7 can be designed, such as H9 promoter and G6 promoter [1, 2].
Measurement by iBowu-China 2021
This year we used this promoter to express sfGFP or β-glucuronidase enzyme in strains such as E. coli BL21 (DE3) to produce green fluorescence, or to convert glycyrrhizic acid into glycyrrhetinic acid. In order to explore the catalytic effect of the β-glucuronidase enzyme under different protein expression levels, according to the literature [1, 2], we designed three promoters, C4, H9 and G6 to evaluate the performance for C4 promoter. They can all be activated by T7 RNA polymerase, but the strength is different. Users can choose a suitable promoter according to the required expression intensity.
C4 K3716009 ( K3716009 ), H9 K3716010 ( K3716010 ), and G6 K3716011 ( K3716011 ).
Protocol
- Transform the plasmids into E. coli BL21(DE3)
- Pick a single colony by a sterile tip from each of the LB plates for all the experimental and control groups. Add the colony into 4ml LB medium with kanamycin. Add 1mM IPTG to all experimental groups as needed. Incubate at 37℃ in a shaker overnight.
- Fluorescence. Acquire 100 ul bacteria culture and centrifuge at 10000g for 1 min. Aspirate the supernatant and resuspend with 100 ul ddH2O to get rid of the fluorescence background from LB medium. Add 100 µl sample solution into a sterile 96-well plate. Measure fluorescence with a microplate reader and then also measure OD600 for normalization.
- SDS-PAGE.
- Take 1ml of bacterial solution, centrifuge at 12000g for 1min at 4℃, discard the supernatant, add 100ul of pre-cooled RIPA lysate (high), vortex to mix, settle for 5min, centrifuge at 4℃, 12000g for 10min, and take the supernatant which contains the protein extract. After protein quantification by BCA method using commercial test box, adjust the concentration of the protein solution to 1mg/ml. Take 4 parts of the protein solution and 1 part of 5X protein loading buffer and mix it in a boiling water bath for 5 minutes, centrifuge at 12000g at 4°C for 10 minutes, take the supernatant, and store on ice. Use precast gel purchased from commercial company (Transgen, Precast Tris-Glycine Gel) for protein electrophoresis.
- Add marker in the first lane on the left at 5μl, and add sample on all other lanes with 10ul sample on each lane. Use 100V for electrophoresis. After the electrophoresis, take out the gel, put it in the staining box, add Coomassie Brilliant Blue dye solution to about 3mm below the gel surface, shake on a horizontal shaker, dye for 30min at room temperature, discard the dye solution, wash off the floating color with distilled water, and add decolorization liquid, decolorize on a horizontal shaker until the result is in good condition for taking pictures.
- Enzyme Activity
- Take 100 ul of bacterial solution, centrifuge at 10000g for 1min at room temperature and discard the supernatant. Resuspend with 100ul ddH2O, and add into this solution 100ul of standard test solution I (containing Phenolphthalein-β-D-glucuronide, and the test box was purchased from Nanjing Jiancheng Biotech company). Incubate the mixture at 37C for 1 hour.
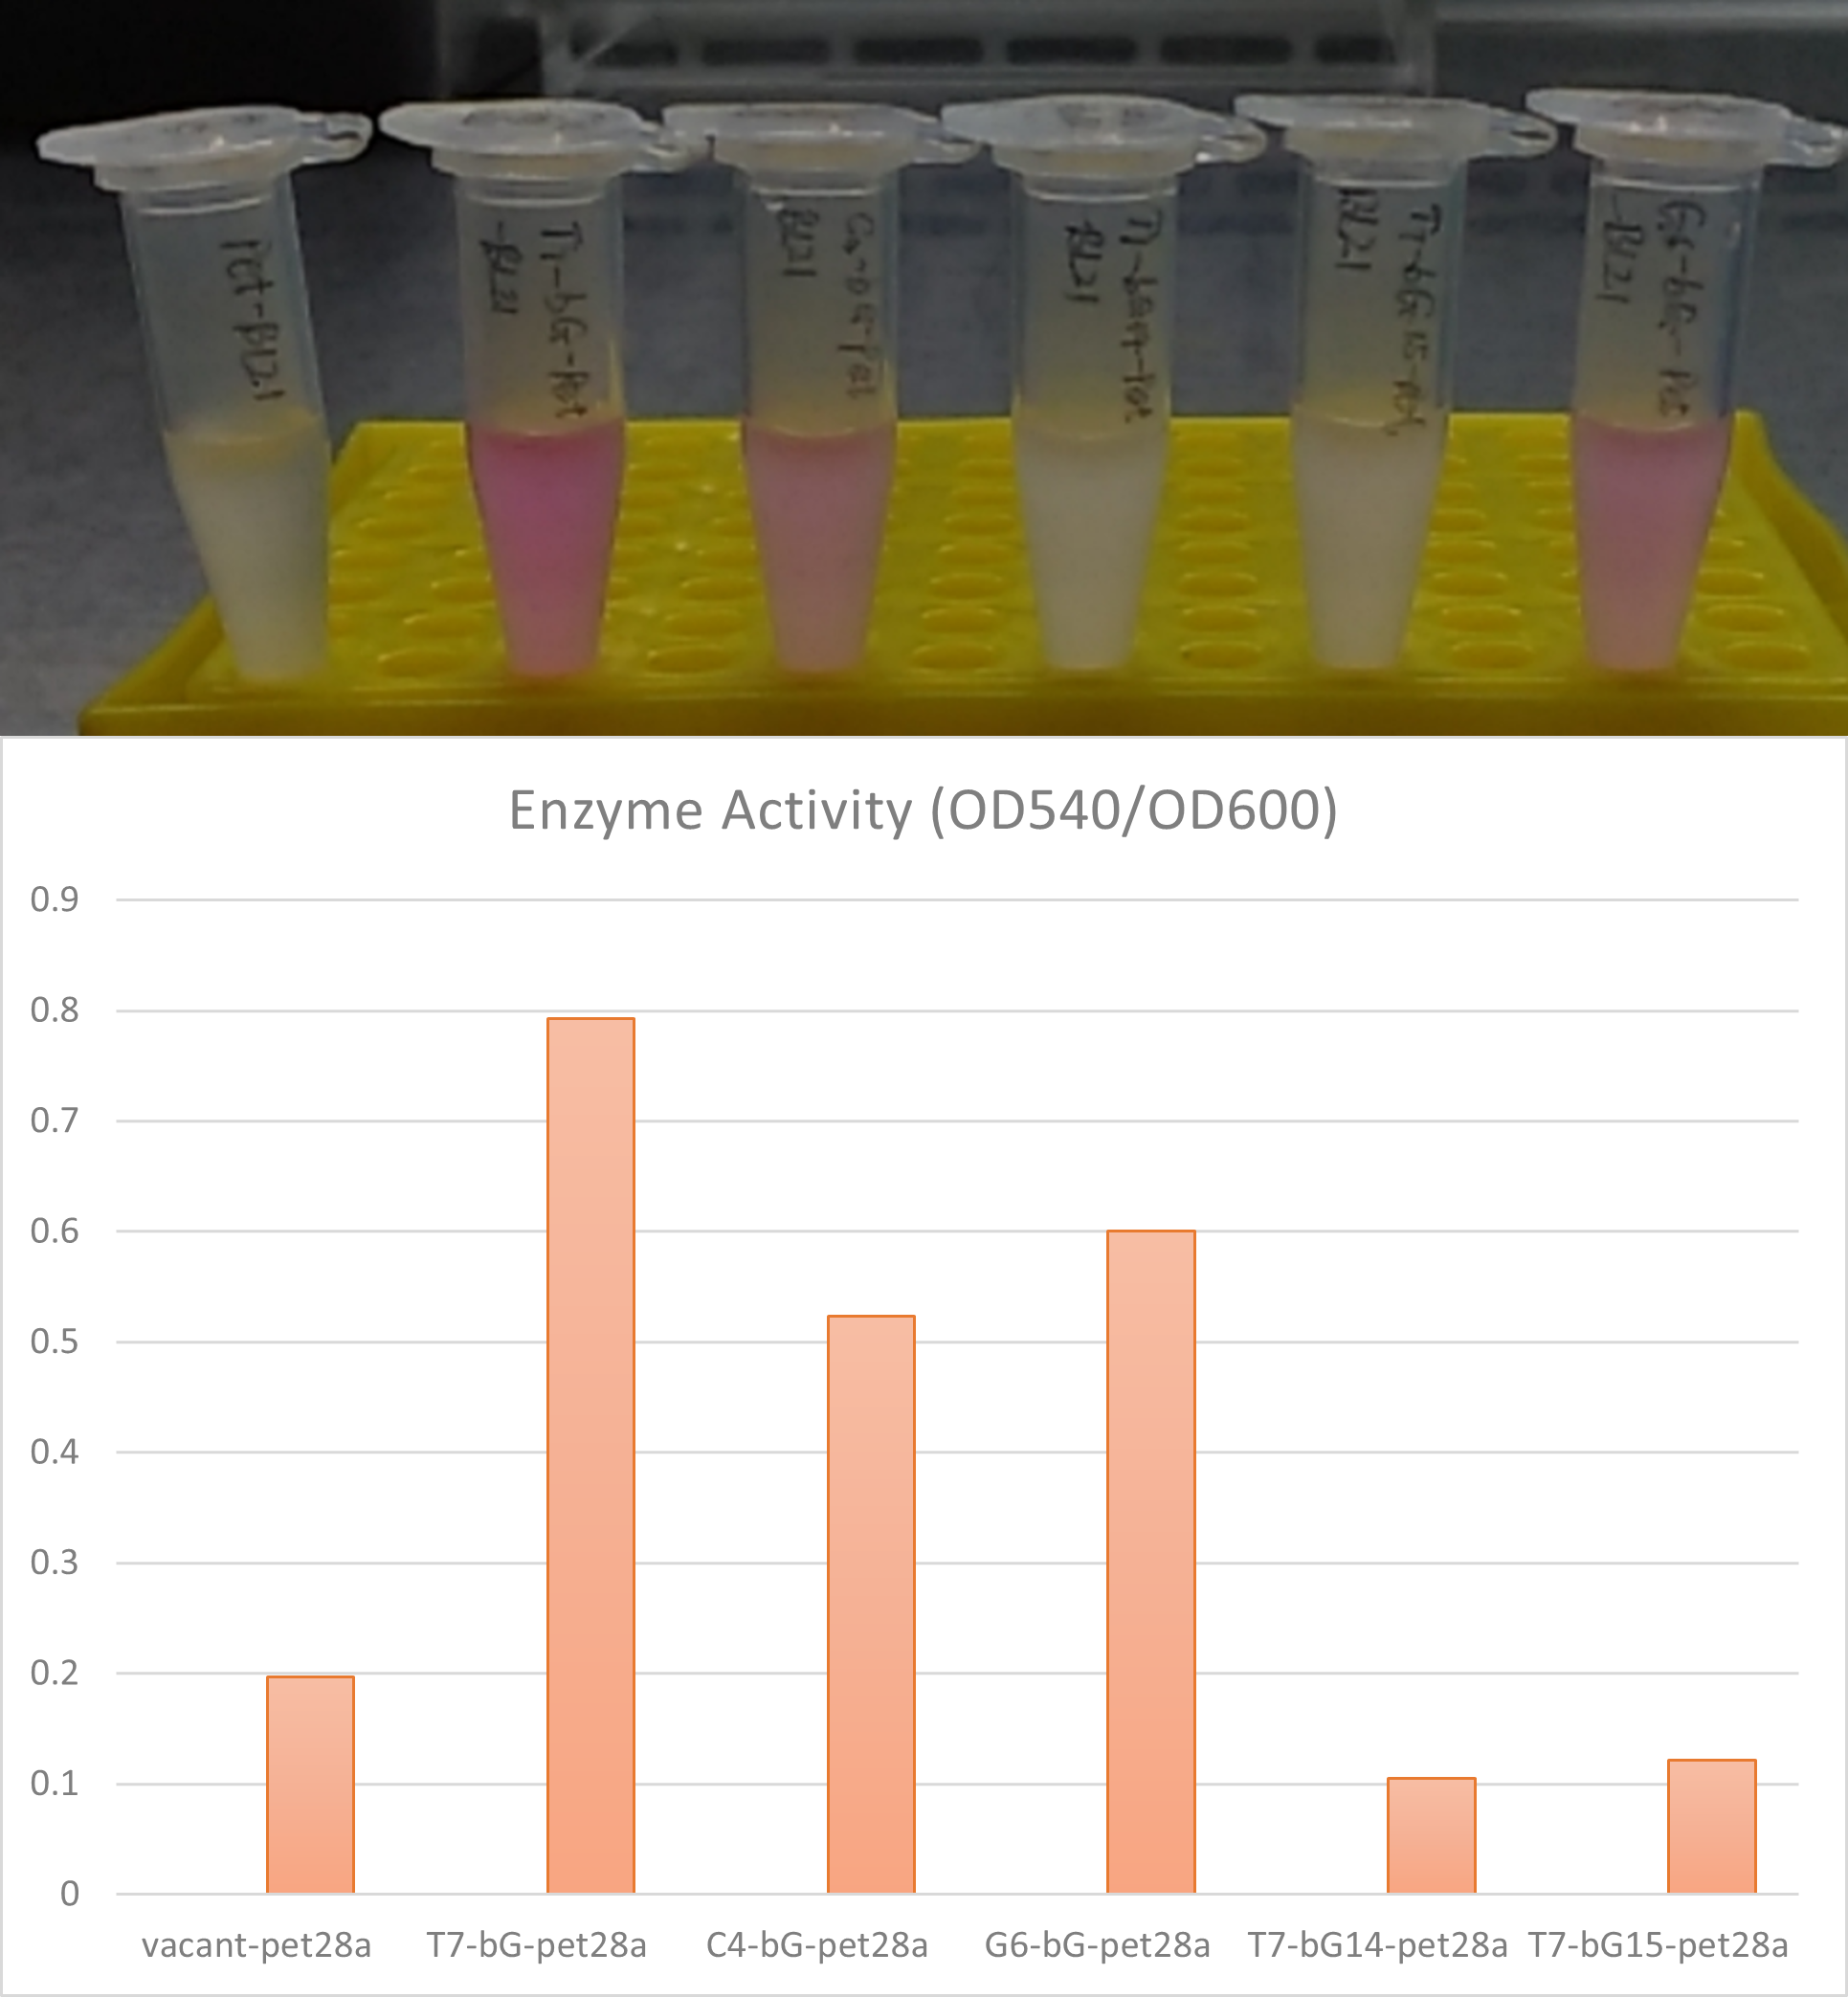
- Observe the solution. pink or purple color indicates positive enzyme activity. Quantitatively the activity can be measured by OD540 reading on a microplate reader, divided by its OD600 reading for normalization of concentration.
Results
We added the above-mentioned promoters to the upstream of the sfGFP gene, and determine the intensity of each promoter by measuring its green fluorescence.
We also put this C4 promoter in the upstream of the β-glucuronidase enzyme for expression of this enzyme in E. coli BL21(DE3). The expression was measured by the enzyme's activity.
Summary
The modified T7 promoter C4 K3716009 ( K3716009) has been proved to be able to initiate transcription of the downstream genes effectively, but the strengths is not consistently stronger than the consensus T7 promoter as reported in the literature works[1, 2]. We welcome further tests using this promoter under various conditions so a user could choose a promoter reasonably according to the needs of expression intensity and strength.
References
[1] Jones, J., Vernacchio, V., Lachance, D. et al. ePathOptimize: A Combinatorial Approach for Transcriptional Balancing of Metabolic Pathways. Sci Rep 5, 11301 (2015). https://doi.org/10.1038/srep11301
[2] Adams, A. M., Kaplan, N. A., Wei, Z. et al. In vivo production of psilocybin in E. coli. Metabolic Engineering, vol 56 p111-119, (2019). https://doi.org/10.1016/j.ymben.2019.09.009.
Sequence and Features
- 10COMPATIBLE WITH RFC[10]
- 12COMPATIBLE WITH RFC[12]
- 21COMPATIBLE WITH RFC[21]
- 23COMPATIBLE WITH RFC[23]
- 25COMPATIBLE WITH RFC[25]
- 1000COMPATIBLE WITH RFC[1000]
iGEM 2022 iBowu-China, new documentation (For Bronze)
Group: iBowu-China iGEM 2022
Author: Enshi Xv
This year, we also detected the promoters of T7 series.
We constructed the sequences of C4-GFP, T7-GFP and H9-GFP on pSB1C3 expression vector, and used different promoters to induce the expression of GFP gene. The effect of the promoter was detected by fluorescence intensity.
We first constructed and transformed the sequence into E. coli BL21(DE3) and induced the expression with IPTG for 18 h. After that, we could see that the bacterial solution presented different colors, and the bacterial precipitate also presented different colors after centrifugation.
According to our results, the effect of T7 promoter is similar to that of H9 promoter, but significantly better than that of C4 promoter, which is consistent with the experimental results from the previous team.
| None |


