
Part:BBa_K1022100
pBAD:AIP receiver:GFP:TT
This plasmid contains code for pBAD promoter, AIP receiver Agr A and Agr C, GFP along with double terminator.
Sequence and Features
- 10COMPATIBLE WITH RFC[10]
- 12INCOMPATIBLE WITH RFC[12]Illegal NheI site found at 125
- 21INCOMPATIBLE WITH RFC[21]Illegal BglII site found at 521
Illegal BamHI site found at 65
Illegal BamHI site found at 1405 - 23COMPATIBLE WITH RFC[23]
- 25COMPATIBLE WITH RFC[25]
- 1000INCOMPATIBLE WITH RFC[1000]Illegal BsaI.rc site found at 2970
Characterization
For more info, visit [http://2013.igem.org/Team:TU-Delft/Sensing Sensing AIP]on TU Delft iGEM13 Wiki
Sensor Experiment
Introduction:
In this sensor test-construct AgrC and AgrA are expressed, after which AgrC can act as a receptor for AIP. After binding AIP, AgrC will phosphorylate AgrA which then starts acting as a postitive transcription factor for pP2[1]. Therefore, upon induction by AIP, the construct will give a GFP signal. This is tested using the following experiment.
Experimental Set Up:
Cells are induced with 0.1 % Arabinose (to induce pBAD) and AIP’s, and with only AIP. Induction with AIP is done at 1µM and 10 µM. 3 hours after induction fluorescence-activated cell sorting (FACS) is used to check for GFP signals. The controls are BL21(DE3) cells, uninduced plasmid containing BL21(DE3) and a constitutively expressed GFP construct containing strain. The AIP used to induce the cells was synthesized by Eurogentec.
The cells induced with arabinose all died, which could be seen by the fact the signal given by the FACS, this could be due the fact AgrA and/or AgrC are toxic in high concentrations. The fact E. coli is still able to detect AIPs without induction of the Agr genes is explainable due the fact pBAD is a bit leaky, making low transcription possible, apparently only a small amount of activated AgrA is required to give a measurable level of GFP.
Earlier work on the detection of AIPs by Gram-negatives has been done, but with unclear or non-convincing results [2,3]. Often the outer-membrane of E. coli was seen as an obstacle for the implementation of auto-inducing peptide sensing systems in Gram negatives. Although, after intensive literature research we found a molecule very similar to the AIP molecule used in these experiments, that is known to pass the outer membrane. The molecule bacitracin has been shown to interfere with cell wall synthesis in Gram negative species, therefore being able to pass the outer membrane as cell wall synthesis occurs in the periplasm. Comparison of the molecular structures of bacitracin and AIP regarding size, molecular weight, polarity and charge gave us an indication AIP should be possible to pass through the outer membrane of E. coli.
Results:
Using Cyflogic 1.2.1 software [5], FACS data was analysed, showing a clear induction of the AIP receiver GFP construct by AIP. The difference between the blue and the red line (218) indicates the difference in fluorescent signal of uninduced and induced cells. Untransformed Bl21(DE3) and constitutively expressed GFP were used as respectively negative and positive control. The significant difference between the uninduced and the induced samples is determined with a P-value >10^-4.

Fluorescent signal measured with the FACS. The white line refers to the control BL21(DE3) cells. In blue the uninduced pBAD AIP receiver GFP is shown. The red line represents the AIP induced receiver cells. The fluorescence intensity scale is logarithmic and the total number of cells counted per sample is 10,000.
Discussion:
Taking the results described above into account, we are able to sense the presence of a Gram positive species with the use of E. coli transformed with our AIP receiver GFP construct. To our knowledge, we are the first to show the interspecies communication between Gram negative and Gram positive bacterial species. In this case the sensing of the AIP of S. aureus by E. coli. For the final application described in the [http://2013.igem.org/Team:TU-Delft/ProjectOverview TU Delft iGEM13 Wiki], the level of activation of the pP2 promoter by AgrA might be too low. In order to make the sensing system able to activate a peptide production system capable of producing a concentration high enough to kill or inhibit the growth of S. aureus, an amplification circuit could be used.
References
1. Philip Mdowell, Zina Affas, et al.,Structure, activity and evolution of the group I thiolactone peptide quorum-sensing system of Staphylococcus aureus, Molecular Microbiology, Volume 41, Issue 2, pages 503–512, Jul 2001.
2. http://2007.igem.org/wiki/index.php/Cambridge
3. http://2012.igem.org/Team:HIT-Harbin
4. T.J. Pollock, L. Thorne, Mechanism of bacitracin resistance in gram-negative bacteria that synthesize exopolysaccharides, J Bacteriol ; 176(20): 6229–6237, Oct 1994
5. Cyflogic 1.2.1., available on:http://www.cyflogic.com/.
University of Nebraska-Lincoln 2019
To characterize BBa_K3191101, cell cultures were grown alongside parts BBa_K1022100, BBa_K3191102, and BBa_K206000 cells. Cells were grown overnight and diluted to an OD of 0.05 in the morning with LB. The cultures were then allowed to grow to an OD 0D of 0.5. At this point, cells were washed with PBS and resuspended with 120 mM, pH 8.0 Tris-HCl. 30 mM EDTA and 10 mM of arabinose was then added to the cultures and the cells were incubated for 2 minutes. The cultures were then diluted with 2 mL of LB and antibiotics, and the cells were placed in a 37C shaker. Fluorescence was recorded every hour for three hours.
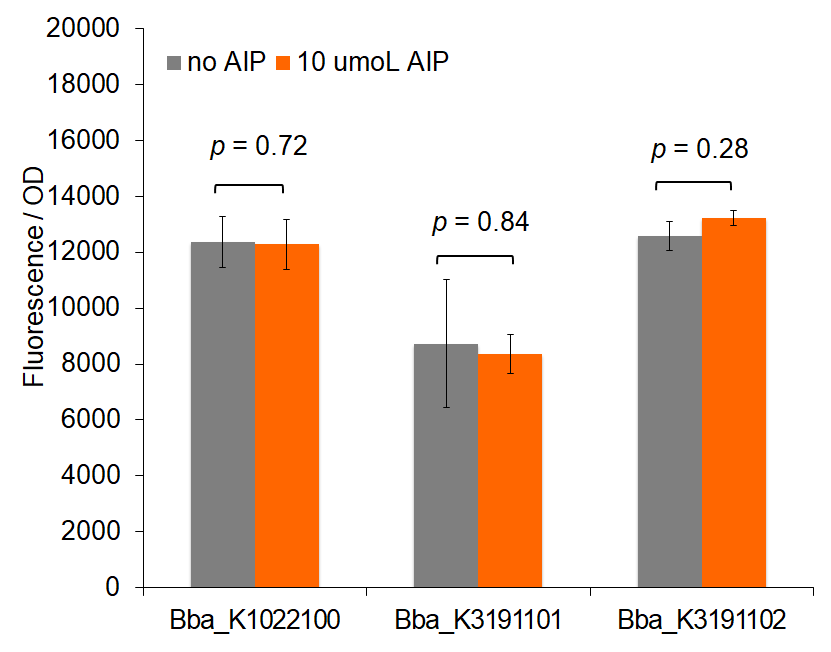
Figure 1: Total fluorescence of pre-permeabilized cells with and without AIP induction.
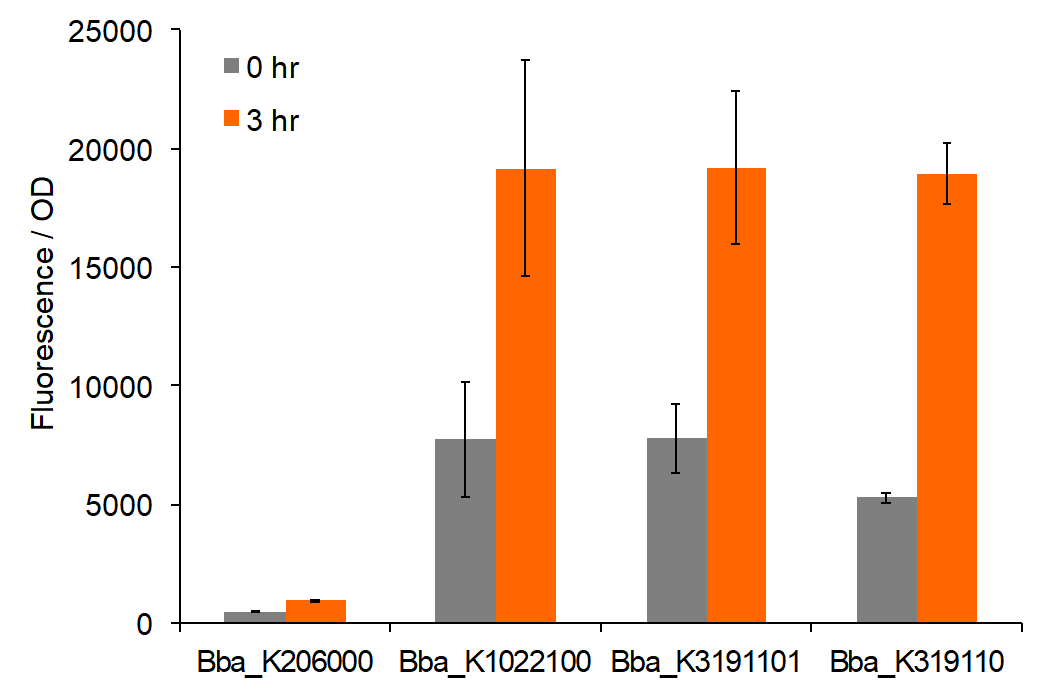
Figure 2: Total fluorescence of permeabilized cells at 0 and 3 hours post-induction with AIP.
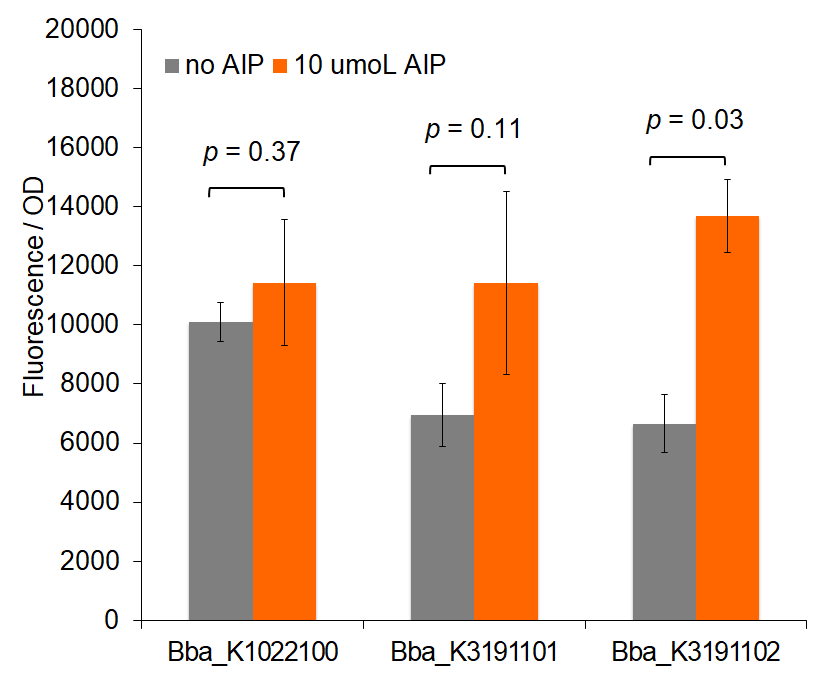
Figure 3: Total change in fluorescence of permeabilized cells with and without AIP induction.
Results
Our characterization data displays the difference in fluorescence values between BBa_K206000, BBa_K1022100, BBa_K3191101, and BBa_K3191102. This data was analyzed with a two-tail t-test of unequal variances with a significance level of 0.05 to draw conclusions of significance. Based on these values, fluorescence for BBa_K1022100 and BBa_K3191101 tend to exceed the control. This demonstrates that BBa_K1022100 and BBa_K3191101 both function properly.
Figure 1 demonstrates fluorescence values under the pre-permeabilization protocol. These data indicate that AIP induction caused minimal difference in fluorescence intensity. Figures 2 and 3 show fluorescence intensity and change in fluorescence, respectively, of cells after the permeabilization protocol. When comparing total fluorescence, BBa_K1022100 tends to yield significantly greater fluorescence values than BBa_K3191101 at hour 8, as supported by a p-values of 0.002 for the AIP trial. This suggests the modified sequences, while more complete, do not successfully increase GFP production under the original characterization procedures. The addition of SarA also does not appear to provide a significantly greater fluorescence under the influence of AIP. This is seen in a comparison of BBa_K3191101 and BBa_K3191102 at hour 3 in figure 4 (p-value = 0.902).
Trends in the data suggest that the introduction of AIP appears to have a greater effect on BBa_K3191101 and BBa_K3191102 than on BBa_K1022100 under the permeabilization characterization conditions. The fluorescence values for these conditions are seen in figures 2 and 3. In these conditions, a Tris-EDTA solution is used to attempt to increase AIP intake by the cells. BBa_K1022100 does not experience significantly greater fluorescence than the control at hour 3 with AIP induction (p-value = 0.111). In comparison, BBa_K3191101 and BBa_K3191102 have significantly greater fluorescence at hour 3 with AIP induction. This is demonstrated with p-values of 0.010 for BBa_K3191101 and 0.002 for BBa_K3191102. This suggests that AIP induction does not significantly increase fluorescence in BBa_K1022100, while it does increase in BBa_K3191101 and BBa_K3191102.
The increase in fluorescence may be explained by the modified experimental procedure. If the presence of Tris-EDTA successfully increases AIP uptake, then an increase in AIP uptake only improves fluorescence in BBa_K3191101 and BBa_K3191102. This suggests that our parts are truly induced by AIP, while BBa_K1022100 is not.
Contribution by Team IISER_Kolkata 2021
Group: iGEM21_IISER_Kolkata
Author: Debdeep Chatterjee, Shubhamay Das
//function/reporter/fluorescence
receiver
| biology | E.coli |
| emission | Green |
| excitation | |
| function | Senses the Auto inducing peptides and emits Green fluroscence |
| n/a | pBAD:AIP receiver:GFP:TT |
| tag | None |