Part:BBa_K1211001
Clostridum propionicum propionate CoA transferase
This is the DNA coding for the enzyme propionate CoA transferase from Clostridum propionicum. The enzyme normally catalyzes the reaction: acetyl-CoA + propanoate <--> acetate + propanoyl-CoA. This mutated sequence has four point mutations and one amino acid substitution (compared to the wild type enzyme) in order to produce (D)-Lactyl-CoA.
We used this enzyme as a the first enzyme in the pathway to create PLA or Polylactic acid. However, this biobrick produces (D)-Lactyl-CoA, which is the precursor to all PHAs, and thus this biobrick can be used in a wide range of projects in the future.
Data
Here is a gel showing our assembly of this gene. In order project we attached a promoter and terminator to the gene as well.


- Our project used this gene along with a Pseudomonas resinovorans PHA synthase gene to produce PLA. However, other teams can add other heterologous enzymes and produce different PHA. We tested the ability of our E. coli to produce PLA by using Nile red
- Nile red is an intercellular lipid strain
- Nile red does not affect the growth of bacteria, and its fluorescence is quenched in water
- We then proceeded to test our strain with out plasmid in the plate reader.
- Cells were grown for 24 hours with both enzymes induced and in the presence of Nile red. The cells were washed and re-suspended in PBS. The readings were normalized for optical density. Clearly, the one with our plasmid is more fluorescent indicating PLA production.

- After creating diversity using MAGE or Multiplex automated genome engineering, we needed a way to sort out those with the highest levels of fluorescence indicating greater PLA production. We decided to use FACS or FLuorescence activated cell sorting, to select those cells with the highest levels of fluorescence.
To read more about our project [http://2013.igem.org/Team:Yale/Project_Overview click here]

Team PuiChing Macau 2021: Optimization and Plastic Production
Validation of Bioplastic Production
In order to observe the conversion performance, infrared spectroscopic analysis was applied since PHA , PLA and PhaC have their particular functional group in chemical structure, and are performed in particular wavelengths. The absorption peak of PLA is at 1081, 1188, 1364, 1452 , 1751 cm-1[1], whereas the absorption peak 979, 1057, 1100, 1282, 1723, 2934, 2977cm-1[2]. We have compared and analyse the peak of the wavelength to confirm the bioplastic product we have produced. In Figure 2, no absorption peak of PHA and PLA was identified, which indicated that the vector (pETDuet Vector) cannot give the desired product. On the other hand, the absorption peaks of PHA and PhaC were identified after incubation, which suggested that the BBa_K3863004 and BBa_K3863008, the bioplastic performs significantly in the transformation process. Furthermore, the absorption peaks of PHA were found, which showed that BBa_K3863007 performs well and was the product that we expected to have. These results have proven that the bioplastic that we have produced can be formed significantly with BBa_K3863004, BBa_K3863008 and BBa_K3863007.

Figure 1a. IR spectrum of pETDuet vector

Figure 1b. IR spectrum of BBa_K3863004
Quantitative Measure of Bioplastic Production
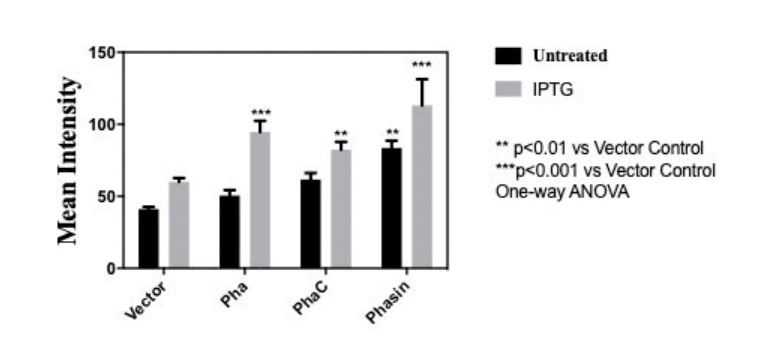
In order to measure the amount of bioplastic produced, we used 20 microgram Nile Red (sigma aldrich N3013) per milliliter of agar to make a Nile agar plate and streak the cell culture (PHA, PhaC, Phasin) on the plate. After incubating for 2 days at 37 celsius in darkness. Stereomicroscope (Nikon SMZ18) is used to measure the intensity of Nile red.

Mean intensity of Nile red for quantitative measure of bioplastic production of (BBa_K3863007(PHA), BBa_K3863004(PhaC), BBa_K3863008(Phasin))
Reference
[1]https://www.ncbi.nlm.nih.gov/pmc/articles/PMC3450024/pdf/12088_2009_Article_31.pdf
[2]https://www.researchgate.net/figure/Fourier-transform-infrared-FTIR-spectra-of-PLA-PEG-PLA-PEG-blend-and-PLA-PEG-xGnP_fig1_277675367
Sequence and Features
- 10COMPATIBLE WITH RFC[10]
- 12COMPATIBLE WITH RFC[12]
- 21COMPATIBLE WITH RFC[21]
- 23COMPATIBLE WITH RFC[23]
- 25COMPATIBLE WITH RFC[25]
- 1000COMPATIBLE WITH RFC[1000]
Contribution
- Group: iGEM Evry 2016
- Author: Toky RATOVOMANANA
- Summary: We codon optimize the part for Pseudomonas putida, which is a safe organism reported to be efficient for polymerization. The new biobrick BBa_K2042000, contain also a variant amino acid substitution (A243T) in order to produce (D)-Lactyl-CoA.
| None |


