Part:BBa_K1980012
pCopA MymT sfGFP with divergent CueR
This part is our chelator MymTsfGFP (BBa_K1980003)expressed from this copper-sensitive promoter pCopA with the regulator of pCopA (CueR) expressed divergent from the promotor.(BBa_K1980006)
Sequence and Features:
- 10COMPATIBLE WITH RFC[10]
- 12INCOMPATIBLE WITH RFC[12]Illegal NheI site found at 438
Illegal NheI site found at 461 - 21INCOMPATIBLE WITH RFC[21]Illegal XhoI site found at 1175
- 23COMPATIBLE WITH RFC[23]
- 25COMPATIBLE WITH RFC[25]
- 1000COMPATIBLE WITH RFC[1000]
Usage and Biology
E. coli cells use a protein called CueR to regulate the cytoplasmic copper concentration. CueR is a MerR-type regulator with an interesting mechanism of action whereby it can behave as a net activator or a net repressor under different copper concentrations through interaction with RNA polymerase(1). CueR forms dimers consisting of three functional domains (a DNA-binding, a dimerisation and a metal-binding domain). The DNA binding domains bind to DNA inverted repeats called CueR boxes with the sequence:
CCTTCCNNNNNNGGAAGG
This box is present at the promoter regions of the copper exporting ATPase CopA, some molybdenum cofactor synthesis genes and the periplasmic copper oxidase protein CueO.(2)
Experience
We cloned pCopA MymT sfGFP with divergent expressed CueR from a gBlock into the shipping plasmid pSB1C3. E. coli strain MG1655 was transformed using the specific recombinant plasmid and a 5ml culture of a transformed colony was grown overnight. The functionality of the construct was tested using plate reading, flow cytometry and microscopy
This is how the part is intended to work in vivo
Plate Reader
We tested the promoter with the fluorescent protein sfGFP (a form of GFP with excitation/emission maxima at 485-512nm and 520nm).
To account for the number of cells present at different copper concentrations and different times we measured the optical density (OD) as a proportional measure of the number of cells present.
A range of copper concentrations were prepared from stock solutions. A large volume plate was then prepared with 10μl of copper solution, 10μl of overnight culture and 980μl of broth with antibiotic. This resulted in a 1 in 100 dilution of the copper solutions prepared.
This large-volume plate was then centrifuged to mix the solutions and then 200μl transferred to a small-volume plate with a clear lid and then placed in the plate reader.
Four biological repeats of this part at ten different copper concentrations were measured as well as four repeats of a negative control (The NC part from the interlab study) and a positive control (The constitutive GFP, PC part from he Interlab study).
The plate reader measured the fluorescence and OD every ten minutes for at least 12 hours, shaking between measurements.
Flow cytometry
Flow cytometry is a technique whereby cells are passed individually into the path of a beam of light. The frequency range of incident light can be adjusted to allow excitation of specific fluorophores in the sample of cells. Downstream detectors can measure fluorescent emission, and this data can be used to quantify the amount of fluorophore in each cell.
To ensure comparability of experiments, all cells were grown for 3-4hrs (until entrance into the exponential growth phase) at 37°C and 225rpm shaking in the presence of the inducer before measurement. This allowed adequate time for activation of expression by the promotor systems. The negative control used in all cases were MG1655 bacteria containing an empty shipping plasmid. As these did not contain any fluorescent molecules, this population could be used to set the negative “gate” (i.e. the background fluorescence of the bacterial cells). Although the experiments were tedious as every sample had to be measured manually, the results were of remarkably high quality, were clearly interpretable, and fit very well with the other experimental data.
Microscopy
Microscopy was done in order to visually confirm the plate reader and flow cytometer experiments.
The experiment started with 5ml overnight cultures containing the appropriate antibiotic. Then in the morning 100μl of each colony was pipetted into 5ml of fresh LB with antibiotic and a range of copper concentrations and grown till the OD reached 0.4-0.6.
A flask of 1% agarose made with MilliQ was melted. 200μl of this was placed on a slide between two coverslips, flattened to get a nice smooth surface where the bacteria are immobile. 20μl of the culture are then added. The slide was then be viewed under a fluorescence microscope.
After finding the correct focal plane the slide was moved to find as many cells as possible to image. After focusing again an image of the DIC and fluorescence channels was obtained.
Copper Chelation
This part contains the subpart MymTsfGFP (K1980003) which we tested separately. We cloned MymTsfGFP from Gblock into the shipping vector then transferred it into the pBAD, arabinose-inducible commercial expression vector.
We were unable however to detect copper chelation activity of MymTsfGFP when expressed from pBAD in MG1655 E. coli strain, using a BCS absorbance assay. Modelling by our team suggested that this was because insufficient protein could be expressed to chelate the amount needed to be detectable on the assay ( 2μM detection limit).
We purified this a version of this part with a C-terminal His tagged-sfGFP, but were still unable to detect copper chelation with the assay in our purified extracts.
FLIM
We discovered a paper by Hötzer et al(3) that described how His-tagged GFP can be quenched by a copper ion binding to this His tag leading to a reduction in the fluorescence lifetime (the time the fluorophore spends in the excited state before returning to the ground state by emitting a photon.) They speculated that this could potentially be used as a in vivo copper assay.

As we had His-tagged our chelator-sfGFP constructs we were curious to see if this technique could be applied to our parts to measure copper chelation in vivo by our parts. We believe that two possibilities were likely:
- Copper chelation by the chelator reduces the free copper concentration inside the cell meaning that less binds to the His tag and the fluorescence lifetime will be greater than a His-tagged sfGFP control
- Copper chelation by the chelator would allow additional quenching if copper was bound within the quenching radius of the fluorophore leading to a reduction in fluorescence lifetime compare with a sfGFP control
Lacking access to a fluorescence lifetime microscope ourselves we contacted Cardiff iGEM who had a FLIM machine in their bioimaging unit. They very kindly agreed to run a few samples for us taking up over five hours of microscope time.
We sent Cardiff iGEM our parts MymTsfGFP in pBAD and pCopA CueR sfGFP (as a control) in live MG1655 E. coli in agar tubes. Cardiff grew them overnight in 5ml of LB with 5uM copper with and without 2mM arabinose.
The imaging unit spread each strain on slides and measured the fluorescence lifetime of three areas on each slide.
(Acquisition parameters: using the x63 water immersion objective with excitation at 483nm (71% intensity, pulse rate 40MHz) and emission via a BP500-550 filter. Scan resolution at 512 x 512 pixels at pixel size of 0.26 microns/pixel, 1AU pinhole. Counts of >1000 per lifetime recording.)
FLIM images from one section of each slide:

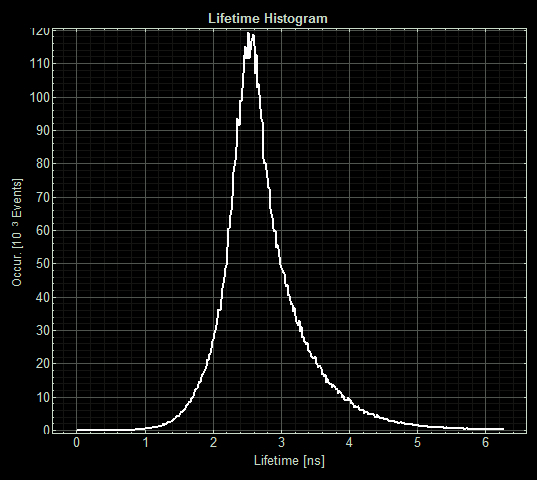
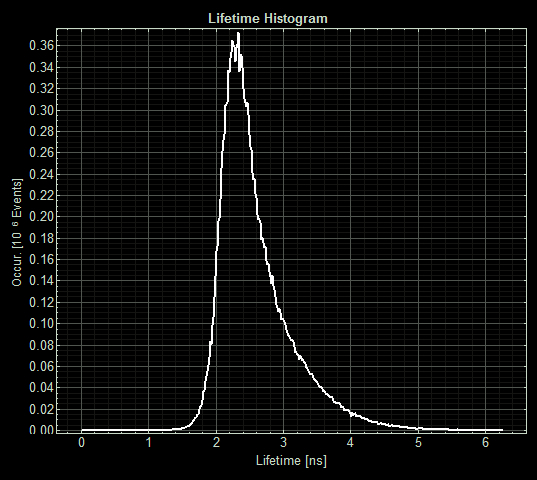
As expected the pCopA CueR sfGFP control was fluorescent, with and without arabinose, with the mean fluorescence lifetime a consistent 2.6ns.
When MymTsfGFP was induced the mean lifetime decreased to 2.3ns. As MymTsfGFP is was observed to be reliably expressed and because MymT is a small copper cluster separated form sfGFP by a small linker we believe that this represents additional quenching of the fluorphore by MymT-bound copper showing in vivo copper chelation.
References
(1) Danya J. Martell, Chandra P. Joshi, Ahmed Gaballa, Ace George Santiago, Tai-Yen Chen, Won Jung, John D. Helmann, and Peng Chen (2015) “Metalloregulator CueR biases RNA polymerase’s kinetic sampling of dead-end or open complex to repress or activate transcription” Proc Natl Acad Sci U S A. 2015 Nov 3; 112(44): 13467–13472
(2) Yamamoto K, Ishihama A. (2005) “Transcriptional response of Escherichia coli to external copper.” Mol Microbiol. 2005 Apr;56(1):215-27
(3) Hötzer B., Ivanov R., Altmeier S., Kappl R., Jung G., (2011) "Determination of copper(II) ion concentration by lifetime measurements of green fluorescent protein." Journal of Fluorescence, 21(6), pp. 2143-2153. doi: 10.1007/s10895-011-0916-1
Author: Andreas Hadjicharalambous
//cds/reporter/gfp
//cds/transcriptionalregulator
//function/reporter/fluorescence
//function/sensor/metal
//promoter
| None |


