Part:BBa_K1355004:Experience
Experiments and Results
The experiment for Hg bioremediation was made according to the protocol “Cell growth quantification of mercury resistant Escherichia coli DH5α at differents Hg concentrations by Optical Density”. DH5-alpha transformed with BBa_K1355004 was inoculated in LM (LB with low concentration of NaCl) liquid medium with 0.05μg/ml of mercury chloride and 34μg/ml of chloramphenicol. The inoculum was incubated in shaker overnight at 37°C. After cell growth, we measured Optical Density (O.D.) of the cell culture in spectrophotometer at 600 nm wavelength. A standard quantity aliquot of bacterial suspension was taken in six falcons (50ml) with 10 ml of LM liquid medium and then added mercury chloride in order to achieve the concentrations: 0μg/ml, 1 μg/ml; 2.5 μg/ml; 5 μg/ml; 10μg/ml; 20 μg/ml. The samples were incubated at 37°C on shaker. We collected each sample at the given times, 1 (02:30 hours of incubation), time 2 (04:30 hours of incubation), time 3 (06:30 hours of incubation), time 4 (17 hours of incubation), time 5 (24 hours of incubation) to measure O.D. on spectrophotometer. As control, we used DH5-alpha transformed with BBa_K1355002 (Hg bio detector device) which does not present coding regions for the mercuric ion reductase. We also measured Optical Density of each sample. After cell growth measurement, the samples were frozen to subsequently quantification of Hg remediated by the Mercury Bacter.
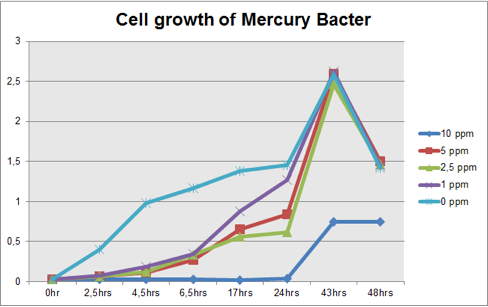
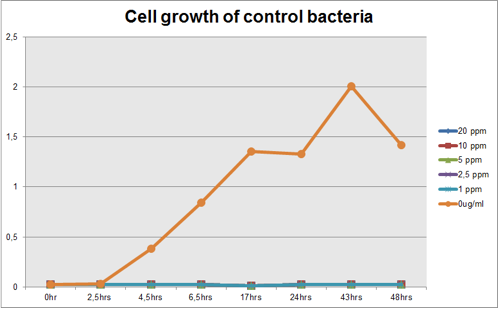
The graph represented on Figure 1 and Figure 2 shows Cell growth of Mercury Bacter and of the control bacteria in different Hg concentrations in function of time, respectively;
Figure 1: Cell growth of Mercury Bacter in different Hg concentrations in function of time;
Figure 2: Cell growth of control bacteria in different Hg concentrations in function of time
Comparing the graphs shown on figure 1 and 2, it can be observed that the biobrick BBa_K135504 provided resistance to high Hg concentrations. Control bacteria did not present resistance to Hg concentration equal or higher to 1 ppm. On the contrary, Mercury Bacter grew up even in 10 ppm Hg concentrations. Interestingly, at the concentration of 10 ppm Mercury Bacter needed 24 hours to exhibit increase in cell growth, and after 48 hours it maintained the same OD, unlike the others. At 1 ppm, 2.5 ppm and 5 ppm Mercury Bacter performed an overwhelming cellular growth after 24 hours of exposure to Hg, reaching approximately the same cellular growth as the non-exposed bacteria!!
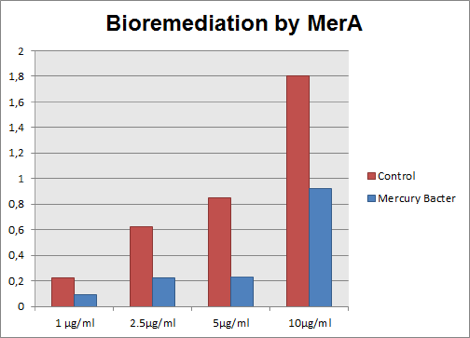
The graph represented on Figure 3 compares Hg concentration in LM medium after 48 hours of experiment, between medium with bacteria used as control and engineered Mercury Bacter.
Figure 3: Hg concentration in LM medium after 48 hours of cell growth in control bacteria and in the genetically engineered Mercury Bacter.
In the graph above it can be observed that our super Mercury Bacter bioremediated! In action, Mercury Bacter reduced 72% of the mercury levels, in comparison to control at the sample 5 ppm! In 1 ppm, Even though on 10 ppm concentration, where bacteria had a slow growth rate only after 24 hours, it bioremediated 48.02%! These results demonstrate our constructions’ efficiency, both for biobrick BBa_K1355001 as a promoter regulated by MerR protein and to BBa_K1355000 as MerA encoding gene!
User Reviews
UNIQ7ddf825ba4d9f36a-partinfo-00000000-QINU UNIQ7ddf825ba4d9f36a-partinfo-00000001-QINU


