Part:BBa_I0500:Experience
This experience page is provided so that any user may enter their experience using this part.
Please enter
how you used this part and how it worked out.
Applications of BBa_I0500
- When grown with 0.2% arabinose, promoter is weak-medium. [jb, 5/24/04] Part may not be compatible with MC4100 as cell line is araD 139.
- MC4100 is not a good chassis for operating BBa_I0500 (pBad promoter). The feed-forward regulation of the endogenous promoter controlling expression of the arabinose transporter prevents linear induction with increasing arabinose concentration. (Engineered strain from Keasling's lab, used by jrk for operation of the screening plasmid.) [cconboy 04]
- Observations of induced expression of GFP (BBa_E0840) are consistent with previous comments about weak promoter signal induction by jb 5/24/04. [melissali, Berkeley iGEM 2005]
PC and AraC are located on the complementary strand, reading right to left as written.
- At least one registry stock contains a deletion of the C at base 1194. This is after the transcriptional start but before the translation start, so it may not be significant. Parts with this mutation have been qualitatively observed to function normally.
- Can with success be combined with a promoter from pBAD SPL to obtain a very low leakiness and an appropriate strength. This is very efficient for expressing lethal proteins.
User Reviews
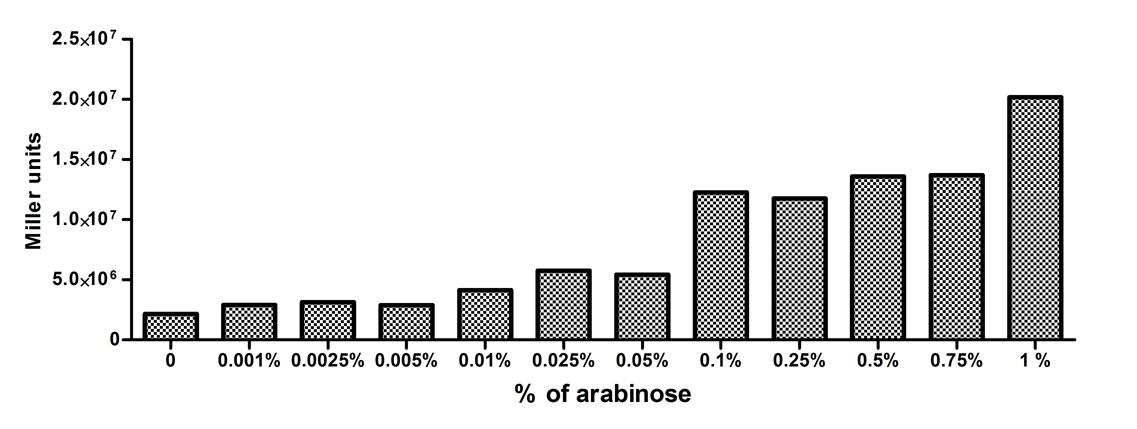
[http://2010.igem.org/Team:Slovenia 2010 iGEM team Slovenia] further characterized the pBAD/araC promoter (Part:Bba_I0500) using lacZ gene that encodes for beta-galactosidaze enzyme (Part:Bba_K323133). pBAD promoter is an arabinose inducible promoter. When incubating E.coli cultures containing the lacZ under pBAD/araC promoter, increasing concentrations of arabinose leads to higer promoter activity that results in higher amounts and subsequently higer activity of beta-galactosidase enzyme as seen from figure below. The resulting graph shows a trend of increasing beta-galactosidase activity over increasing concentrations of arabinose.
The tested cultures incubated at different concentrations of arabinose (i.e. 0%, 0.001%, 0.0025%, 0.005%, 0.01%, 0.025%, 0.05%, 0.1%, 0.25%, 0.5%, 0.75% and 1%) have shown a trend of increasing beta-galactosidase activity with raising arabinose concentration. The activity was highest at 1% added arabinose, which implies the promotor should be induced by this arabinose concentration for reaching maximum expression of the regulated protein. However, some beta-galactosidase activity was observed even at 0% added arabinose, which indicates slight leakage of the pBAD promoter.
pBAD/araC_lacZ_DTER construct (Part:Bba_K323133) includes a beta-galactosidase (lacZ) gene, the expression of which is regulated by the pBAD promoter (Part:Bba_I0500). This construct was designed for the sole purpose of characterising the pBAD promoter with the beta-galactosidase assay (for a detailed description of the method see the 2010 iGEM team Slovenia wiki).
UNIQ3d677e7e65b550d9-partinfo-00000000-QINU
|
•••••
Antiquity |
This review comes from the old result system and indicates that this part worked in some test. |
|
[http://2012.igem.org/Team:UNITN-Trento Trento 2012] |
We were unable to extract this part from the distribution kit, so we developed our own! Please head to BBa_K731201 for documentation and characterization. |
|
iGEM Groningen 2009 |
The sequence was listed as inconsistent, and the ligations of parts behind the promoter failed. Restriction of isolated plasmids showed fragments of unexpected sizes. |
|
•••••
[http://2011.igem.org/Team:Groningen 2011 iGEM team Groningen] |
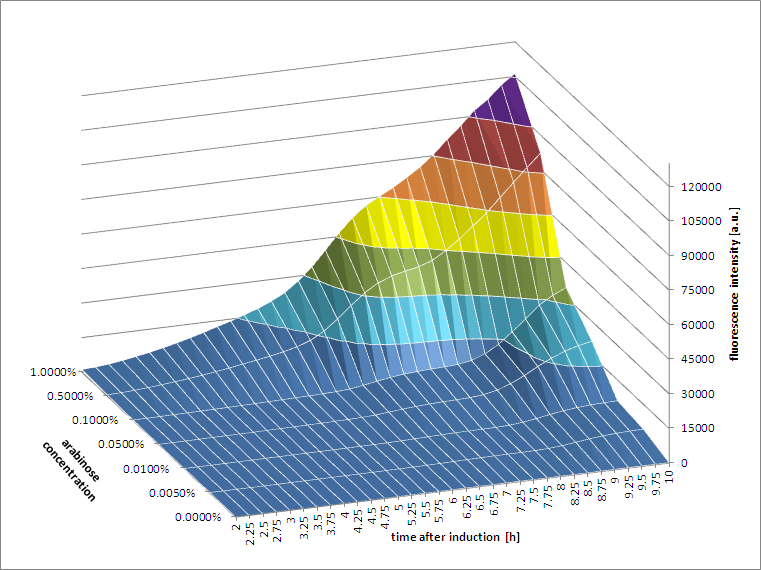
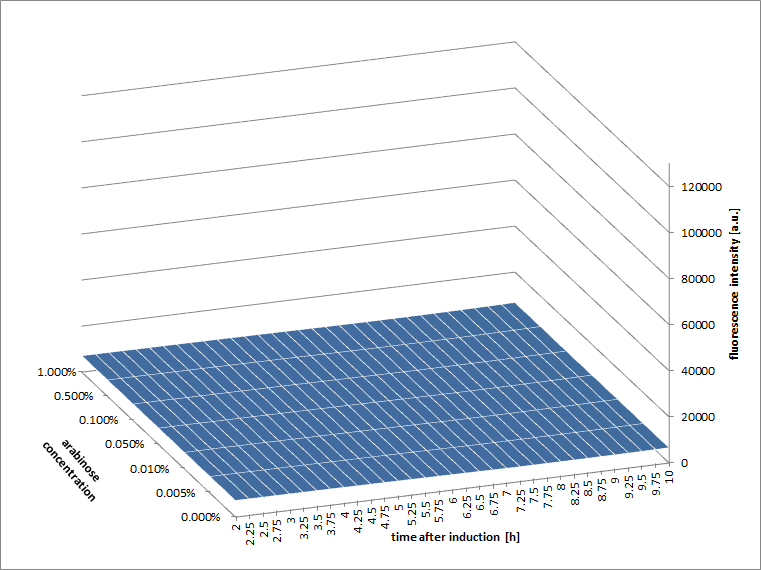
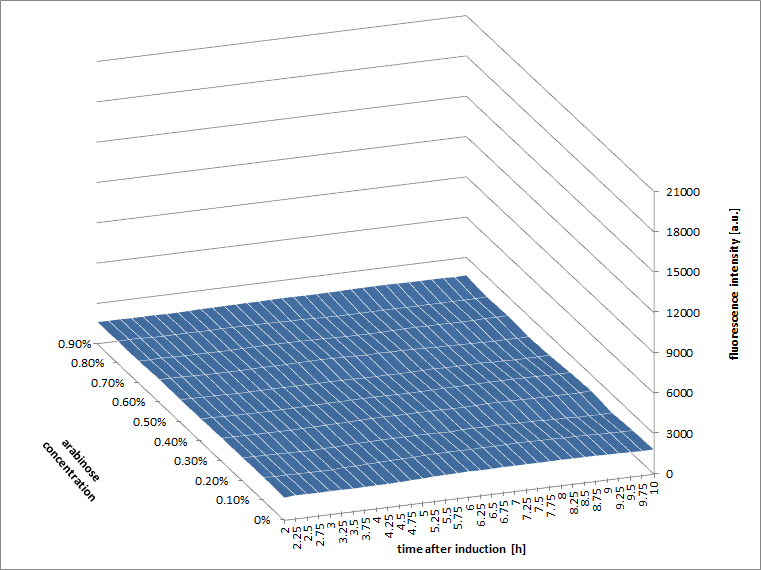
[http://2011.igem.org/Team:Groningen 2011 iGEM team Groningen] characterized the pBAD/AraC promoter (Part:Bba_I0500) even further using GFP and measuring the fluorescence in a fluorimeter over time, utilizing different arabinose concentrations to induce the promoter. After analysis of the obtained data (see graphs below), it is clear that the induction is faster and stronger with higher arabinose concentrations. It shows a dynamic response over a range of arabinose concentrations and over time. Because of that it can be treated as a precise tool capable of giving different output levels. The measurements were done in DH5alpha strain carrying a pSB1C3 with BBa_K607036 in triplicate.
|
|
•••••
[http://2011.igem.org/Team:Cambridge Cambridge 2011] |
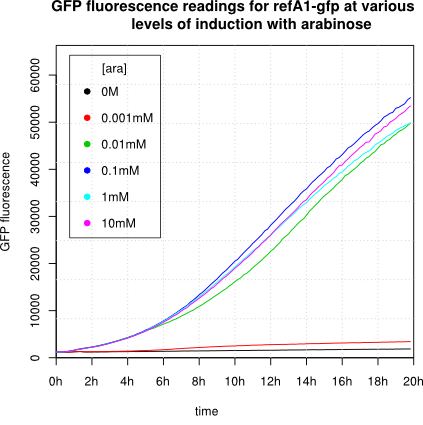
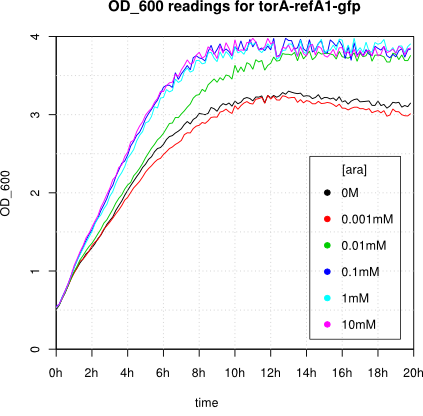
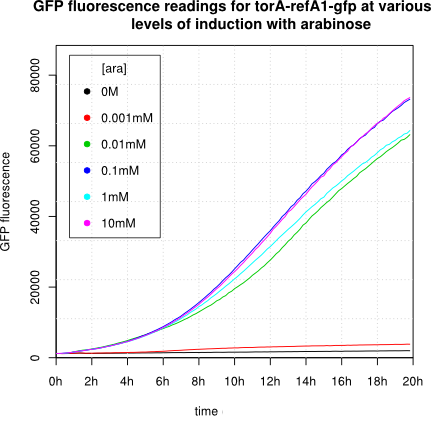
We observed an 'all-or-nothing' response in our use of the pBAD promoter. We grew up cells of the strain [http://cgsc.biology.yale.edu/Strain.php?ID=111773 BW27783] overnight at 37°C. We then diluted the culture 10-fold and grew the cells back up to an OD_600 of 0.5 to catch the cells in mid-exponential phase. We then induced with arabinose at various concentrations from 0.001mM up to 10mM and took OD and GFP readings on a plate reader over the next 20 hours. During this time the cells were held at 37°rees;C. The cells contained our ReflectinA1-sfGFP and TorA-ReflectinA1-sfGFP constructs on pSB3K3 plasmids. This work was not intended to characterise the pBAD promoter, but it highlights some of the difficulties in doing so:
Note: 1mM arabinose corresponds to 0.015% w/v.
|
|
••••
[http://2014.igem.org/Team: Hong_Kong_HKUST 2014] |
Introduction Cambridge 2011, in the experience page, mentions that “the response to arabinose is highly variable between different strains of E. coli”. We wanted to see whether this was really the case. Out of many different responses, we focused on the PBAD promoter strength across different arabinose concentrations. The three strains that have chosen was: DH10B, BW25113, and DH5α. We thought that calculating the Relative Fluorescence Unit (RPU) defined by Endy et al. would be a better a measure of promoter strength at different arabinose concentration than simply comparing the fluorescence measurements of different strains. In brief, RPU was calculated by dividing fluorescence of cells with pSB3K3-BBa_I0500-BBa_E0240 and that of cells (of the same cell strain) with pSB3K3-BBa_I20260 (Measurement Kit Test of J23101). Please refer to the Endy et. al’s paper for more information on RPU. Results The lower RPU of DH5α was expected because DH5α has araC gene, gene for the repressor, in its genome. This could have caused the lower promoter strength of PBAD¬ in DH5α. For DH10B and BW25113 we see a very clear “all-or-none” response. The RPU reaches a plateau at 0.2% of arabinose. For DH5α, it is less obvious, because the initial increase of RPU at 0.2% arabinose is around 0.1, lower than the other two strains. With the given graph, statically, we cannot say that the RPU level gradually increases as % arabinose increases. All in all, all three strains produced all-or-none response. Discussion We believe that it is actually difficult to analyze the promoter’s gradual or all-or-none response looking the 3-dimensional graph that Groningen 2011 team presented. The 3 dimensional graph has three parameters: time, various arabinose concentrations and fluorescence. The graph does not consider the OD600 value which can represent the concentration of cells. If the growth rate of the cells are different in different arabinose concentration, the final concentration of cells at given point of time can vary. Because the fluorimetry measurements, the method that Groningen 2011 used, measures the fluorescence of the entire population of cells, the fluorescence can be affected by the concentration of cells and hence show a response that is not all-or-none. Looking at Groningen’s results, it would be more appropriate to say that the population of cells that is transformed with plasmid containing BBa_K607036 (BBa_I0500-BBaE0840) show a gradual response to increasing arabinose concentration. The effect of cell growth rate of a population cells on the PBAD, however, is another story and therefore further study is required for more accurate conclusion. Method For each cell strains, we first transformed with three different plasmids: pSB3K3-BBa_E0240, pSB3K3-BBa_I20260, and pSB3K3-BBa_I0500-BBa_E0240. We grew the cells overnight in various arabinose concentrations (%w/v) from 0% to 1.0% with 0.2% increments. The cells were diluted the next around 10 fold and grown again until they reached mid-log phase (OD600 0.4-0.5). Cells were fixed and fluorescence was measured using FACS. RPU was calculated first subtracting the autofluorescence (fluorescence of cells with pSB3K3-BBa_E0240, and dividing the fluorescence of cells containing pSB3K3-BBa_I0500-BBa_E0240 with cells containing pSB3K3-BBa_I20260. We observed clearly a different promoter response between other two cell types and DH5α. The graph of DH10B and BW25113 overlapped and therefore t-test was conducted to statistically identify the significance difference. The P-value was 0.1207. So if we use the 0.05 confidence level, we cannot statistically prove that the two curves are different.

|
UNIQ3d677e7e65b550d9-partinfo-00000009-QINU

 1 Registry Star