
Part:BBa_K1028002
A cell membrane stress reporter gene
Introduction
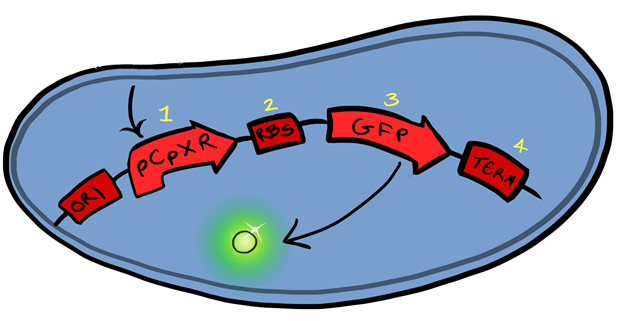
Fig.1:
The CpxR promoter is activated via adhesion of the cellular membrane to hydrophobic surfaces, with GFP downstream of the promoter the gene functions to produce a visible and quantitive signal upon surface binding.
Experimental Data
Investigation of literature regarding the action and regulation of the Cpx pathway lead to the discovery that the system as a whole responds to a large variety of membrane stresses, something that could be true of the specific promoter we chose to use (pCpxR).
As a result of this we deemed it necessary to investigate the response of our promoter to each individual membrane stress.
http://i276.photobucket.com/albums/kk29/JosephBeetBeet/BS1CharacterisationBars.png
Individually many of the experiments produced erratic and seemingly random data which is listed independently below. However plotting all average readings together shows that there is a dramatic increase in response to the stress induced by the silica beads comparative to all the chemically induced membrane stresses we used.
This indicates that it would be possible to detect the presence of silica beads in solution, in principle, using our binding and detection system, certainly when silica beads are present at relatively high concentrations. However further work needs to be done to assess whether this high response remains across a range of silica bead concentrations in solution.
In light of these results, some of these experiments were repeated for more accurate results. How the Cpx pathway reacts to temperature is already well characterised in the literature and by the [http://2010.igem.org/Team:Calgary/Parts/Characterization Calgary 2010 iGem team.]
The Ethanol gradient, Triton X-100 gradient and pH gradient were all repeated. In the second experiment, a robotic pipette was used to directly fill the 96 well plate to reduce human error. Excluding wells with imposed pH gradient, all wells were kept at pH 7 using Tris.HCl buffer, the pH gradient was also achieved with a Tris.HCl buffer.
The 96 well plates were then incubated while shaking while shaking for 2 hours at 37 degrees to allow time for GFP to mature. A longer incubation time was introduced to give more conclusive results. </p>
Triton X-100
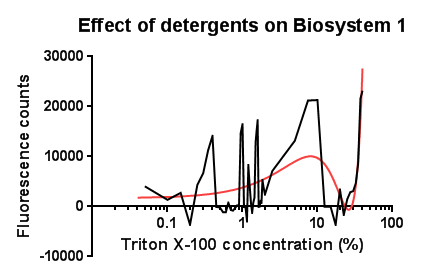
Fig.1: Testing the effect of the detergent Triton X-100 on the CpxR promoter
Between the concentration values of 0.1-9% triton X-100 the data shows roughly the relationship that was expected, a rise in GFP production as the triton concentration increases. This is likely due to triton acting as a detergent resulting in damage to the plasma membrane of cells, activating the Cpx pathway in general, including the cpxR promoter. Past 10% Triton X-100 concentration it is assumed that cells are dying in large quantities, being unable to produce GFP at all or in very limited amounts before they are killed. This explains the corrected fluorescence readings reducing to below zero. The reason for the large spike in fluorescence at Triton concentrations >20% is unclear, a possibly explanation for this is the total lysis of the cell, expelling all cellular components resulting in background GFP levels having a larger fluorescence reading due to reduced scattering from within the cell
pH Effects
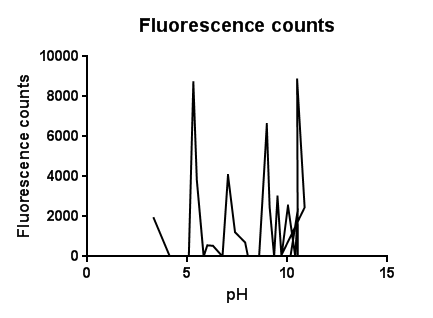
Fig.3: The effects of a range of pH values on the activation of the CpxR promoter
The slight fluctuations across the pH scale are in line with the background fluorescence readings from our cell cultures, representing the standard levels of cpx activation as the cells collide, disperse in solution and divide during replication.
The higher levels of expression at both low and high pH are likely to be due to the pH extremes denaturing proteins and disrupting interactions within the plasma membrane. It could be assumed that pH’s further into the extremes of acid and base would completely lyse and kill the cells resulting in a possibly lower fluorescence.
Ethanol
http://i276.photobucket.com/albums/kk29/JosephBeetBeet/ethanolbs1graph.png
In this test a large, seemingly anomalous spike in an initial experiment was re-tested with smaller increasing increments of ethanol. The results are somewhat erratic but the peak just before 3% ethanol can be seen, before the fluorescence reading goes on to trough again.</p>
Atomic Force Microscopy

Fig.1: An image gained from Atomic Force Microscopy Experiments showing expression cells containing the pCpxR promoter coupled with GFP coding region.
Sequence and Features
- 10COMPATIBLE WITH RFC[10]
- 12COMPATIBLE WITH RFC[12]
- 21COMPATIBLE WITH RFC[21]
- 23COMPATIBLE WITH RFC[23]
- 25COMPATIBLE WITH RFC[25]
- 1000INCOMPATIBLE WITH RFC[1000]Illegal BsaI.rc site found at 728
| None |