Part:BBa_J33204:Experience
This experience page is provided so that any user may enter their experience using this part.
Please enter
how you used this part and how it worked out.
Applications of BBa_K316003
- The enzymatic reaction catalysed by C2,3O is an ideal output signal for our engineered bacterial detector and it can also serve as a very useful reporter gene.
- Catechol, the substrate of C2,3O, is colourless. However within seconds of its addition, the colonies/liquid cultures of XylE-expressing cells become yellow, indicating production of a product which absorbs light in the visible spectrum
User Reviews
UNIQb914486f9d119a28-partinfo-00000000-QINU
|
•••••
Imperial College iGEM 2010 |
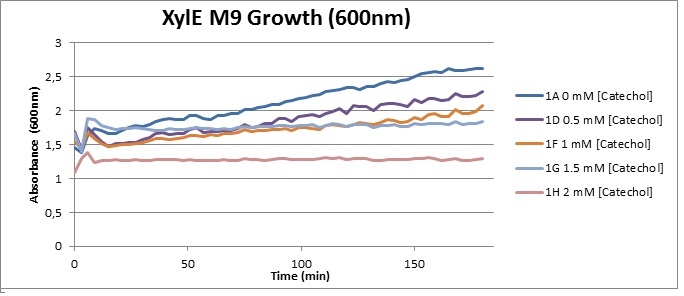
(LB) The addition of catechol had distinctive effects on the XylE expressing cells growing in LB medium. While at 0% catechol growth-behavior did not show a significant change (dark blue), even the lowest concentration of 0.25% catechol appeared to drastically reduce cell-survival (red). In contrast, CMR-control cells did not change their growing behavior in the presence of catechol. From this we conclude that in LB medium, the breakdown product of catechol, 2-hydroxymuconic semialdehyde, has a lethal effect on E. coli. (M9) Cells growing in M9 medium appeared more resistant to the effects of catechol. Even though absorbance at 380 nm increased significantly in well containing XylE expressing cells, indicating strong turnover of Catechol by C2,3O (4), Catechol did not appear to influence growing behavior in generalizable fashion: while a significant increase in the variance in the sample could be determined. Such was not observed for CMR expressing cells exposed to the same conditions. However, we were not able to establish a clear trend of growing-behavior in the presence of catechol as in case of the LB – XylE samples.
|
|
•••••
Calgary iGEM 2012 |
This part was constructed with a constitutive TetR promoter generating a new part (BBa_K902048) which could be used in media contining glucose, as the availalble construct in the registry has a glucose repressible promoter (BBa_K118021). Visual assays were performed with E. coli cells transformed with (phttps://parts.igem.org/Part:BBa_K118021 BBa_K118021]) as well as with E. coli cells transformed with the newly constructed part (BBa_K902048) by bringing the supernatant of an overnight culture to a concentration of 0.1 M of catechol. When the part (BBa_K118021) was used, the pellet was first washed in M9-MM and centrifuged before catechol was added to the supernatant. This was necessary to avoid the glucose in the LB from repressing the cstA promoter (BBa_K118011). Catechol was added to the supernatant because the reaction takes place outside of the cell. Within minutes of the addition of catechol to the supernatant, the solution turned from the pale yellow of LB to a bright yellow. This was indicative that catechol was breaking down into 2-Hydroxymuconate semialdehyde, which was exactly what we expected! This assay was completed by following the protocol written by the 2008 Edinburgh iGEM team.  Figure 3: Results of the catechol visual assay using xylE BBa_K118021. Cultures were grown overnight in LB and the pellets were washed with M9-MM at various times (From left to right: 0 min, 5 min, 10 min, 15 min, and 20 min.). Cells were then spun down and catechol was added to the supernatant to 0.1 M. The amount of time didn't affect the colour change in the cultures containing the xylE gene. The far right tube has E. coli cells without the xylE gene as a negative control and the supernatant remained clear when the catechol was added. After verifying that we could in fact degrade catechol into 2-hydroxymuconate semialdehyde using our xylE construct (BBa_J33204), we wondered if we could take this any further. What if we could convert this by-product page into hydrocarbons too? As catechol is the breakdown product of a number of different degradation pathways in bacteria, this could be particularly useful. As 2-hydroxymuconate semialdehyde can be further metabolized to pyruvate and acetaldehyde (Harayama S et al., 1987), it seemed possible that these products could be routed into the fatty acid biosynthesis pathway and converted to alkanes using the PetroBrick or the OleT enzyme. Given that the Catechol 2,3-dioxygenase reaction is extracellular, it creates a possible scenario in which cells with the xylE construct could be co-cultured with Petrobrick-containing cells to cooperatively metabolise catechol into hydrocarbons. In order to test this, we followed this [http://2012.igem.org/Team:Calgary/Notebook/Protocols/decatecholization protocol], where we co-cultured cells expressing our xylE construct with either E. coli cells expressing the PetroBrick, or Jeotgalicoccus sp. ATCC 8456 cells expressing OleT. in the presence of catechol.
 Figure 6: Gas chromatograph of catechol degradation assay using Jeotgalicoccus sp. ATCC 8456 a species of bacteria that converts fatty acids into alkenes. This identified a similar peak change in the PetroBrick with a retention time of 10.5 min as shown in Figure 4. This provides additional support that the PetroBrick and this organism can further degrade catechol into breakdown products.  Figure 7: Mass spectra of i>Jeotgalicoccus</i> sp. ATCC 8456/xylE co-culture retention peak at 10.5 min as shown in Figure 6. This peak is similar to the peak from the Petrobrick/xylE co-culture, suggesting the breakdown product for both of these cultures is modified catechol from xylE. The identification of this compound is ongoing. Based on our GC-MS results, we were able to show the appearance of a new peak when cells expressing xylE and the PetroBrick were co-cultured. Although we don't know the exact identity of this peak, it is distinct form our control. Interestingly, a similar peak appeared when cells expressing our xylE construct were co-cultured with Jeotgalicoccus sp. ATCC 8456 cells. This suggests that although we don't know the exact identity of this new peak, it is likely that it may be in fact a further breakdown product of catechol. This is a very promising result, as it suggests that in addition to converting naphthenic acids into hydrocarbons, we may also be able to break down catechol, one of the other major toxic components in tailings ponds. |
UNIQb914486f9d119a28-partinfo-00000003-QINU

 1 Registry Star


