Part:BBa_K3007010
Expression device of sfGFP under control of PrinA_p80α
RinA_p80α is a transcription activator, which can bind to PrinA_p80a and active the transcription of dsRed. Theoretically, this system can rapidly and drastically increase sensitivity and output amplitude of cell-based biosensors [1]. In our design, we used it to increase sensitivity of HucR-hucO system and boost the fluorescent protein expression.
Contribution
Group: QHFZ-China iGEM 2019
Author: Cheng Li
Design:
Documentation:
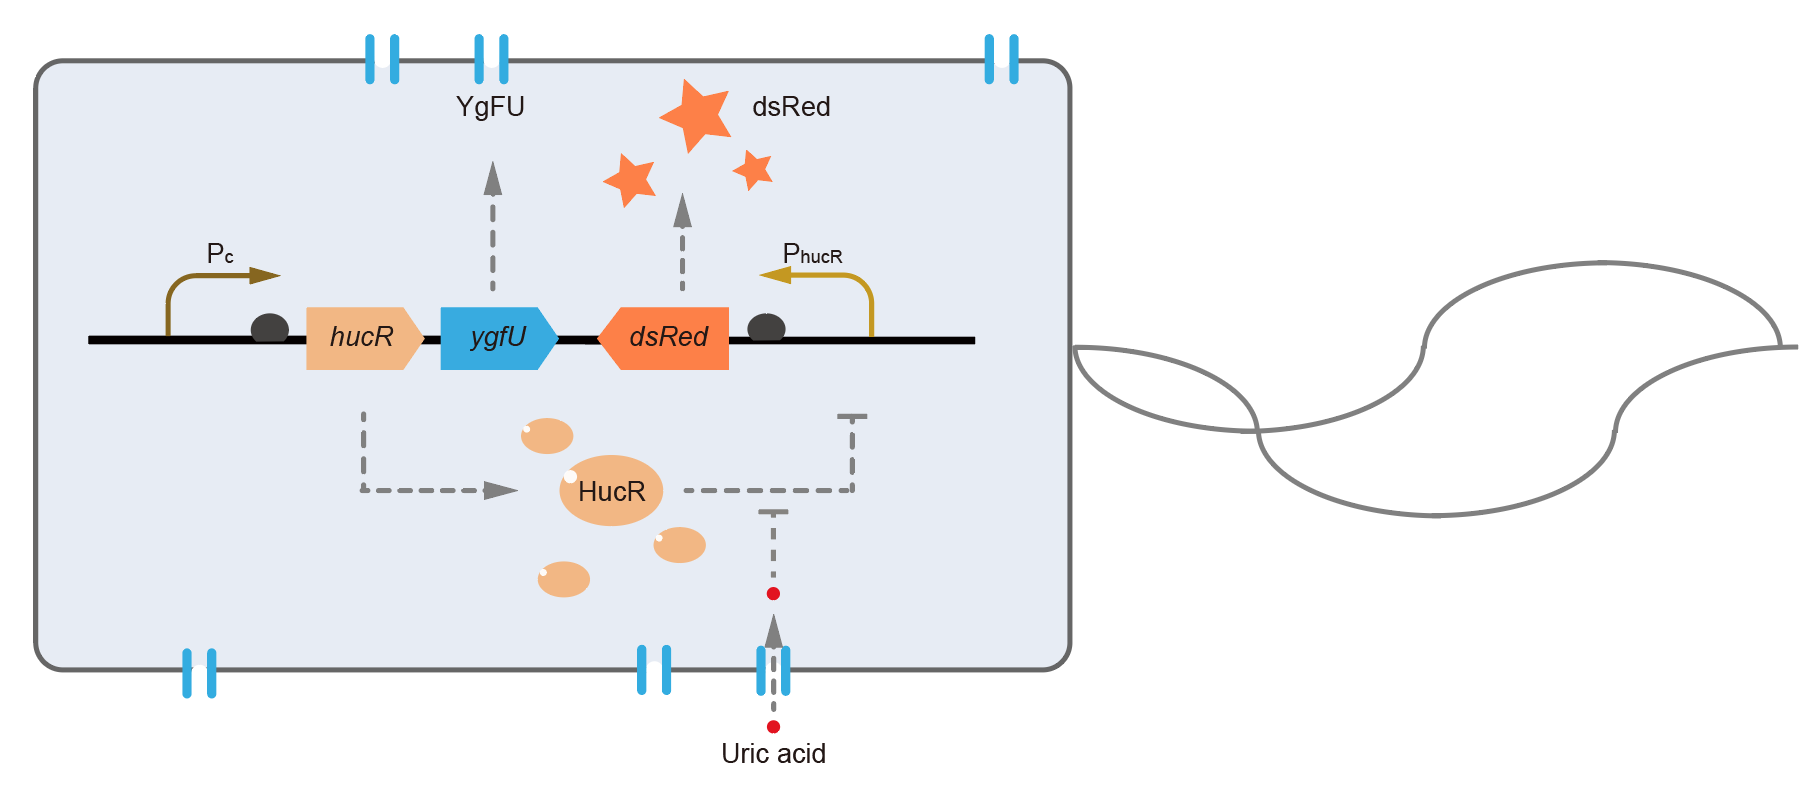
This year, QHFZ-China designed a UA monitor system in E. coli. The original version is shown in Fig. 1. Pc is a constitutive promoter, Pcp6 promoter, and it promotes the expression of HucR and YgfU. When uric acid is absent, HucR can bind to PhucR, which suppresses dsRed expression. If uric acid presents in high concentration, HucR will release from PhucR and the expression of dsRed will recover from the inhibition [2].
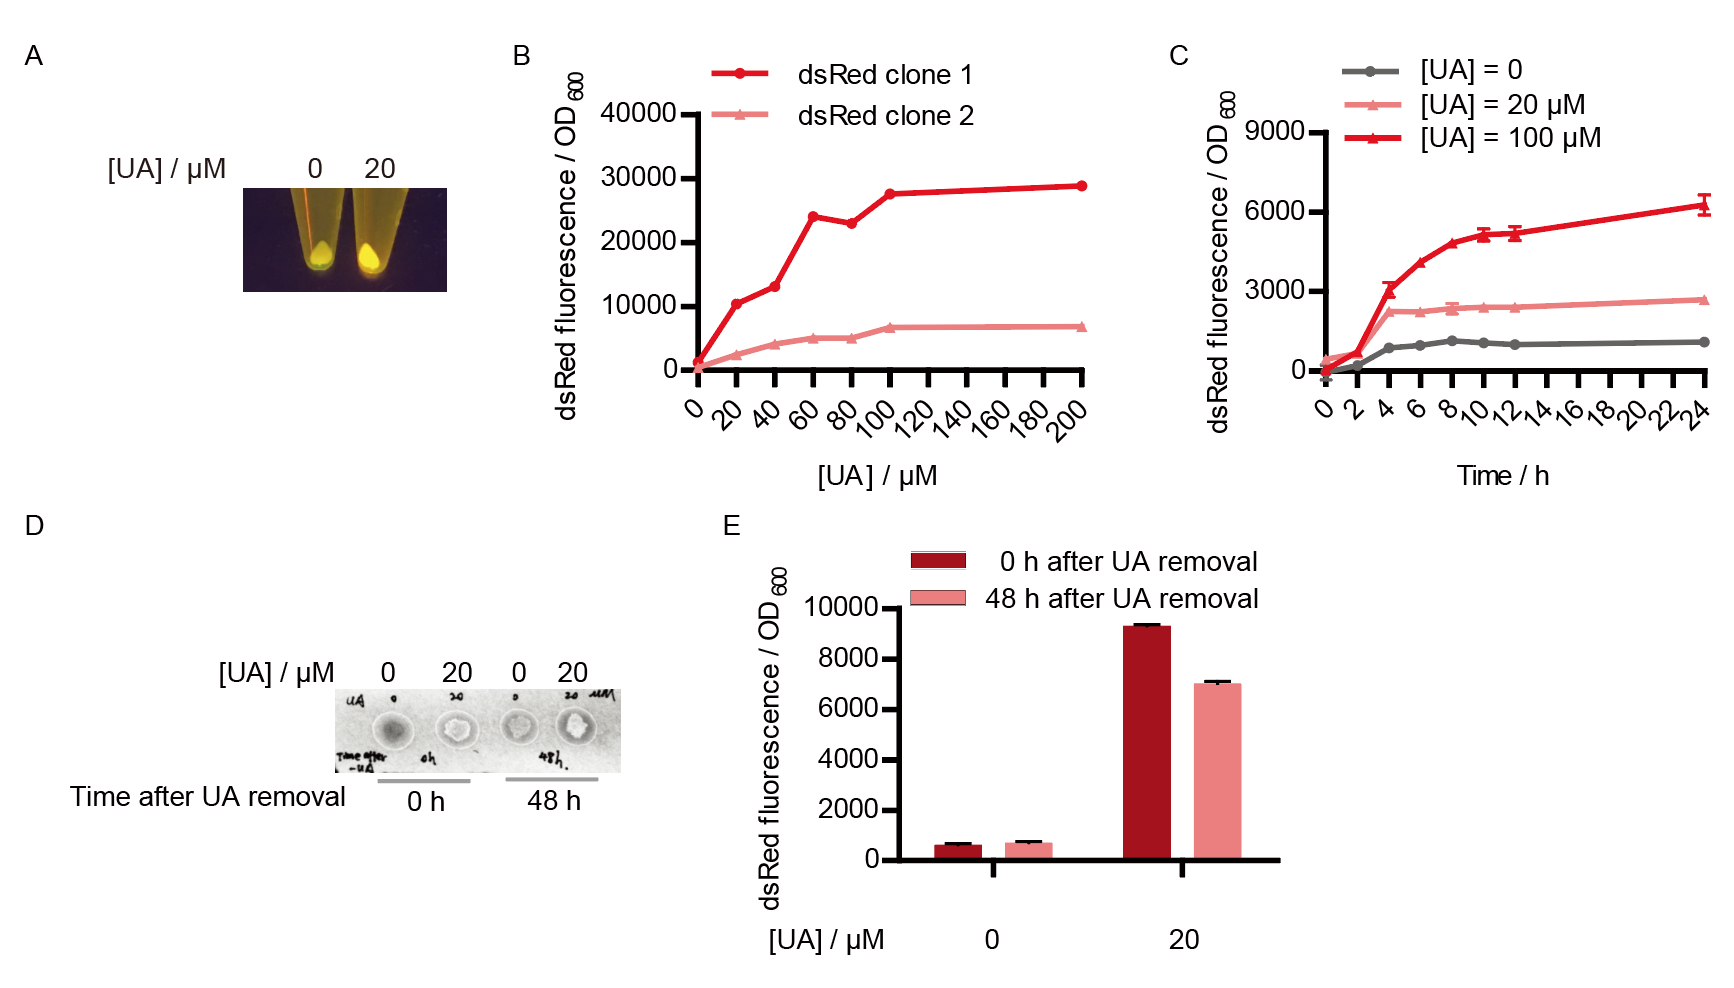
Two clones with the UA detection system were tested. The original gene circuit was able to response to UA in a range of 0 to 200 μM (Fig. 2A). The clone 1 showed much better dynamics than the other (Fig. 2B). Time course experiments showed that the fluorescence intensity became quite strong at 4 to 6 hours after UA induction, and became stable at 10 to 12 hours (Fig. 2C). Even if we removed UA by replacing fresh LB medium, after 48 hours shaking, the fluorescence would be still notable (Fig. 2D) and there was not significant difference of dsRed fluorescence / OD600 between before and after UA removing (Fig. 2E). All the data meant our design could detect high UA concentration quickly and stably.

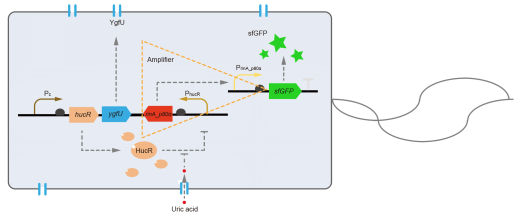
However, through our human practices, we found the sensitivity and responding time of the original design are not good enough. In the next generation design, we introduced RinA_p80α - PrinA_p80a system to enhance the sensitivity. Meanwhile, we changed dsRed to sfGFP, whose maturation time is much shorter, to shorten the waiting time. The new version of the uric acid detector was shown in Fig. 3. If UA presented, RinA_p80α would express and active transcription of sfGFP which was under control of PrinA_p80α. We called this as Version 2.
We tested the sfGFP production of Version 2 under different concentration of extracellular UA. The curve in Fig. 4A showed the fluorescence was saturated under only 15 μM UA induction, while the old version needed about 100 μM UA to get saturated (Fig. 2B). To test if sfGFP could shorten the reaction time, we used the same construct only except reporter genes, called PRinA_p80α – sfGFP and PRinA_p80α – dsRed, respectively. After adding 20 μM UA into the reaction system, the curve of PRinA_p80α – sfGFP climbed much faster than PRinA_p80α – dsRed, which suggested our new design had a great induction performance, and fitted our predictions very well (Fig. 4B).

References:
[1] Wan, X., Volpetti, F., Petrova, E., French, C., Maerkl, S. J., & Wang, B. (2019). Cascaded amplifying circuits enable ultrasensitive cellular sensors for toxic metals. Nature chemical biology, 15(5), 540.
[2] Liang C., Xiong D., Zhang Y., Mu S. and Tang S. (2015). Development of a novel uric-acid-responsive regulatory system in Escherichia coli. Appl. Microbiol. Biotechnol. 99, 2267–2275.
Sequence and Features
- 10COMPATIBLE WITH RFC[10]
- 12COMPATIBLE WITH RFC[12]
- 21COMPATIBLE WITH RFC[21]
- 23COMPATIBLE WITH RFC[23]
- 25COMPATIBLE WITH RFC[25]
- 1000INCOMPATIBLE WITH RFC[1000]Illegal SapI.rc site found at 213
| None |


