
Part:BBa_K1033000:Experience
This experience page is provided so that any user may enter their experience using this part.
Please enter
how you used this part and how it worked out.
Characterization data:
Tyrosine ammonia lyase (TAL) from rhodobacter sphaeroides was obtained from J.Conrado et al[4] We biobricked TAL with the ribosome binding site B0034 and overhangs in a single pcr. We also made a version with 6-HIS-tag for enzyme expression analysis. TAL was also mutagenized to remove illegal Not1 site. We verify all of our genetical constructs with sequencing.
We have expressed TAL in e-coli DH5alpha and E-coli nissle, a probiotic e-coli obtained from Trieste iGEM 2012. TAL will also be characterized in lactobacillus, by transforming the construct with our shuttle vector. This construct can also be used to produce the precursor for example our resveratrol.
Results
Summary
We managed to clone out and biobrick tyrosine ammonia lyase and verify the biobrick by sequencing. Also we did succeful characterization on this part, showing that it works as expected. We managed to express our enzyme and detect it in a western blot, and also detect our metabolite in both spectrophotometry and hplc. The biobrick was characterized in e-coli d5halpha and e-coli nissle.
Biobrick
We succeded in the cloning and sequencing of our biobrick, Tyrosine ammonia lyase from rhodobacter sphaerides with the RBS B0034 that should work in various organisms, lactobacillus and e-coli. Sequencing was done at GATC biotech and Uppsala Genome center using sanger sequencing. Tyrosine ammonia lyase with rbs: BBa_K1033000
Western blot We also succeeded in expressing the enzyme tyrosine ammonia-lyase (TAL) in e-coli. To enable the detection of this protein by anti-his antibodies, 6-histidine tags was incorporated in the sequence. This way we could detect our enzyme with anti-his antibodies. We expressed our protein with a multipromotor working in both lactobacillus and e-coli. This way, we can easily transfer TAL to lactobacillus later on. The size of our protein was calculated using ProtParam[5], 54.9 kDA.

Figure 1:SDS-page and western blot. Expression of Tyrosine ammonia lyase with constitutive promotors. The negative control is empty, showing that there is no natural protein in e-coli with the same attributes.
1.Positive control
2.TAL with Cp8 promotor
3.TAL with J23110 promotor
4.Negative control
Spectrophotometry
As the next step, we have made a spectrophotometric assay of our metabolite p-coumaric acid produced by e-coli. By using n-octanol and a two-phase extraction, we were able to extract our metabolite from the lb medium and bacteria. This way we could characterize our biobrick on spectrophotometer. (protocol link)
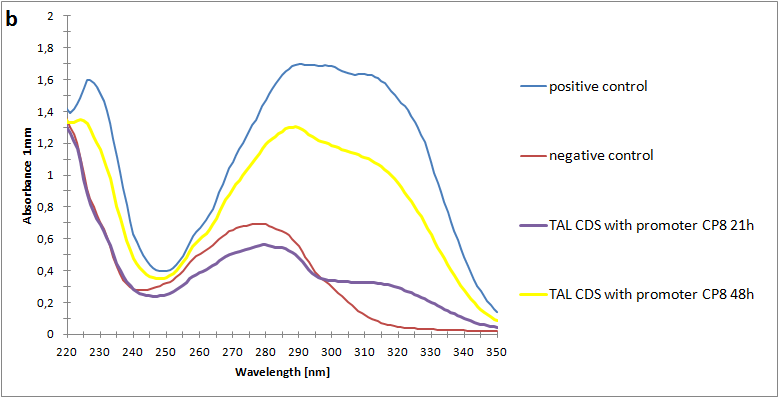
Figure 2:Absorbance spectra of extracts collected from bacterial cultures. Samples were collected 21 h and 48 h after 30 °C incubation. Negative control is an extract from a strain with no TAL gene on a transformed plasmid. The positive control is an extract on a culture of the same strain as the negative control but with added p-coumaric acid to a concentration of 500 µM before extraction.
High pressure liquid chromatography
To further prove p-coumaric acid production in e-coli, we did a hplc of our bacterial culture. We managaed to detect our metabolite at around 9 minutes. (Protocol link)
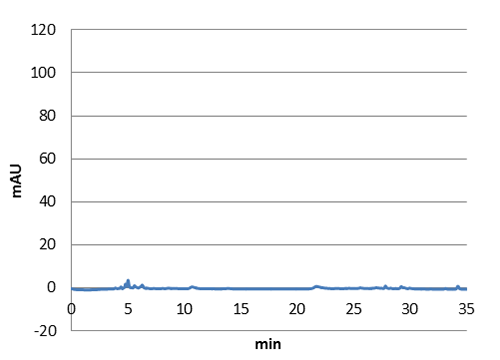
Figure 3: E-coli culture injected to the hplc without our biobrick tyrosine ammonia lyase. Here we can see that there is originally no peak at 9 minutes.
Figure 4. Graph showing the HPLC result of a sample standard with p-coumaric acid

Figure 5. Graph showing the HPLC result of a sample prepared from e coli expressing tyrosine ammona lyase. Reverse phase HPLC with a C18 matrix was used. The peak for p-coumaric acid can be seen ~9 min, as shown by the standard sample below.
[1]Zhixion Xue et al, Identification and functional expression of tyrosine ammonia-lyase and its mutants from the photosynthetic bacterium rhodobacter sphaeroides, J Ind Microbiol Biotechnol (2007) 34:599-604 [2] Lun-Yi Zang et al, Effect of antioxidant protection by p-coumaric acid on low-density lipoprotein cholesterol oxidation, Am J Physiol Cell Physiol. 2000 Oct;279(4):C954-60. [3]Lynnette R. Ferguson, Shuo-tun Zhu, Philip J. Harris, Antioxidant and antigenotoxic effects of plant cell wall hydroxycinnamic acids in cultured HT-29 cells, Issue, Molecular Nutrition & Food Research, Volume 49, Issue 6, pages 585–593, June 2005
User Reviews
UNIQd7a2eaffd61a88d6-partinfo-00000000-QINU UNIQd7a2eaffd61a88d6-partinfo-00000001-QINU