Part:BBa_K863021
bhal laccase from Bacillus halodurans
bhal laccase from Bacillus halodurans
Sequence and Features
- 10COMPATIBLE WITH RFC[10]
- 12COMPATIBLE WITH RFC[12]
- 21INCOMPATIBLE WITH RFC[21]Illegal XhoI site found at 157
- 23COMPATIBLE WITH RFC[23]
- 25COMPATIBLE WITH RFC[25]
- 1000COMPATIBLE WITH RFC[1000]
Activity Analysis of BHAL
Initial activity tests of purified fractions
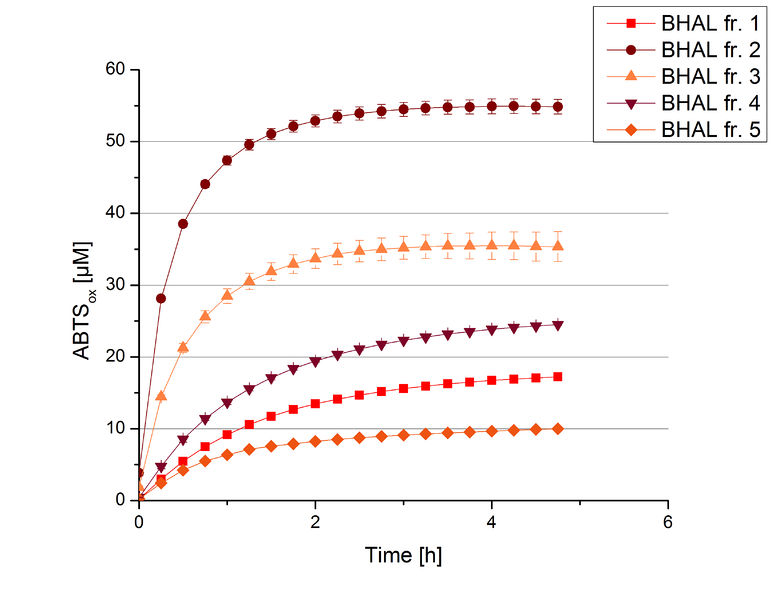
The resulting fractions of the cultivation and purification of BHAL (fraction 1 to 5) were analysed with activity tests. After rebuffering into deionized H2O and incubation with 0.4 mM CuCl2 for 2 hours, the samples were measured with 140 µL sample, 0.1 mM ABTS, 100 mM sodium acetate buffer to a final volume of 200 µL. The change in optical density was measured at 420 nm, reporting the oxidation of ABTS for 5 hours at 25°C. An increase in ABTSox can be seen (Figure 4), indicating produced BHAL laccase in each fraction. Fraction 2 shows the highest amount of ABTSox (55%) reaching saturation after 3 hours. Similar to BPUL laccase, BHAL is capable to reach saturation after 3 hours with approximately oxidizing 55% of the supplied ABTS. Therefore BHAL is going to be characterized further.
Initial activity tests of purified fractions
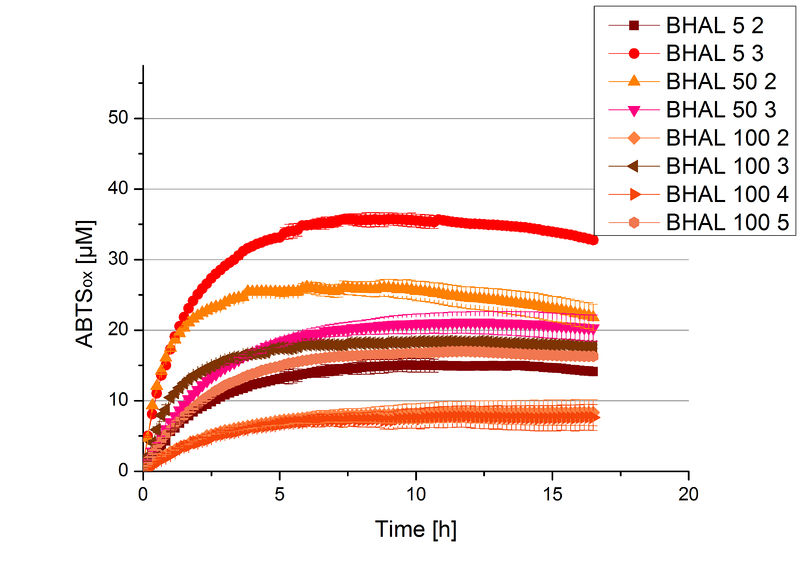
Different fractions of the purification of a new cultivation since the Regional Jamborees in Amsterdam were tested regarding their activity of the produced BHAL. Before and after re-buffering the protein concentration was determined. The initial activity tests were done in Britton-Robinson buffer (pH 5) with 0.1 mM ABTS at 25 °C. The protein amount was adjusted in each sample for a comparison. One distinct fraction showed the highest activity: fraction 5% 3 (Fig. 5). The contained laccase amount was calculated by assuming that the most active fraction contains 90 % laccase. This leads to a BHAL concentration of 10,9 ng mL-1.
BHAL activity depending on different ABTS concentrations
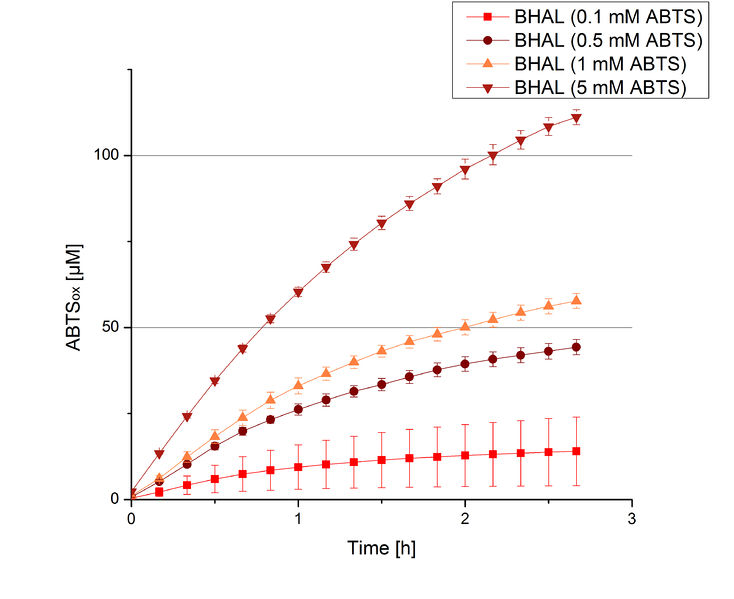
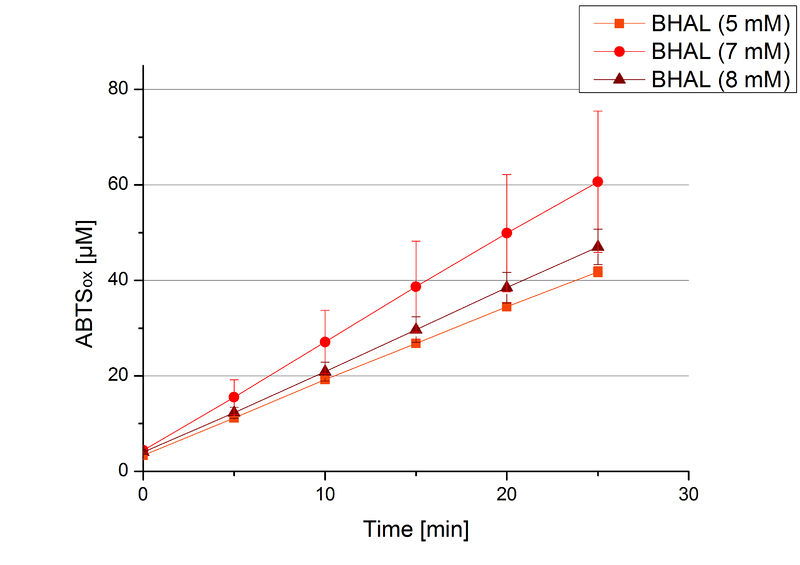
To be able to calculate the activity in Units mg-1, measurements had to be done under substrate saturation. This allows the comparison of Units mg-1 with other laccase activities and data found in literature. For this purpose ABTS concentrations ranging from 0.1 mM to 8 mM were applied in an experimental setup containing Britton-Robinson buffer (pH) and a temperature of 25 °C. For measurements with 0.1 mM to 5 mM ABTS 616 ng BHAL were used (Fig. 6). For measurements with 5 mM to 8 mM ABTS only 308 ng BHAL were applied (Fig. 7). Applying less than 7 mM ABTS a static increase in oxidized ABTS was given. Measurements with 8 mM ABTS showed a slower increase in oxidized ABTS as with 7 mM ABTS (Fig. 7). This may be due to a substrate toxication. The most compromising ABTS concentration was 7 mM with the highest increase in oxidized ABTS. Therefore a substrate saturation was reached with 7 mM ABTS.
BHAL pH optimum
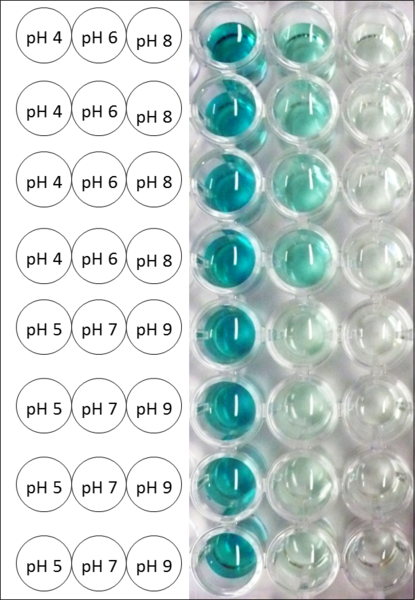
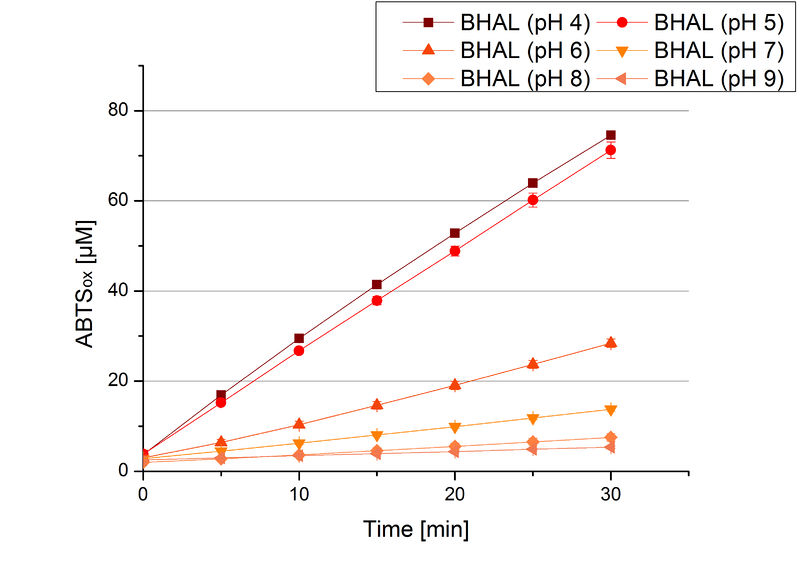
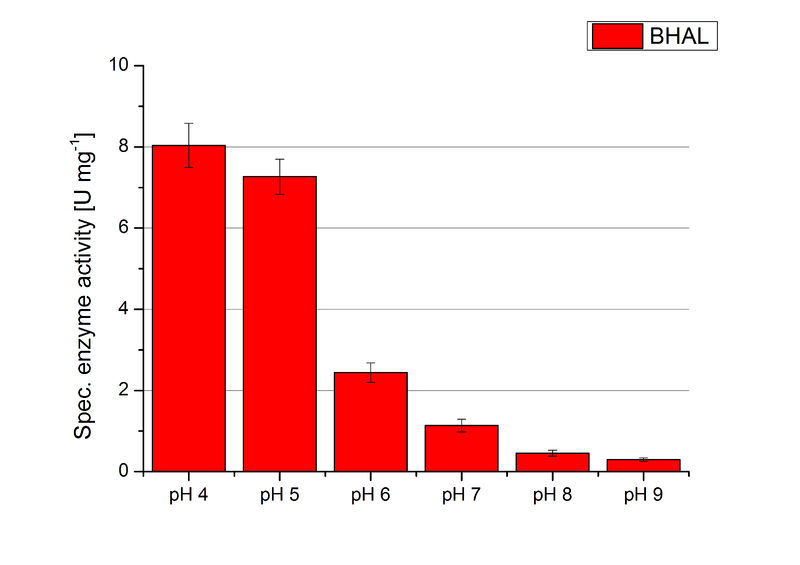
To determine the optimal experimental setup for BHAL activity measurements, the best pH had to be determined. Using Britton-Robinson buffer pHs between pH 4 and pH 9 had been adjusted. 308 ng BHAL per well had been tested under these pH conditions using 7 mM ABTS. The CuCl2 incubated and therefor activated BHAL showed a high activity at pH 4 and pH 5, where most of ABTS was oxidized (compared to Fig. 8 and 9). The calculated specific enzyme activity of BHAL showed high activity at both mentioned pHs (Fig. 10). While BHAL had an activity of ~8 U mg-1 at pH 4 and pH 5, the enzyme activity decreased at higher pHs. At a pH of 6 only 1/3 of enzyme activity could be detected compared to the activity at pH 4 and pH 5. While still active at pH 7, the BHAL is not as suitable as thought for an application at a waste water treatment plant because of its high activity in acidic environments.
BHAL activity at different temperatures
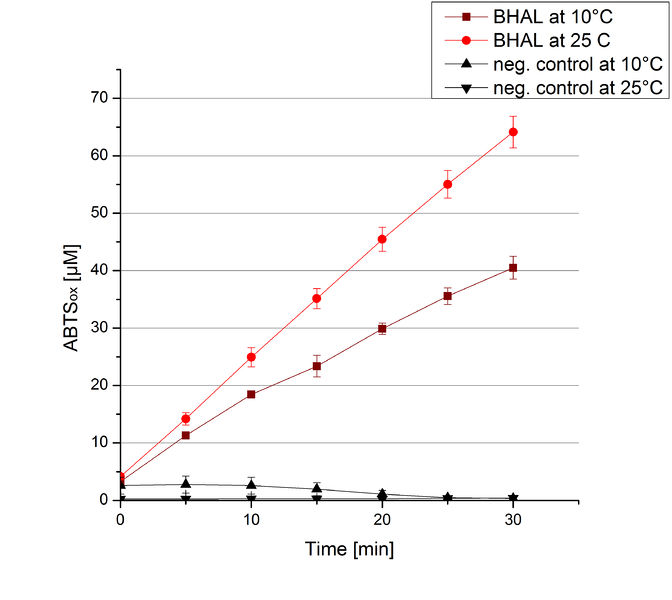
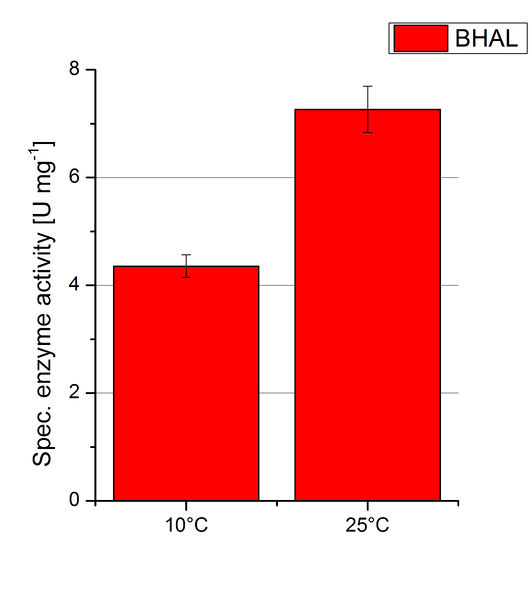
To investigate the activity of BHAL at temperatures that will apply at a waste water treatment plant throughout the year, activity tests were performed at 10 °C and 25 °C as described above. The measurements were conducted for 30 minutes. The obtained results revealed a lower activity of BHAL at 10 °C in comparison to 25 °C (see Fig. 11). The obtained results were used to calculate the specific enzyme activity which was at 4.2 and 7.2 U mg-1, respectively (see Figure 12). The negative control without BHAL but 0.4 mM CuCl2 at 10 °C and 25 °C showed a negligible oxidation of ABTS. The activity of BHAL was increased to about 60 % at 10 °C but nevertheless the observed activity at both conditions was great news for the possible application in waste water treatment plants.
Substrate Analysis
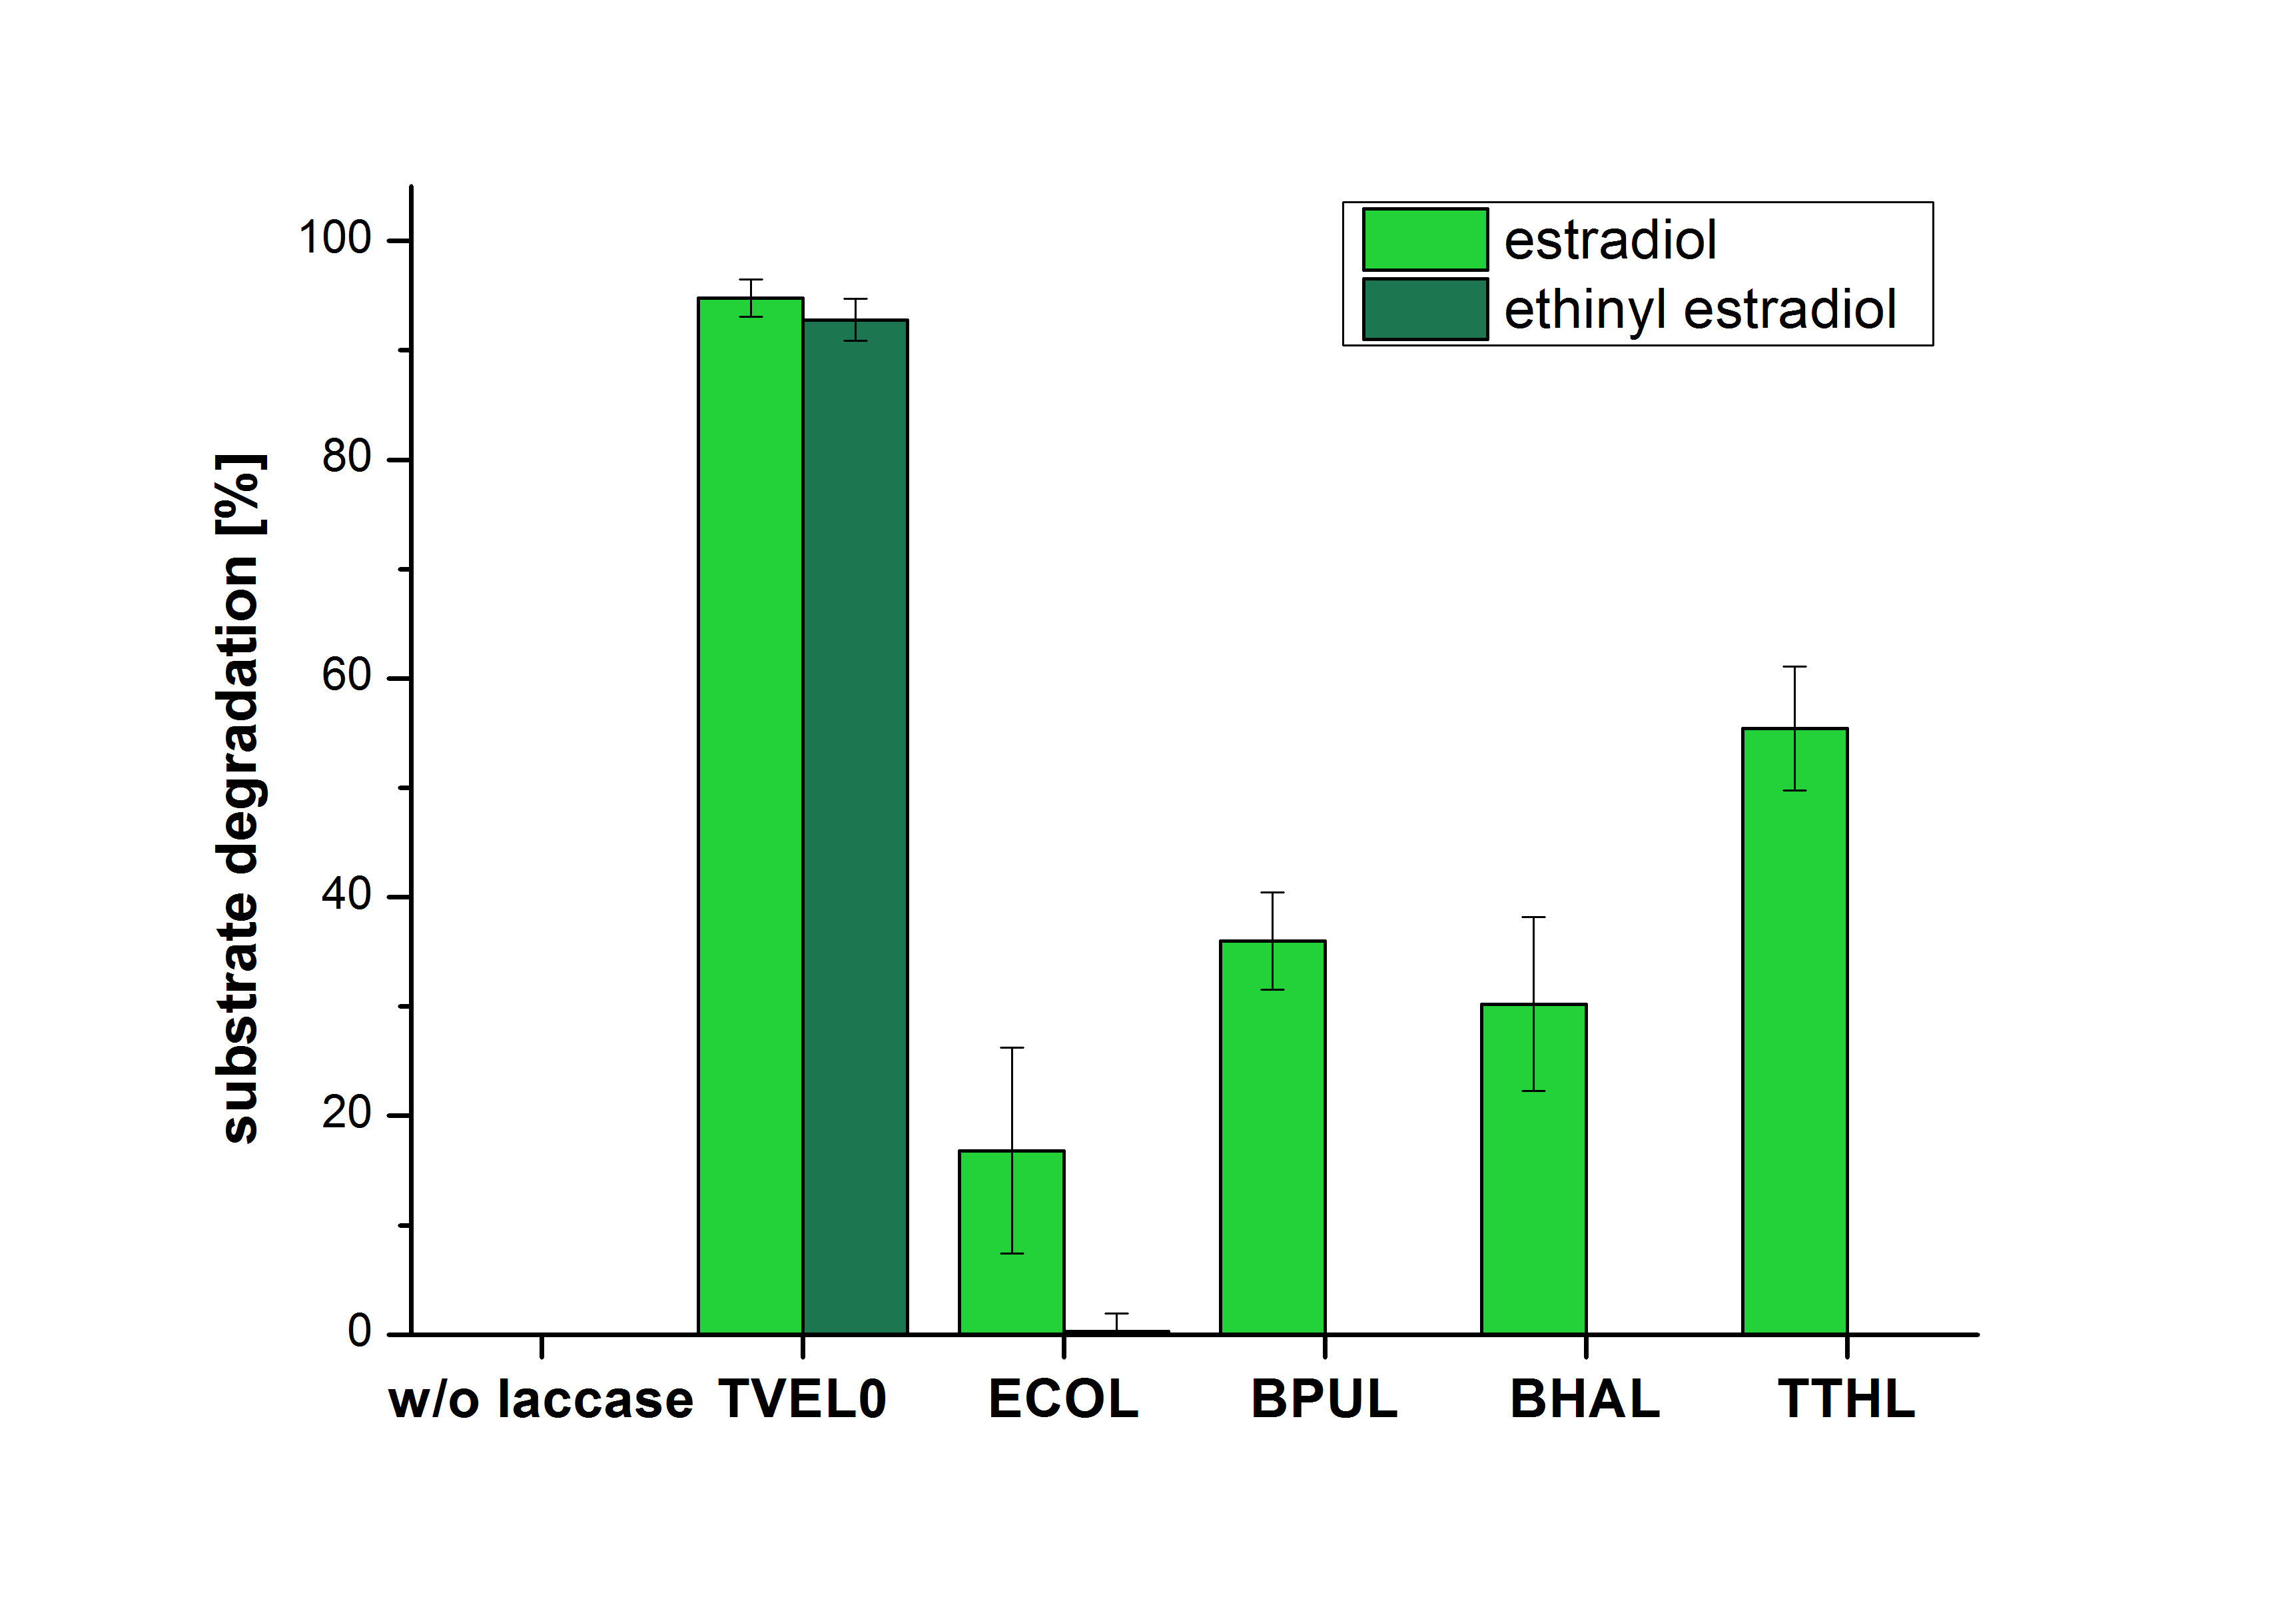
The measurements were made to test if the produced laccases were able to degrade different hormones. Therefore the produced laccases were inserted in the same concentrations (3 µg mL-1) to the different measurement approaches. To work with the correct pH value (which were measured by the Team Activity Test) Britton Robinson buffer at pH 5 was used for all measurements. The initial substrate concentration was 5 µg mL-1. The results of the reactions without ABTS are shown in Figure 2. On the Y-axis the percentages of degraded estradiol (blue) and ethinyl estradiol (red) are indicated. The X-axis displays the different tested laccases. The degradation was measured at t0 and after five hours of incubation at 30 °C. The negative control was the substrate in Britton Robinson buffer and showed no degradation of the substrates. The bought laccase TVEL0 which is used as positive control is able to degrade 94.7 % estradiol and 92.7 % ethinyl estradiol. The laccase BPUL (from Bacillus pumilus) degraded 35.9 % of used estradiol after five hours. ECOL was able to degrade 16.8 % estradiol. BHAL degraded 30.2 % estradiol. The best results were determined with TTHL (laccase from Thermus thermophilus). Here the percentage of degradation amounted 55.4 %.
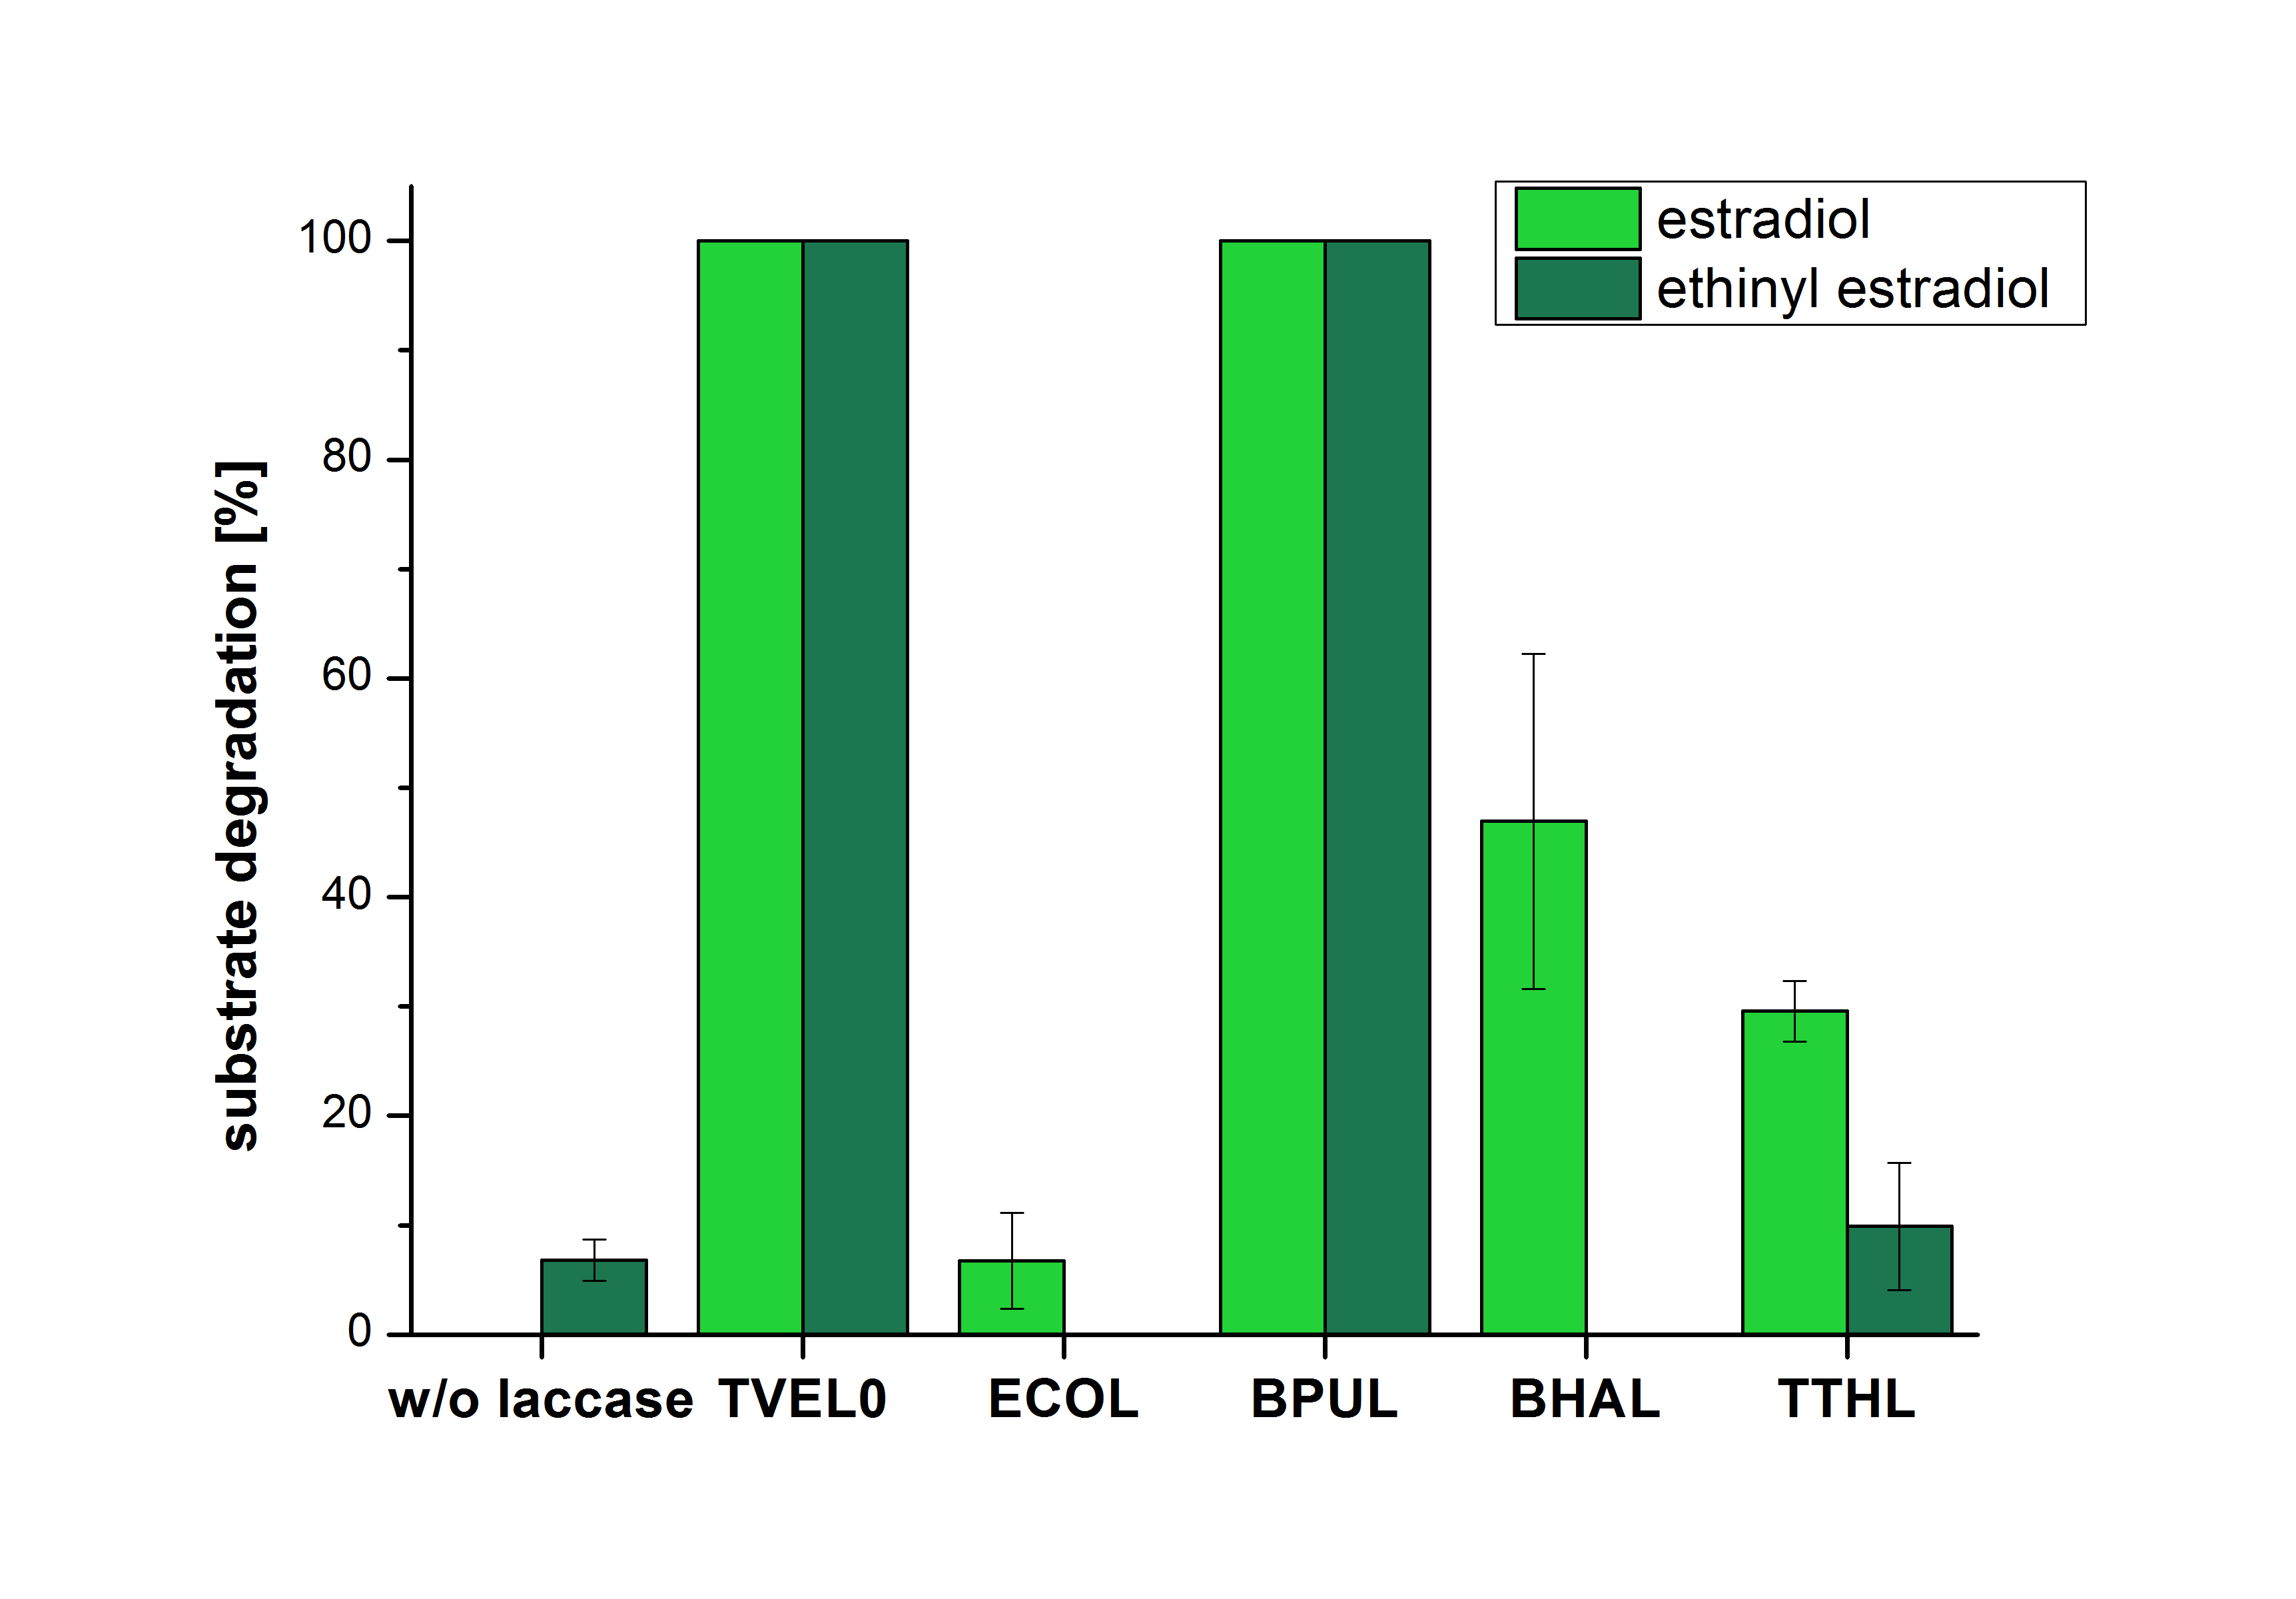
The results of the reactions of the laccases with addition of ABTS are shown in Figure 3. The experimental set ups were the same as the reaction approach without ABTS described above. The X-axis displays the different tested laccases. On the Y-axis the percentages of degraded estradiol (blue) and ethinyl estradiol (red) are shown. The degradation was measured at t0 and after five hours of incubation at 20 °C. The negative control showed no degradation of estradiol. 6.8 % of ethinyl estradiol was decayed. The positive control TVEL0 is able to degrade 100 % estradiol and ethinyl estradiol. The laccase BPUL (from Bacillus pumilus) degraded 46.9 % of used estradiol after ten minutes incubation. ECOL was able to degrade 6.7 % estradiol. BHAL degraded 46.9 % estradiol. With TTHL (laccase from Thermus thermophilus)a degradation 29.5 % were determined.
Immobilization
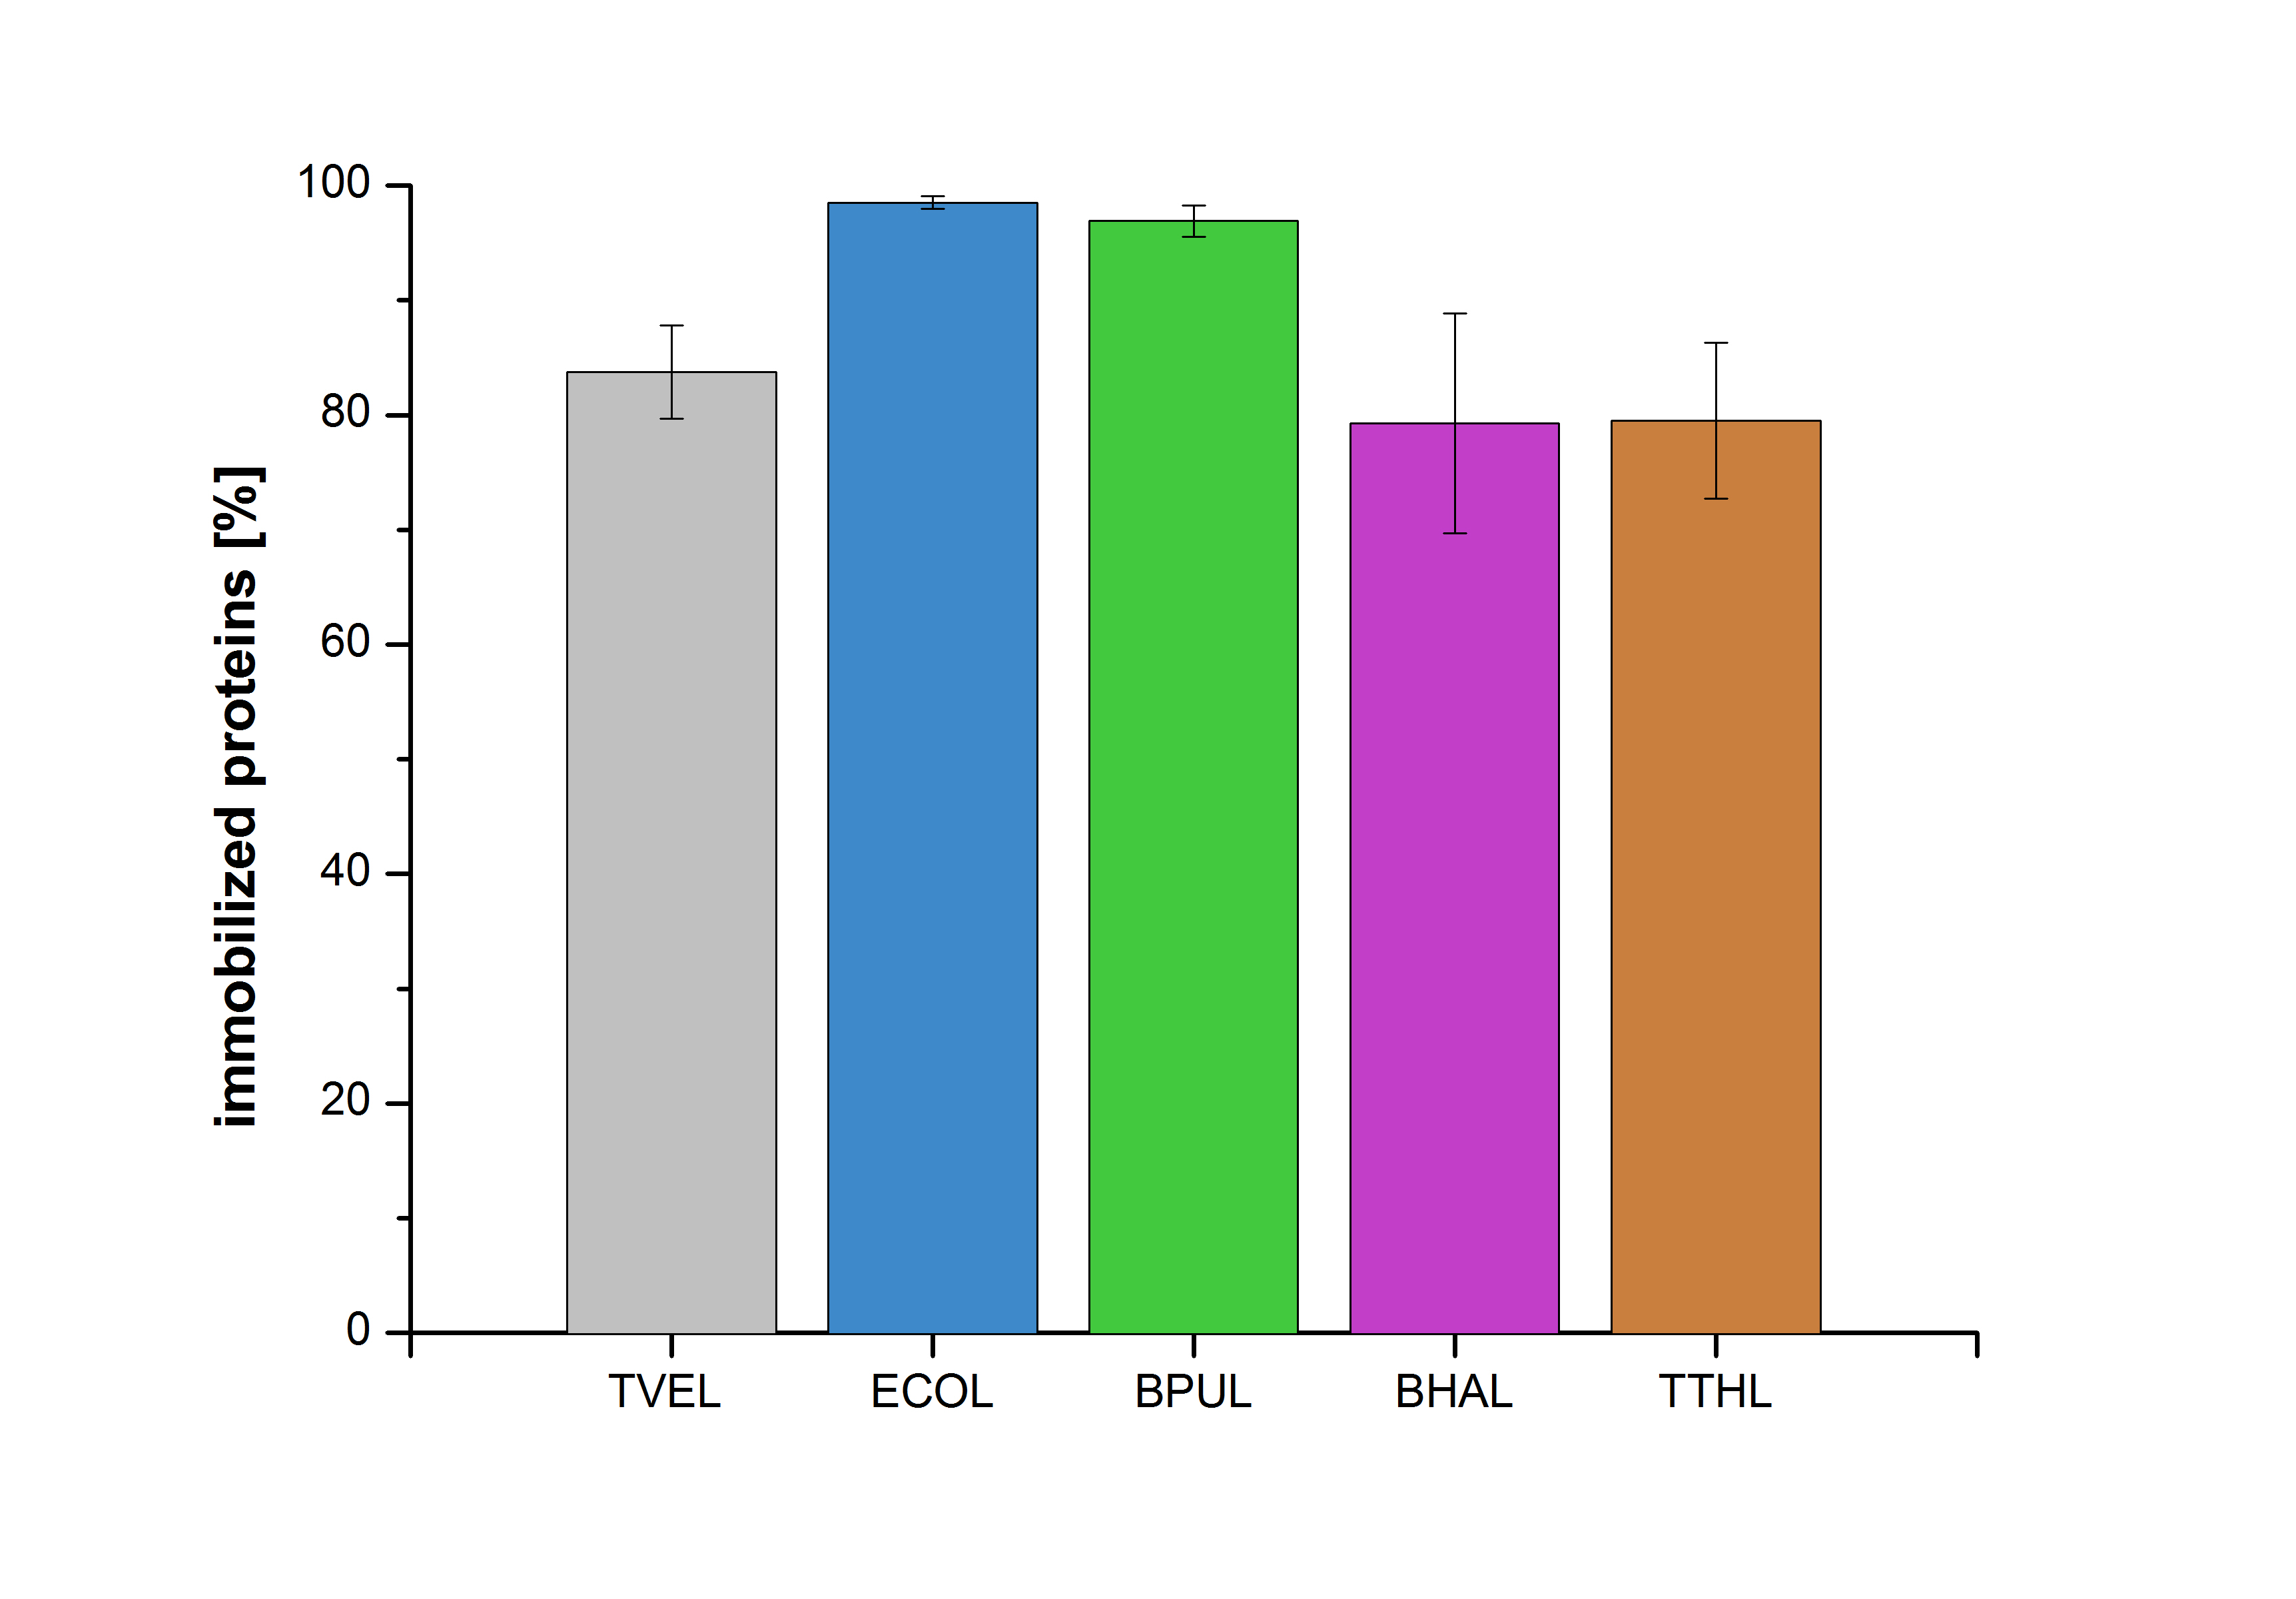
Figure 20 shows the percentage of laccases bound after incubation with CPC-beads, relative to the original concentration. The concentration of laccases in the supernatant after incubation was measured using Roti®-Nanoquant. The results showed that only 21% of BHAL laccases was still present in the supernatant. This illustrates that BHAL was successfully immobilized on the CPC-beads.
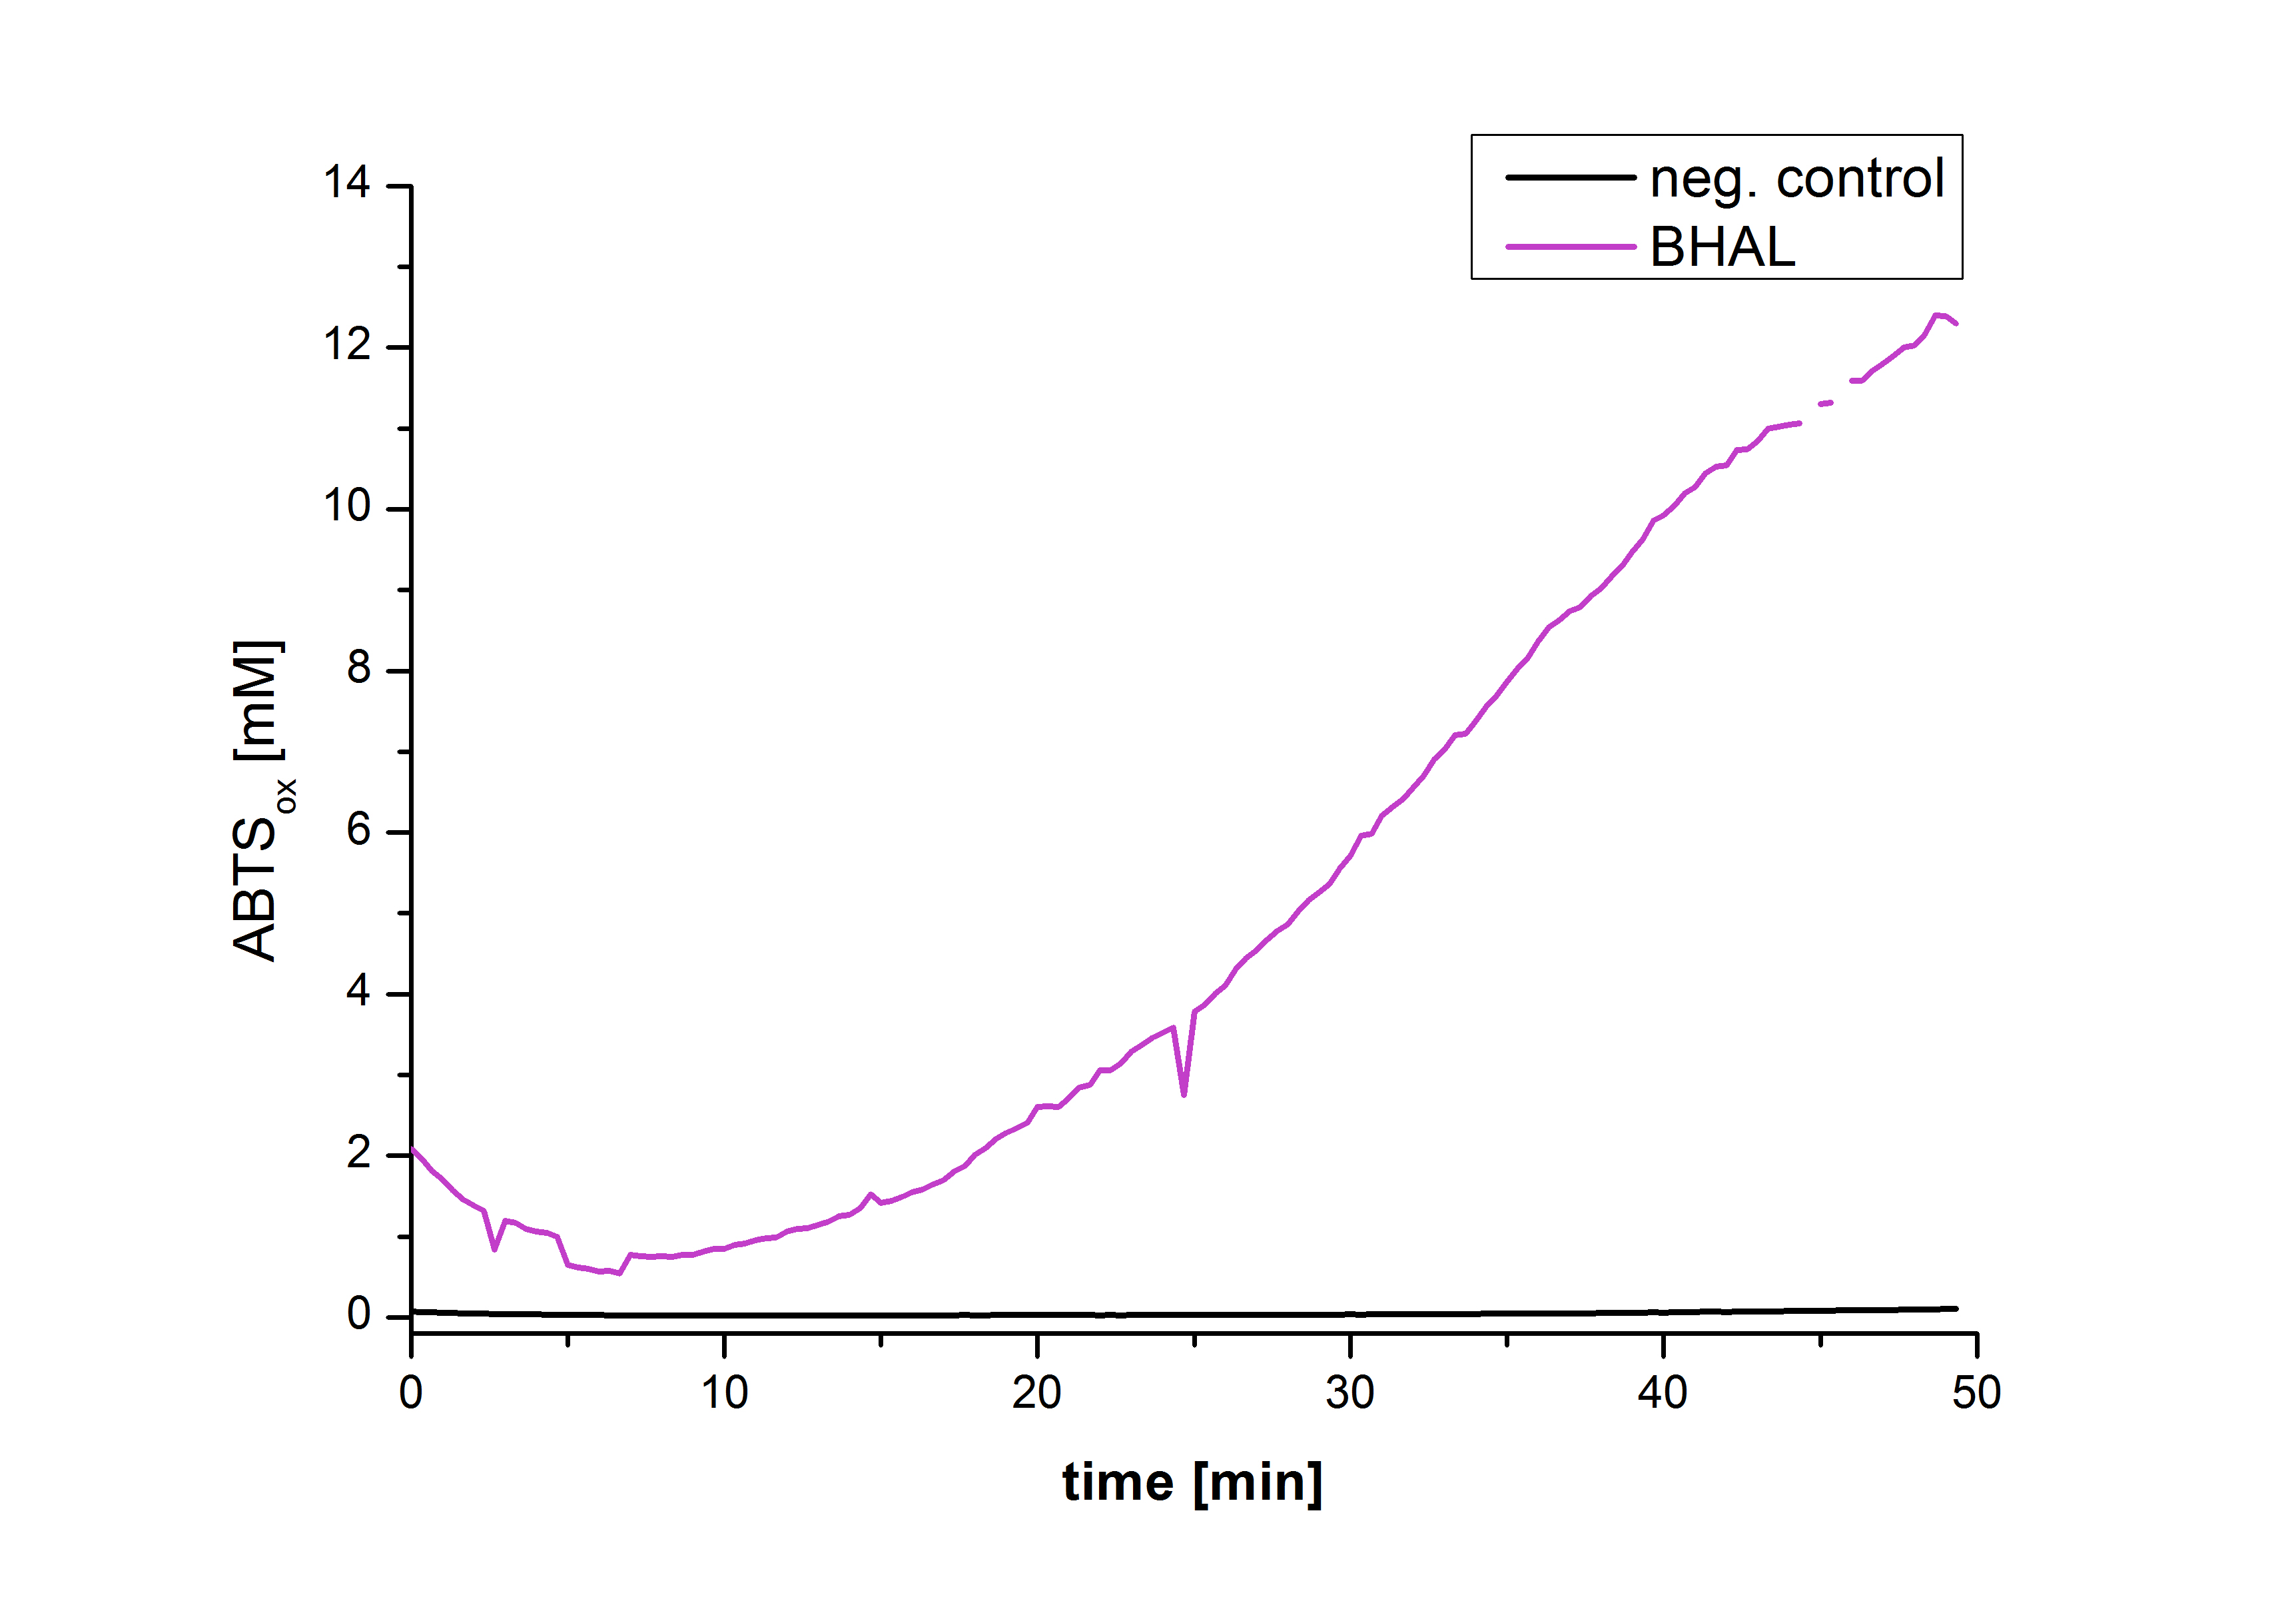
Figure 22 shows the illustration of ABTS oxidation by BHAL with time compared to the negative control. The increase in ABTS oxidized proves laccase activity even if a direct comparison with the original and not immobilized laccase solution was not possible due to the very low concentration of purified BHAL.
//function/degradation
//proteindomain/degradation
| None |

