Part:BBa_K4439015
SR-Avitag-10xHis
Contents
Abstract
For the scope of our project, we designed a recombinant fire-retardant protein, inspired from the SRSF1 protein already tested by the Mingdao 2015 iGEM team, as the top layer coating of our aerogel. We found the Mingdao part relevant for our application. However, we can imagine any other protein of interest being used for secondary coating instead of the SR, making the whole material modulable to the objective. Therefore, we added to the C-terminus of the SR protein a Avitag that can be biotinylated to allow the binding with the silk fusion protein that has a streptavidin monomer (mSA) to its N-terminus. Moreover, to purify the resulting protein from BL21(DE3) E. Coli competent cells, the expression system we chose, we added a 10xHis tag to the C-terminus, after the Avitag.
Sequence and Features
- 10COMPATIBLE WITH RFC[10]
- 12COMPATIBLE WITH RFC[12]
- 21INCOMPATIBLE WITH RFC[21]Illegal BglII site found at 149
Illegal BglII site found at 266
Illegal BglII site found at 335
Illegal BamHI site found at 110 - 23COMPATIBLE WITH RFC[23]
- 25COMPATIBLE WITH RFC[25]
- 1000COMPATIBLE WITH RFC[1000]
Protein Characterization
Usage and Biology
SR protein
- The serine/arginine-rich splicing factor 1 (SRSF1) is found on chromosome 17 in Homo Sapiens where it plays a role in preventing exon skipping, ensuring the accuracy of splicing and regulating alternative splicing. It is 248 aa long and weighs 27 kDa.
- The secondary structure is composed of 6 antiparallel β-sheets, 2 alpha helices and some random coils.
- Due to the high content of nitrogen, coming from arginine residues, and phosphorus, stemming from serine phosphorylation by the kinase SRPK1, the SR protein displays fire retardancy properties when phosphorylated which could strengthen the aerogel.
Avitag
- For the biotinylation of the SR protein, we decided to add to its C-terminus an Avitag, that can be biotinylated at a specific lysine either in vivo or in vitro. This allows the interaction through a biotin-streptavidin link of the two layers of recombinant proteins that composes our material. The SR protein would have an Avitag that could be biotinylated, and the silk fusion protein would contain the biotin binding domain, a streptavidin monomer.
- Biotinylation could either be done in vivo before the expression and purification of the SR-Avitag (01b) protein by adding biotin and BirA enzyme, or in vitro using a Biotinylation kit after the purification of the protein.
Modeling
Modeling the amount of proteins to coat a cellulose aerogel
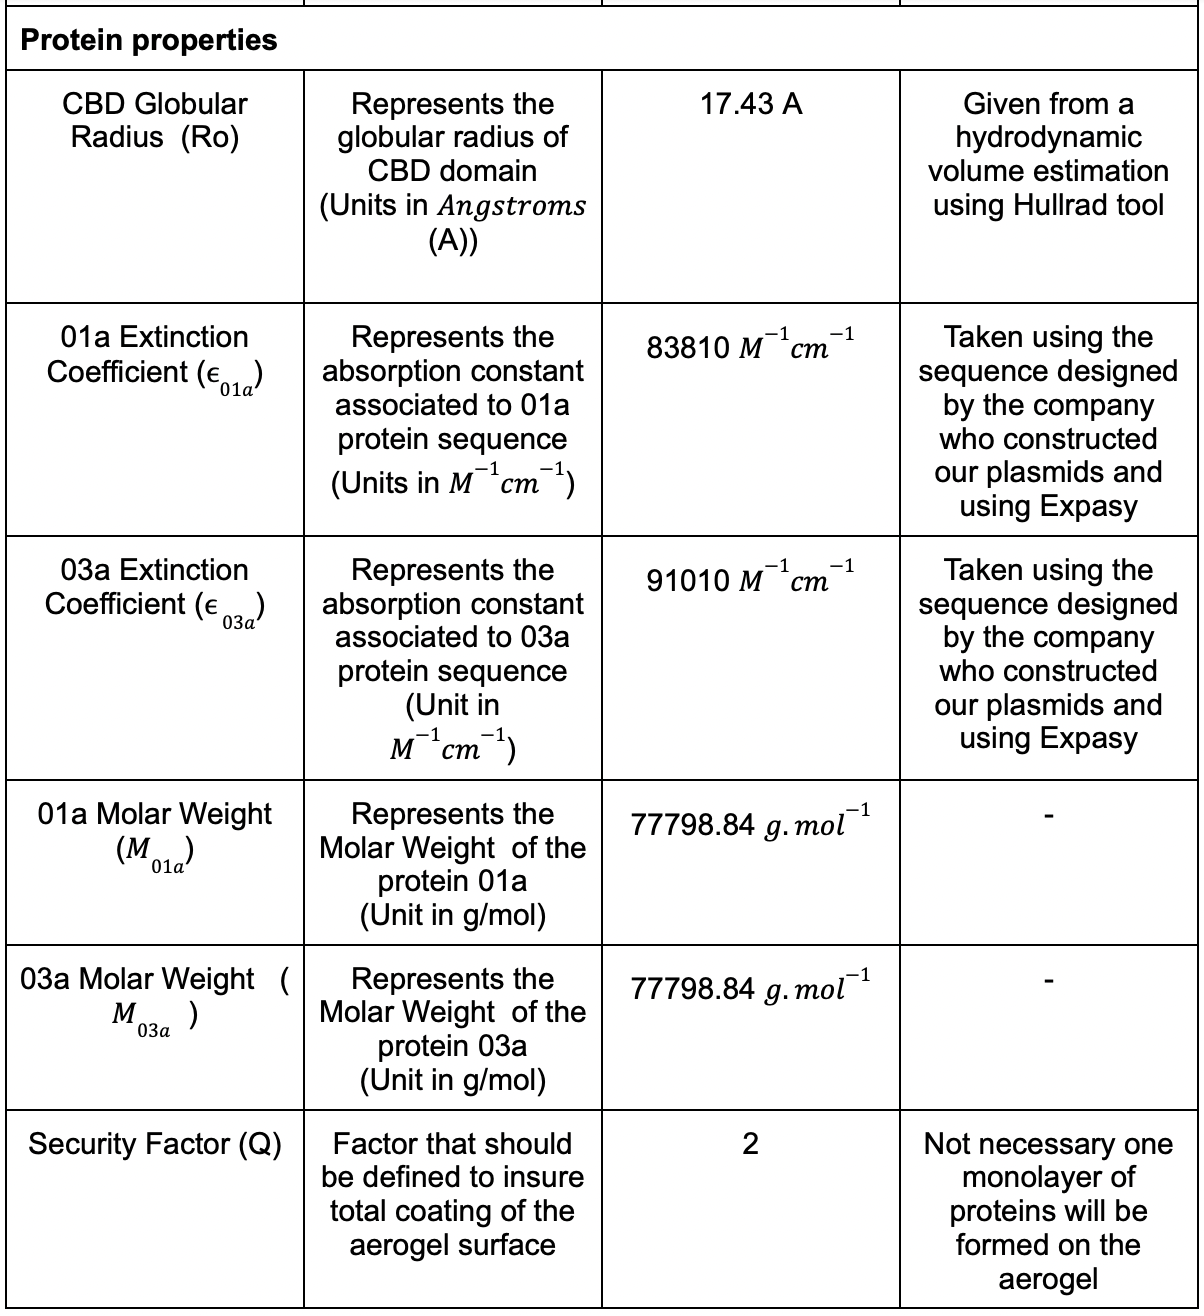
We had different parameters that needed to be considered and we listed the most of them in (Table. 1)


Table 1: Table for the parametric model .
In the proposed model we would like to coat geometrically our aerogel surface with different CBD globular entities. Since they are the most probable point of anchoring they will represent an entire protein in the counting of the amount of proteins. We supposed that the proteins would be placed in an adjacent manner.
First step was to consider the aerogel as a perfect cylinder that will be coated by the proteins. The surface of the cylinder is simplified to two circles and an elongated rectangle (fig2). We proceeded to a geometrical filling of the surface.

Figure 2 | Aerogel simplified representation as a perfect cylinder.
The attaching CBD region was taken from the above model 4JO5 to study its hydrodynamic characteristics using the Hullrad algorithm. This program was used to get specific useful information on the protein 4JO5:

Table 2 | Hullrad computation for CBD, AJO5
Using the values from (Table. 2), we populated the different surfaces of the aerogel with circular proteins using some simple geometry equations. The two values of AVSR and MD were studied in the example. Considering the protein radius and aerogel diameter, we came up with an iterative algorithm in three steps: Step 1: Populate the outer peripheral of the bigger cylinder:
We used the following angular equation to compute the angle of placement of the first small protein circle in the aerogel bigger circle:
alpha = 1 /π |arcsin(r(proteins)/(r(aerogel)- r(proteins)))*180| (1)
where r(proteins) and r(aerogel) represent respectively the radius of the proteins and the aerogel.
Step2: Compute the number of cylinders that can populate the peripheral of our the bigger circle:
nb(circles) =[360/(2*alpha)] (2)
where [x] is the greatest integer function s.
Step 3: Define a secondary circle that has the next small circles:
We iterated the new radius until we could not fit any small circles in the area (fig.12):
r(new)=r(previous)-( 2 *r(small)) (3)
where r(previous) is the large radius of the previous iteration.
Ending condition :
r(previous)< r(small)

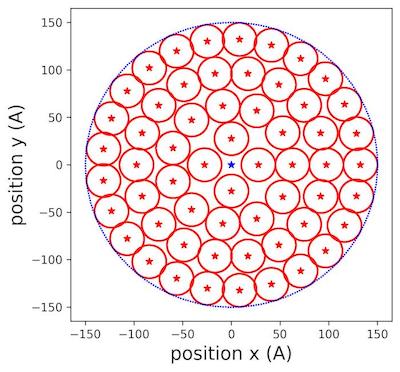
Figure 3 | Populating circles with tiny cylinders zoom at 150 Å aerogel surface .
In (fig.3), we saw clearly how the different circles were placed inside the allocated surface of aerogel. We extended the reasoning to filling the rectangular lateral surface.
For the lateral specific surface, the operation is described as following:
Step 1: Divide the width of the rectangle by the number of small protein circles that fits in the line :
nb(circles for width) = [W2 * r(proteins)] (4)
where W is the width of the rectangle, r(proteins) represents the radius of the proteins and [x] is the greatest integer function as described above.
Step 2: Multiply the above number by the number of lines that can fit in the height of the rectangle:
nb(circles for rectangle) = [h2* r(small)] * nb(circles for length) (5)
where h represents the height of the rectangle, [x] is the greatest integer function as described above.
By taking the parameters of the aerogel from (Table.1) and the parameters of the CBD from (Table.2) we got the following output in number of molecules and in number of molar:

Table 3: Results of the coating computations.
- The values found in (Table.3) were useful to define the protein solution volume that we soaked the hydrogels or the aerogels with.
Results
Bacterial Transformation
We followed the E.Coli competent cells quick protocol FB035 of Promega. We transformed BL21(DE3) cells with our plasmid containing SR-Avitag-10xHis. Cells were incubated on ice for about 10 min before heat shock. 400 µl of SOC medium was added after the heat shock. 100 µl of transformation reaction was plated on LB-Kana plates and the 300 µl left were put in 50 ml of LB-Kana in an Erlenmeyer to do liquid transformation cultures overnight at 37°C under shaking (200rpm).
Figure 1 | Bacterial transformation with the 01b construct in BL21(DE3) competent cells. (A) The plate transformed with 01b. (B) The plate transformed with Tomato plasmid (positive control). (C) The plate transformed with water (negative control). After the overnight incubation, we observed the presence of colonies in the BL21(DE3) transformed cells plates of 01b and the positive control, no colonies were observed on the negative control, as expected.
OD600 measurements: 2.766 was reached the following morning.
- Analysis
The 01b GeneScript plasmid transformation worked well for BL21(DE3) since we can observe colonies on the LB-Kanamycin plates and the OD600 of the transformation liquid culture is high, meaning that many bacteria were able to grow.
Protein Purification
The purification was performed following a Ni-NTA beads based protocol.
Figure 8: Protein purification of silk fusion protein (01a)Both gels were run at 180V for 30 minutes. (A) SDS-PAGE gel stained with Coomassie Blue Protein Stain of all the fractions of silk fusion protein purification. (B) Western Blot of the elution 1 (E1 fraction on SDS-PAGE gel) visualised with anti-His antibody.W1 = Wash 1 with 20 mM imidazole; W2 = Wash 2 with 50 mM imidazole; E1 = Elution 1 with 250 mM imidazole; E2 = Elution 2 with 500 mM imidazole; E3 = Elution 3 with 1M imidazole; E4 = 2.5 M imidazole; E5 = 5 M imidazole.
- Analysis
In both quality controls (fig 8) we obtained a protein around 40kDa which matches the expected size (36.4kDa). However, most of our proteins were in elution 4 (fig 8.A & B), so we had to elution them in a very high amount of imidazole (2.5M). However, we obtained a final concentration of 0.17 mg/mL for a total amount of 1.02 mg of the SR fusion protein (01b). Since high imidazole concentration might denature the proteins, we had to either remove it or make imidazole inert. We therefore decided to flash freeze the proteins and store them in the elution buffers so the imidazole will no longer affect them when frozen.
Cloning by PCR and KLD
The elution of the proteins of interest in such high amounts of imidazole certainly comes from the double His-tag that composes our proteins. To remove it from the received plasmids, we performed some cloning experiments to obtain better yields in the future purifications. In the case of the 03a plasmid (containing GFP) and the 01b plasmid (containing SR), we performed KLD cloning. We amplified the plasmids by PCR without the undesired sequence, and we re-ligated them back by doing a KLD. The KLD reaction allows efficient phosphorylation, intramolecular ligation and template removal in a single 5-minute reaction step at room temperature.

Figure 5 | Cloning experiment results for removal of the added site for 01b (SR) and 03a (GFP). (A) Agarose gel electrophoresis of PCR products of the 01b and the 03a constructs plasmid amplified without the GeneScript additional tags for KLD cloning. (B) Agarose gel electrophoresis for restriction analysis of the 01b and the 03a constructs plasmid after the ligation by KLD. (C) Plasmid map from the sequencing result of the obtained new SR plasmid. (D) Plasmid map from the sequencing result of the obtained new GFP plasmid.
- Analysis
On the agarose gel we ran with the PCR products (fig 5.A), we observed bands around 7000 bp which are the expected sizes and means that we successfully removed the added site. After the KLD, we ran a second agarose gel with fragments obtained by cutting the new plasmids with different restriction enzymes (fig 5.B). We obtained similar patterns as the ones expected. By purifying and sequencing the plasmids(fig 5.C & D), we obtained the exact same sequence as designed. This confirmed that we removed the added site and re-ligated the DNA to obtain the good plasmids.
With several minipreps we obtained big quantities of these new plasmids. We therefore transformed new BL21(DE3) E.Coli competent cells to start the protein production. We couldn’t see a significant protein expression after the IPTG induction for the SR fusion protein. Even if the purification was performed, nothing would be visible in the elution lanes of the SDS-PAGE which suggests that we didn’t successfully purify our new SR fusion protein.
The cloning with PCR amplification and KLD for ligation was a success, but the bacteria were not able to produce our fusion proteins. Our hypothesis is that the number of bp between the RBS and the first Methionine was not optimal for the bacteria. However, by lack of time, we decided not to troubleshoot the reasons for this failure, and we concentrated on the protein production to use them in our further experiments.
| None |
