Part:BBa_K3863007
PHA-flag-PCT-HA
This is a composite part designed to produce bioplastic PHA. PHA synthase 1 from Pseudomonas resinovorans. The protein sequence in this part is based on the K2042001 sequence Evry 2016. propionate CoA transferase from Clostridum propionicum. The protein sequence in this part is based on the K1211001 sequence Yale 2013.
Sequence and Features
- 10INCOMPATIBLE WITH RFC[10]Illegal EcoRI site found at 1411
Illegal PstI site found at 25
Illegal PstI site found at 118
Illegal PstI site found at 208
Illegal PstI site found at 280
Illegal PstI site found at 742 - 12INCOMPATIBLE WITH RFC[12]Illegal EcoRI site found at 1411
Illegal PstI site found at 25
Illegal PstI site found at 118
Illegal PstI site found at 208
Illegal PstI site found at 280
Illegal PstI site found at 742
Illegal NotI site found at 1708 - 21INCOMPATIBLE WITH RFC[21]Illegal EcoRI site found at 1411
- 23INCOMPATIBLE WITH RFC[23]Illegal EcoRI site found at 1411
Illegal PstI site found at 25
Illegal PstI site found at 118
Illegal PstI site found at 208
Illegal PstI site found at 280
Illegal PstI site found at 742 - 25INCOMPATIBLE WITH RFC[25]Illegal EcoRI site found at 1411
Illegal PstI site found at 25
Illegal PstI site found at 118
Illegal PstI site found at 208
Illegal PstI site found at 280
Illegal PstI site found at 742
Illegal NgoMIV site found at 1167
Illegal NgoMIV site found at 1212
Illegal AgeI site found at 448
Illegal AgeI site found at 853
Illegal AgeI site found at 1486 - 1000INCOMPATIBLE WITH RFC[1000]Illegal BsaI site found at 251
Validation of construct expression of K3863007

1a) PHA (BBa_K3863007) qPCR

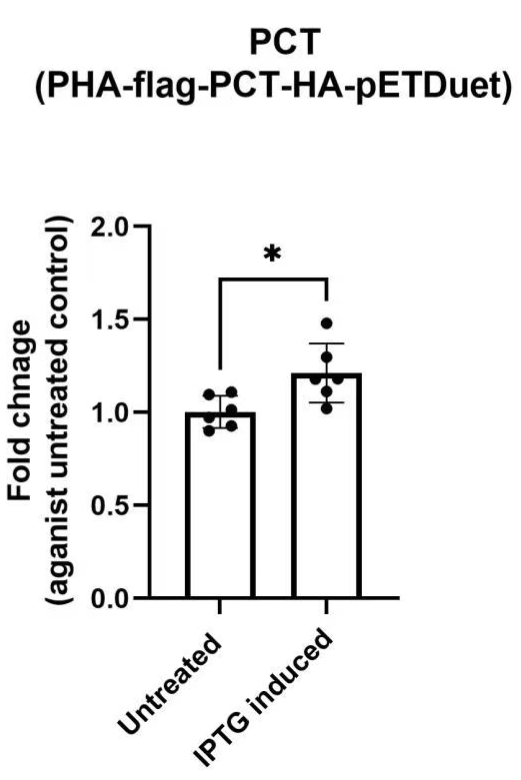
1b) PCT (BBa_K3863007) qPCR
Fig 1. Real-time qPCR fold change of reference gene
To future confirm that our constructs have the expression level, we have performed RT-qPCR The RT-qPCR results show that we have successfully assembled target genes K3863008 to the vector (pETDuet).
Validation of Bioplastic Production
In order to observe the conversion performance, infrared spectroscopic analysis was applied since PHA , PLA and PhaC have their particular functional group in chemical structure, and are performed in particular wavelengths. The absorption peak of PLA is at 1081, 1188, 1364, 1452 , 1751 cm-1[1], whereas the absorption peak 979, 1057, 1100, 1282, 1723, 2934, 2977cm-1[2]. We have compared and analyse the peak of the wavelength to confirm the bioplastic product we have produced. In Figure 2, no absorption peak of PHA and PLA was identified, which indicated that the vector (pETDuet Vector) cannot give the desired product. On the other hand, the absorption peaks of PHA and PhaC were identified after incubation, which suggested that the BBa_K3863004 and BBa_K3863008, the bioplastic performs significantly in the transformation process. Furthermore, the absorption peaks of PHA were found, which showed that BBa_K3863007 performs well and was the product that we expected to have. These results have proven that the bioplastic that we have produced can be formed significantly with BBa_K3863004, BBa_K3863008 and BBa_K3863007.

Fig 2a. IR spectrum of pETDuet vector

Fig 2b. IR spectrum of BBa_K3863007
Quantitative Measure of Bioplastic Production
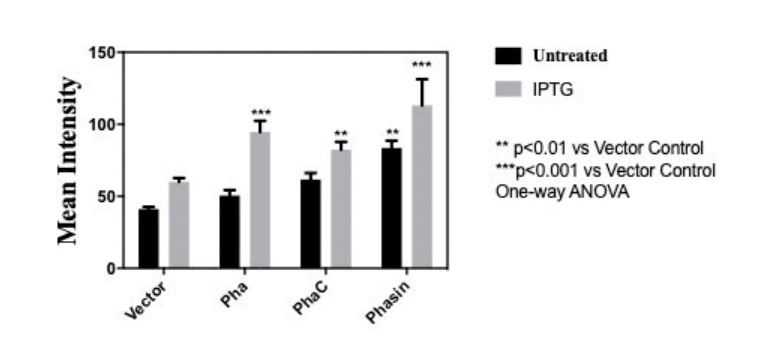
In order to measure the amount of bioplastic produced, we used 20 microgram Nile Red (sigma aldrich N3013) per milliliter of agar to make a Nile agar plate and streak the cell culture (PHA, PhaC, Phasin) on the plate. After incubating for 2 days at 37 celsius in darkness. Stereomicroscope (Nikon SMZ18) is used to measure the intensity of Nile red.

Fig 3.Mean intensity of Nile red for quantitative measure of bioplastic production of (BBa_K3863007(PHA), BBa_K3863004(PhaC), BBa_K3863008(Phasin))
Reference
[1]https://www.ncbi.nlm.nih.gov/pmc/articles/PMC3450024/pdf/12088_2009_Article_31.pdf
[2]https://www.researchgate.net/figure/Fourier-transform-infrared-FTIR-spectra-of-PLA-PEG-PLA-PEG-blend-and-PLA-PEG-xGnP_fig1_277675367
| None |
