Part:BBa_J23116
constitutive promoter family member
Variant RFP (au) J23112 1 J23103 17 J23113 21 J23109 106 J23117 162 J23114 256 J23115 387 J23116 396 J23105 623 J23110 844 J23107 908 J23106 1185 J23108 1303 J23118 1429 J23111 1487 J23101 1791 J23104 1831 J23102 2179 J23100 2547 |
Constitutive promoter family
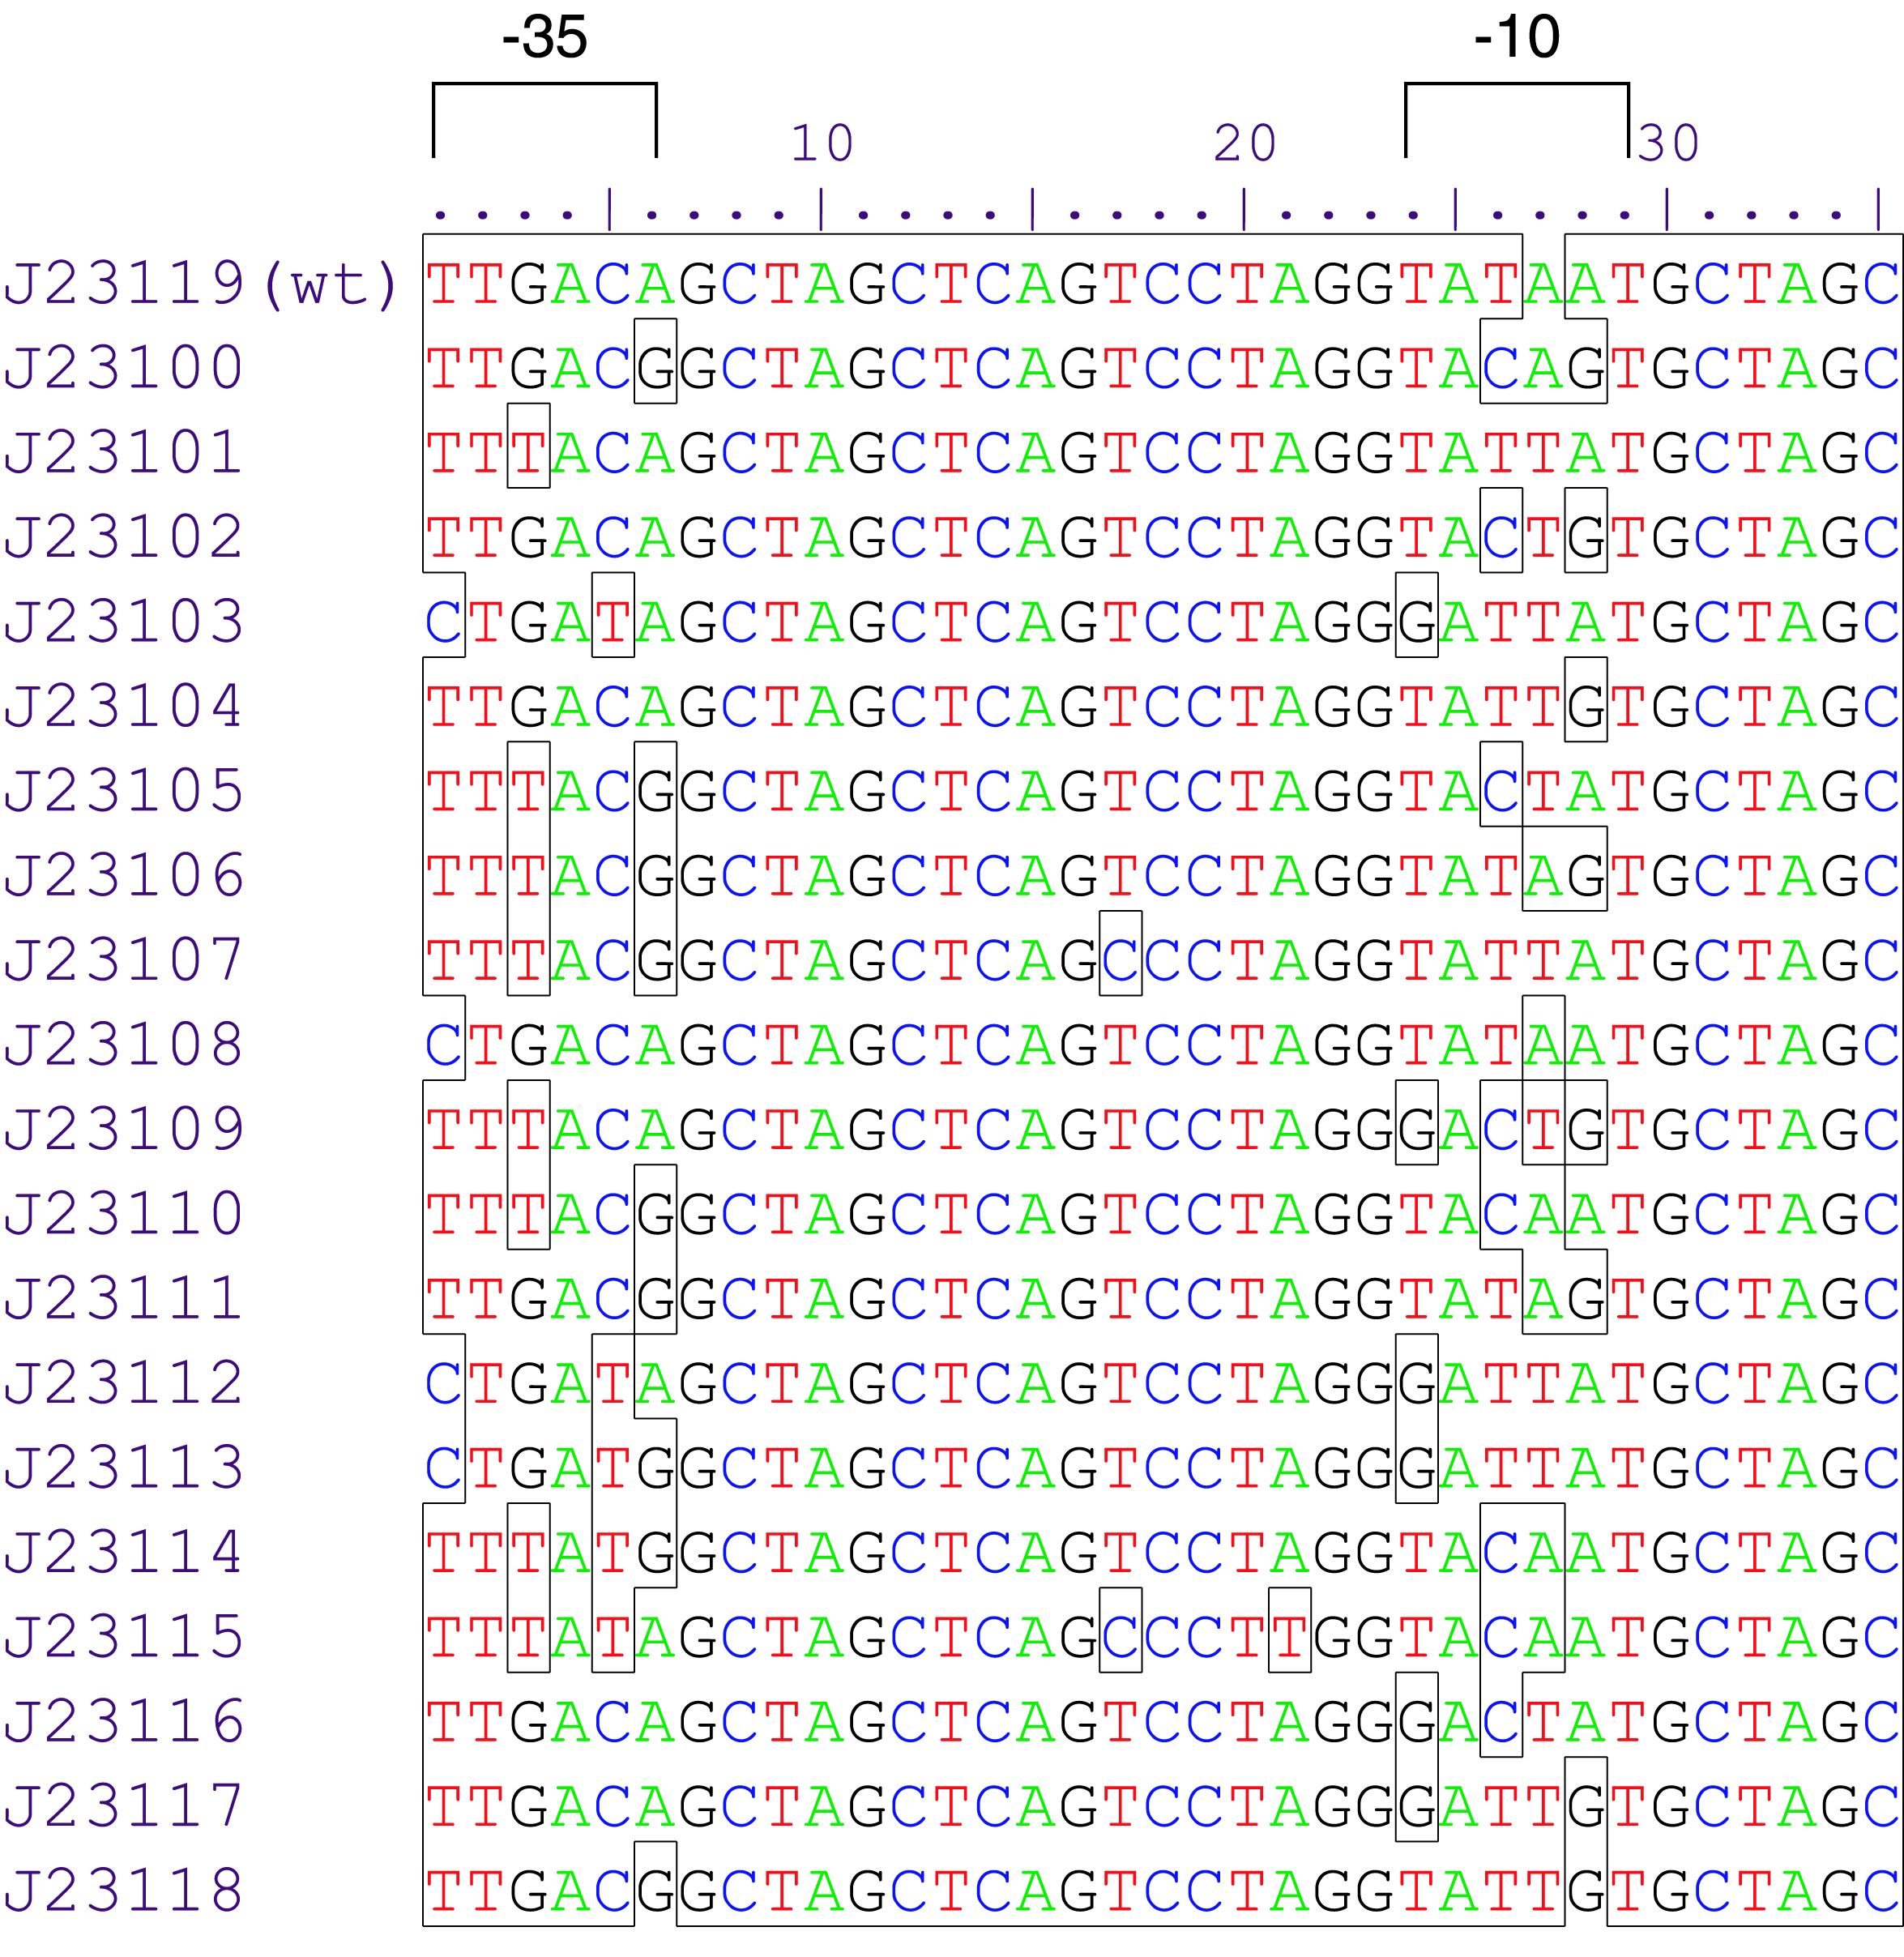
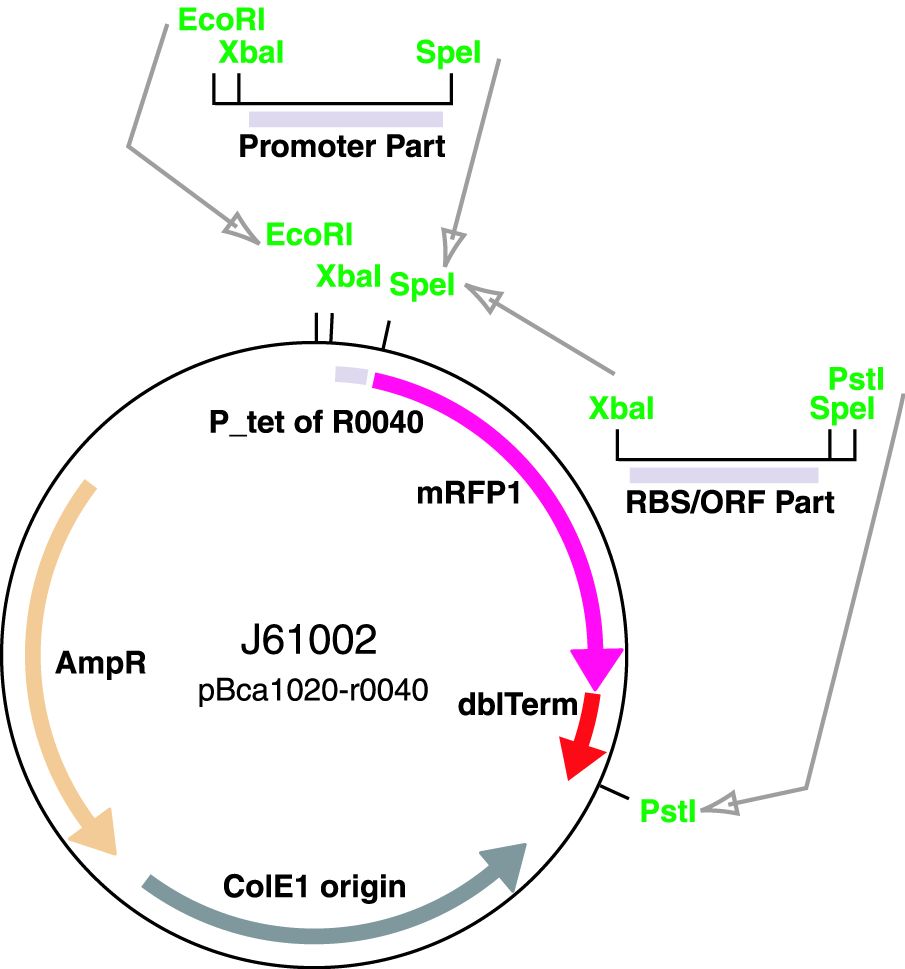
Parts J23100 through J23119 are a family of constitutive promoter parts isolated from a small combinatorial library. J23119 is the "consensus" promoter sequence and the strongest member of the family. All parts except J23119 are present in plasmid J61002. Part J23119 is present in pSB1A2. This places the RFP downstream of the promoter. Reported activities of the promoters are given as the relative fluorescence of these plasmids in strain TG1 grown in LB media to saturation. See part BBa_J61002 for details on their use.
These promoter parts can be used to tune the expression level of constitutively expressed parts. The NheI and AvrII restriction sites present within these promoter parts make them a scaffold for further modification. JCAraw
Usage and Biology
Gaston Day School Characterization 2020
Group: Gaston Day School iGEM 2020
We incorporated the weak Anderson Promoter J23116 into our argK expression design. We built a MATLAB model and simulated it using the ode45 solver. The results are shown below in the figure. We calculated the transcription rate in M/min per cell from the promoter activity (polymerase per second per cell). We derived the reference promoter (J23101) activity value from (Kelly, 2009). According to the original measurement of relative promoter strength provided in the registry, J23116 is (396/1791) times the strength of the reference promoter; adopting a similar method used by Team:Sydney_Australia 2016, we multiply the promoter activity of J23101 by the ratio of 396:1791 and got out the value of 0.066332 PoPS per cell. Since our plasmid has an average copy number of 200 per cell, the total expression per cell is equivalent to 1.3266 molecules per second per cell. We converted this value to transcription rate in the unit compatible to those of most of the gene expression parameters so that future teams can also use the this value in their initial simulations. (Many available gene expression model parameters use molar and minute as the unites.) We finally attained the value 2.203* 10^-7 M/min for the transcription rate. This parameter provides a baseline for initial simulations. However, previous teams have found out that the expression level can vary depending on E. coli strains. The promoter activity also does not completely represent the transcription efficiency (e.g. Polymerase travels at a different speed at different points on a DNA sequence.) Therefore, the future teams need to experimentally optimize the parameter for their own experiments.
We simulated our model, and the graph below shows the argK expression level under J23116.

The additional information about the modeling results can be found on our wiki. Our results suggested that even though J23116 yields lower expression compared to strong Anderson Promoters like J23100, it is most likely that J23116 can still provide sufficient expression level of genes in the cell because of the over-expression. A critical factor for metabolic engineering is to help the cell to maintain expedient level of pathway proteins so the metabolic pathway is able to maintain healthy and efficient. High gene expression level under strong constitutive promoters, especially those that are related to the cell’s own metabolic pathways, can potentially disrupt the cell’s metabolism, damage the cell’s function, and even cause the death of the cells. Weak constitutive promoters, on the other hand, satisfy the consistent needs for gene expression and ensures that the protein production is low enough to avoid interruptions to cell metabolism. Our past experience (Gaston Day School 2018) also suggests that J23116 serves as a good candidate for metabolic engineering. References: <p>Fakruddin, M., Mohammad Mazumdar, R., Bin Mannan, K. S., Chowdhury, A., & Hossain, M. N. (2012). Critical Factors Affecting the Success of Cloning, Expression, and Mass Production of Enzymes by Recombinant E. coli. ISRN biotechnology, 2013, 590587. https://doi.org/10.5402/2013/590587
Sequence and Features
- 10COMPATIBLE WITH RFC[10]
- 12INCOMPATIBLE WITH RFC[12]Illegal NheI site found at 7
Illegal NheI site found at 30 - 21COMPATIBLE WITH RFC[21]
- 23COMPATIBLE WITH RFC[23]
- 25COMPATIBLE WITH RFC[25]
- 1000COMPATIBLE WITH RFC[1000]
|
•••••
University of Texas at Austin iGEM 2019 |
UT Austin iGEM 2019: Characterization of metabolic burden of the Anderson SeriesDescriptionThe 2019 UT Austin iGEM team transformed the Anderson Series promoters into our 'burden monitor' DH10B strain of E. coli, which contains a constitutive GFP cassette in the genome of the cell. GFP expression fluctuates depending on the number of ribosomes available. Using this strain, we characterized the relative burden (percent reduction in growth rate) of each Anderson Series part. Our results showed a range of growth rate reductions for each of these parts due to ribosomal reallocation from the genome of the host cell, towards the expression of RFP. Anderson Series parts with strong promoters are depicted with darker red colors and Anderson Series parts with weak promoters are depicted with lighter pink colors to show relative RFP expression. We saw a positive correlation between relative promoter strength and metabolic burden; parts with stronger promoters expressed less GFP and had a lower growth rate than parts with weaker promoters. The regression line for the graph below was constructed by measuring the burden of 5 parts that were created by the 2019 UT Austin iGEM team that each contained an Anderson Series promoter (BBa_J23104 or BBa_J23110), an RBS of varying strength, and a BFP reporter. For more information on characterization of these parts through the burden monitor, visit our team’s wiki page: [1]
Importance of Characterizing BurdenAlthough often we cannot avoid using a specific burdensome part, knowing in advance that it is burdensome, and that it has a high chance of mutating into a non-functional genetic device, can help with troubleshooting and coming up with alternatives. In the specific case of fluorescent protein-expressing devices, Fluorescence-activated cell sorting (FACS) can be used to filter out individual cells that meet a certain fluorescence threshold. This way, the cells expressing lower levels of the fluorescent protein are weeded out of the population. |
//direction/forward
//promoter/anderson
//regulation/constitutive
//rnap/prokaryote/ecoli/sigma70
| negative_regulators | |
| positive_regulators |

 1 Registry Star


