Part:BBa_K2933002
subclass B3 metallo-beta-lactamase SPG-1, codon optimized in E. coli
This part encodes a protein called SPG-1, which is a metallo-beta-lactamase of subclass B3.
Sequence and Features
- 10COMPATIBLE WITH RFC[10]
- 12COMPATIBLE WITH RFC[12]
- 21COMPATIBLE WITH RFC[21]
- 23COMPATIBLE WITH RFC[23]
- 25COMPATIBLE WITH RFC[25]
- 1000COMPATIBLE WITH RFC[1000]
Usage and Biology
blaSPG-1, a new carbapenem-hydrolyzing beta-lactamases , is analyzed from Sphingomonas sp. in the soil microbiota. This enzyme has not yet emerged in clinical settings but constitute potential carbap- enem resistance determinants in pathogenic bacterial species, as demonstrated by their ability to confer resistance to ampi- cillin and various cephalosporins, as well as reduced suscepti- bility to carbapenems, once expressed in E. coli.
Molecular cloning
First, we used the vector pET28b-Sumo to construct our expression plasmid. And then we converted the plasmid constructed to E. coli DH5α to expand the plasmid largely.
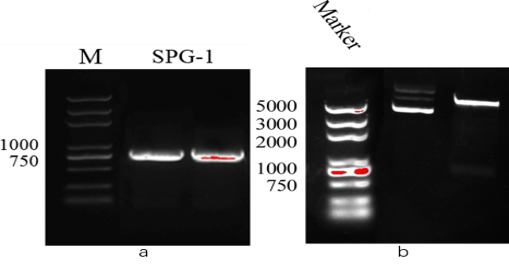
Figure 1. a: The PCR result of SPG. b: The verification results by enzyme digestion.
After verification, it was determined that the construction is successful. We converted the plasmid to E. coli BL21(DE3) for expression and purification.
Expression and purification
Pre-expression:
The bacteria were cultured in 5mL LB liquid medium with ampicillin(100 μg/mL final concentration) in 37℃ overnight.
Massive expressing:
After taking samples, we transfered them into 1L LB medium and add antibiotic to 100 μg/mL final concentration. Grow them up in 37°C shaking incubator. Grow until an OD 600 nm of 0.8 to 1.2 (roughly 3-4 hours). Induce the culture to express protein by adding 1 mM IPTG (isopropylthiogalactoside, MW 238 g/mol). Put the liter flasks in 16°C shaking incubator for 16h.
Affinity Chromatography:
We used the Ni Agarose to purify the target protein. The Ni Agarose can combine specifically with the Ni-Sumo tag fused with target protein.
- First, wash the column with water for 10 minutes. Change to Ni-binding buffer for another 10 minutes and balance the Ni column.
- Second, add the protein solution to the column, let it flow naturally and bind to the column.
- Third, add Ni-Washing buffer several times and let it flow. Take 5ul of wash solution and test with Coomassie Brilliant Blue. Stop washing when it doesn’t turn blue.
- Forth, add Ni-Elution buffer several times. Check as above.
- Fifth, collect the eluted proteins for further operation.
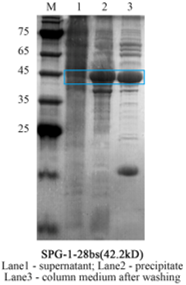
Figure 2. The result of SDS-page.
Anion exchange column:
According to the predicted pI of the protein and the pH of the ion-exchange column buffer, firstly select the appropriate ion exchange column (anion exchange column or cation exchange column). The pH of buffer should deviate from the isoelectric point of the protein. Since the isoelectric point of our protein is 9.42 in theory, we choose buffer pH of 7.4 and use anion exchange column for purification.
The protein is concentrated with a 10KD concentration tube, and then the exchange buffer is used to exchange the protein to the ion-exchange liquid A. Finally, it is concentrated to less than 5ml by centrifuging at 4℃ and 3400rpm for 10 minutes in a high-speed centrifuge to remove insoluble substances and bubbles.
Balance the selected column with liquid A. Through the AKTApure protein purification system, the samples are loaded to the column at a flow rate of 0.5ml/min, and continue washing for 5min. Gradually increase the content of liquid B in the column, change the salt concentration and then change the interaction between the sample and the column, and collect the corresponding eluent according to the position of the peak. Use SDS-PAGE to check the result.
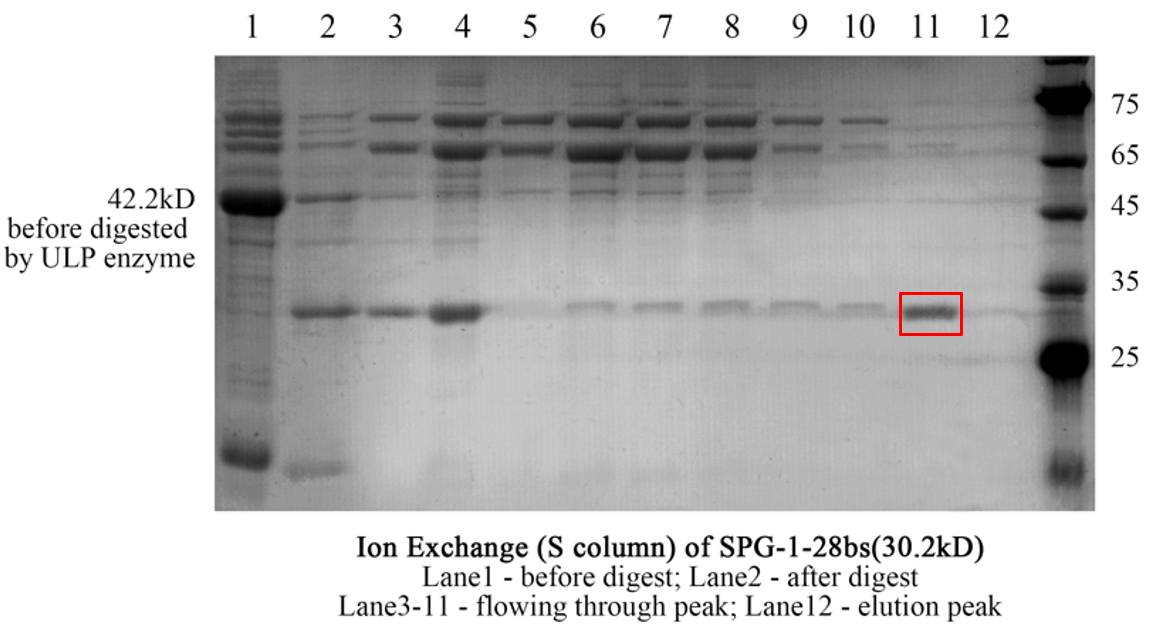
Figure 3. The result of SDS-page of Hitrap S column.
Gel filtration chromatography:
The collected protein samples are concentrated in a 10 KD concentrating tube at a speed of 3400 rpm and concentrated for a certain time until the sample volume is 500 μl. At the same time, the superdex 75 column is equilibrated with a buffer to balance 1.2 column volumes. The sample is then loaded and 1.5 cylinders are eluted isocratically with buffer. Determine the state of protein aggregation based on the peak position and collect protein samples based on the results of running the gel.
 ]
]
Figure 4. (a) The result of gel filtration used the superdex75 column with the AKTA system, which shows that the target protein is monomeric. (b) The result of SDS-PAGE. And the target protein is about 30.2kD.
Enzyme activity determination
We used CDC-1, a probe with a similar structure from the beta lactam ring and a luminescent group for enzyme activity measurements. For more information on the substrate CDC-1, please see our project introduction.
Materials:
General 96-well plates (Black)
Infinite M1000 Pro Automatic Microplate Reader
Multi-channel adjustable pipette
Ultrasonic Cleaner
Buffer:
100% DMSO
Fluorescent Probe(CDC-1)
Target Enzyme(beta-lactamase)
Determination of enzyme concentration
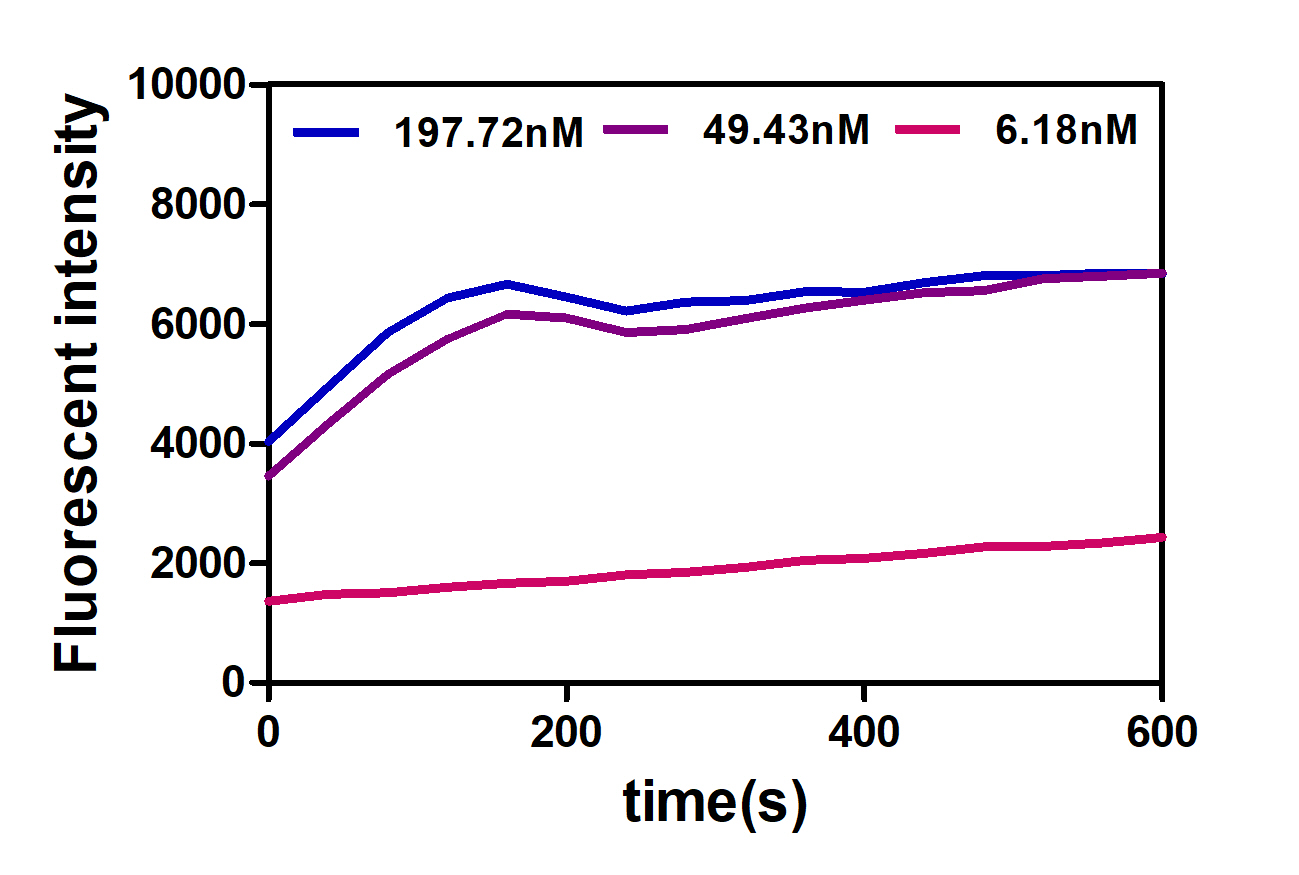
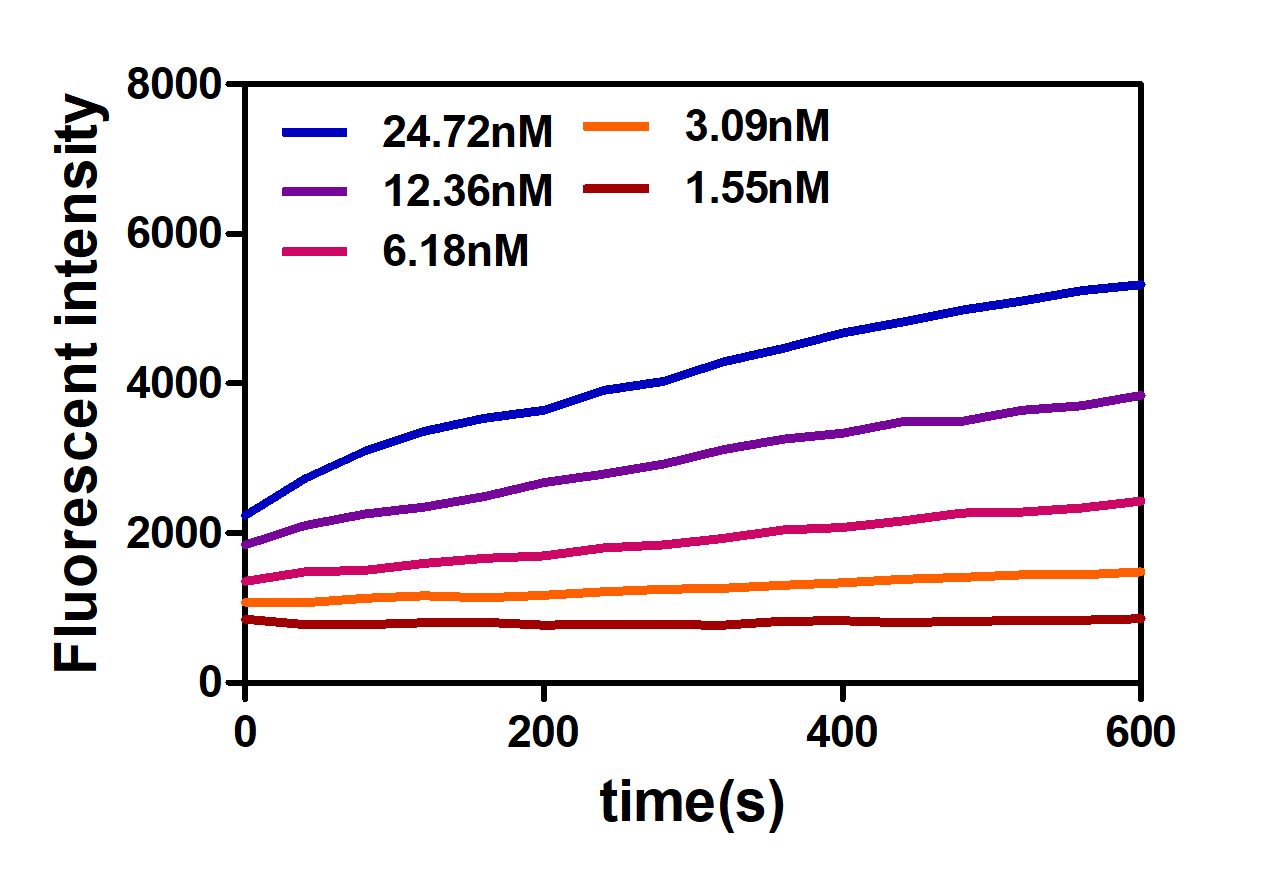
Figure 2. The concentration of CDC-1 was fixed at 10.5 μM and the enzyme concentration was changed within a certain range, and the fluorescence value was measured with a function of reaction time. Left:First, we selected three gradient concentrations (with large intervals) for pre-experiment, and determined the gradient range of the formal experiment through the experimental results. Right:The appropriate enzyme concentration was selected for determination of the gradient, and the reaction curve of gradual rise was obtained.
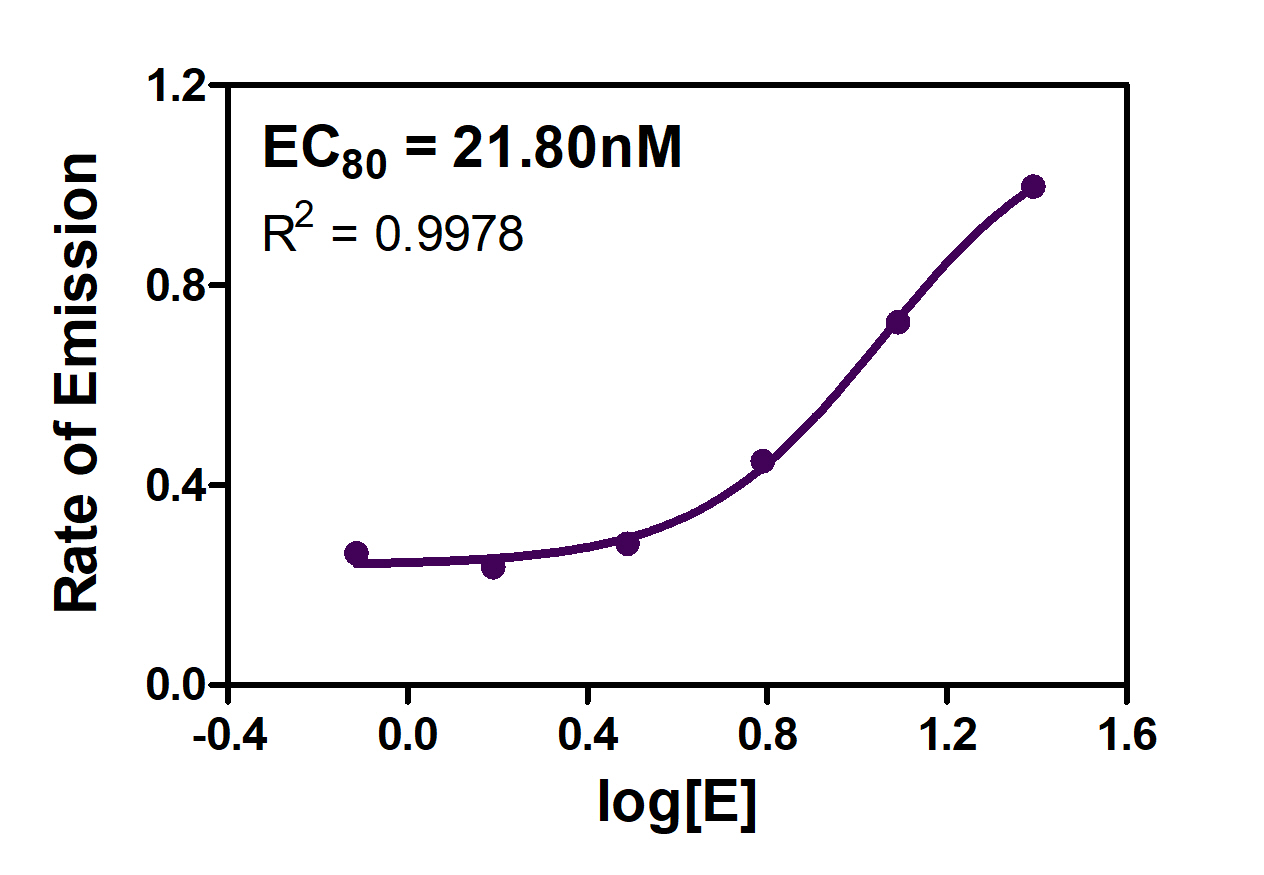
Figure 3. We took the emission fluorescence at 24.72nm as the maximum emission fluorescence, and took the logarithm value of different SPG enzyme concentrations to make the relationship curve between protein concentration and fluorescence emission rate. When the emittance of the system was 80%, the protein concentration was 21.80nM, that is, EC80 was 21.80nM.
Determination of the buffer composition
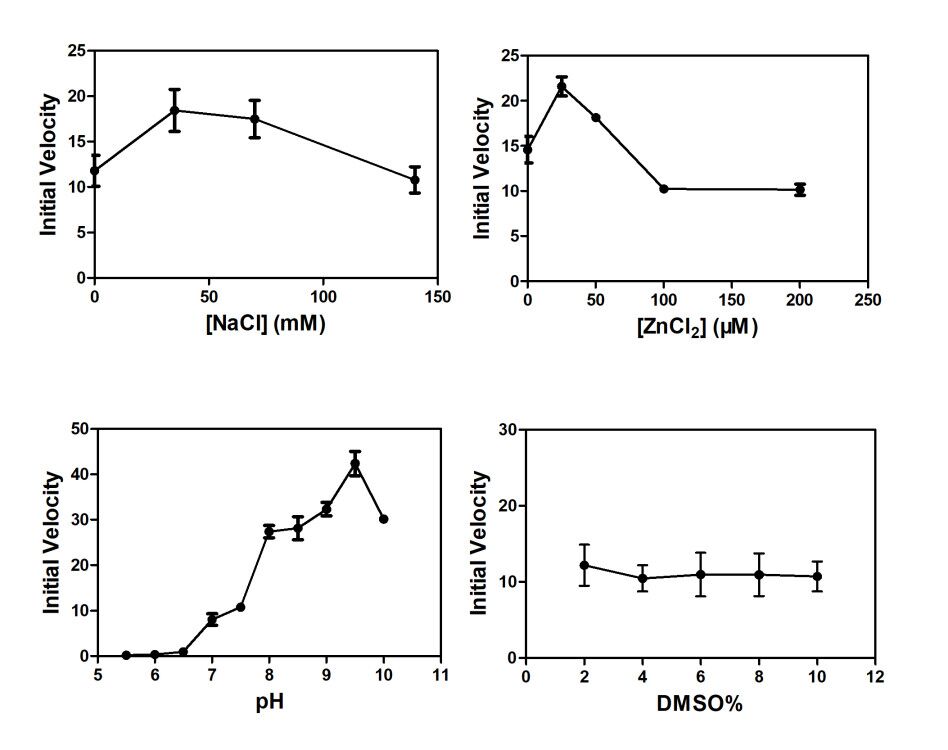
Figure 4. Effect of different buffer condition on enzyme activity.
According to the experimental results, we chose NaCl concentration of 35mM, ZnCl concentration of 25 micron and pH of 9.5.
Determination of substrate concentration
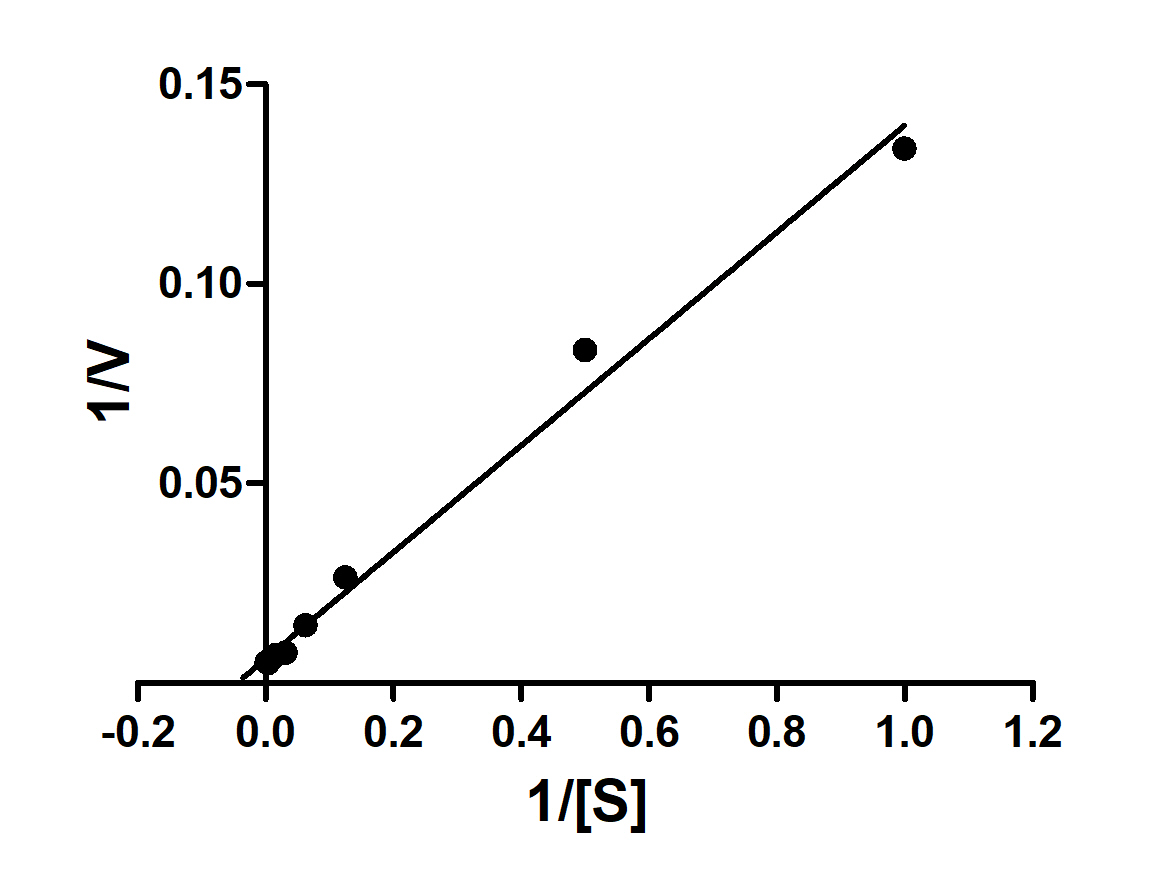
Figure 5. The relationship between the substrate concentration and the maximum initial rate was obtained by using the Lineweaver-Burk plot.
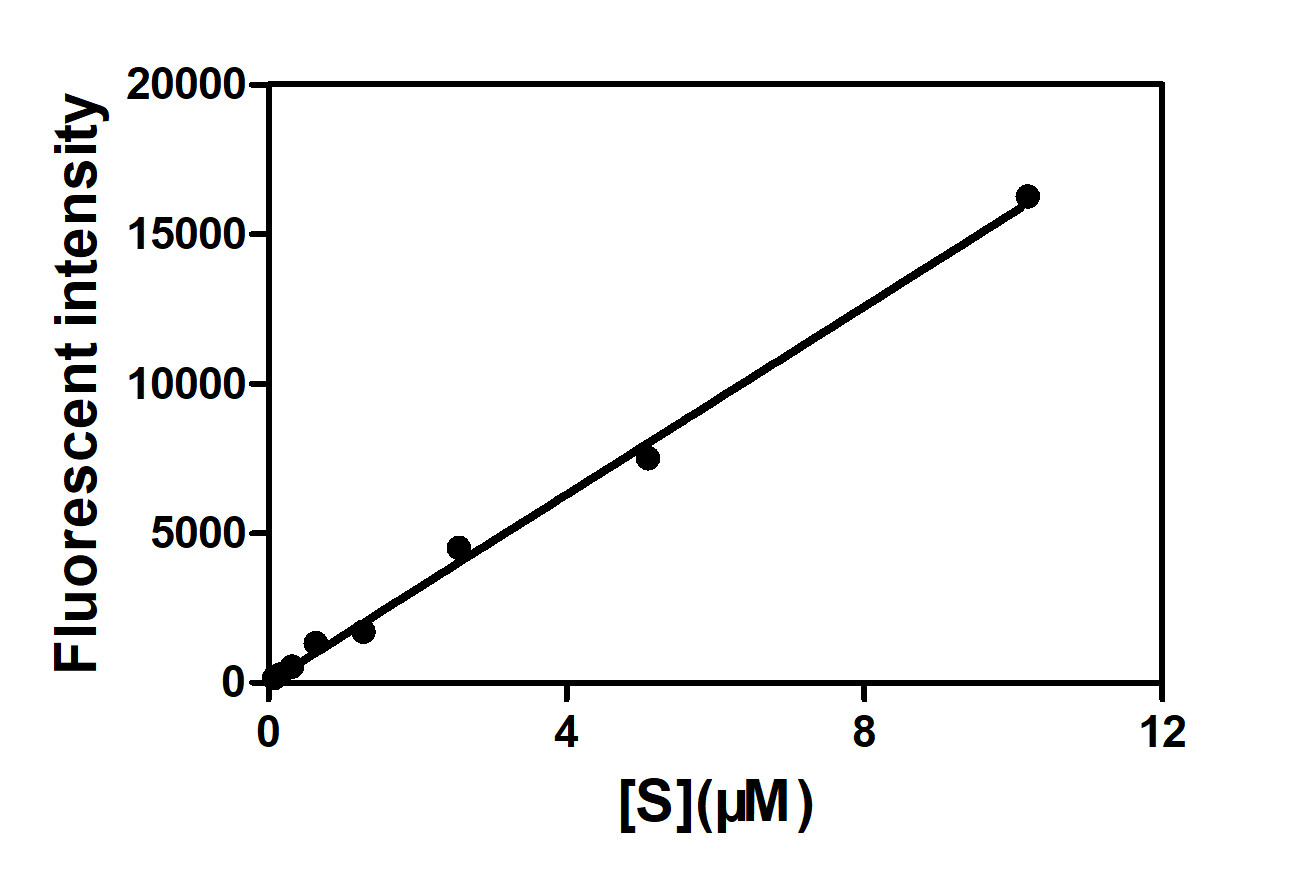
Figure 6. The relationship between the maximum fluorescence value and substrate concentration.
Calculate Km, Vm with the Lineweaver-Burk plot, because it fit better. Kcat values were calculated with the results of maximum fluorescence values at different substrate concentrations.
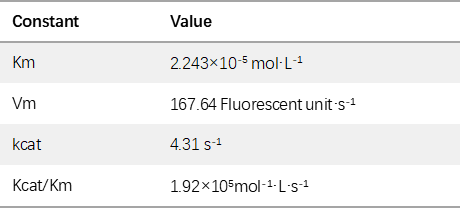
Figure 7. The enzyme kinetic parameter of SPG.
Establishment of SPG-1 inhibitor screening system
After the above determination of enzyme activity and the trial of concentration and buffer components, we determined the optimal conditions of NDM-23 enzyme activity and then established the screening system.
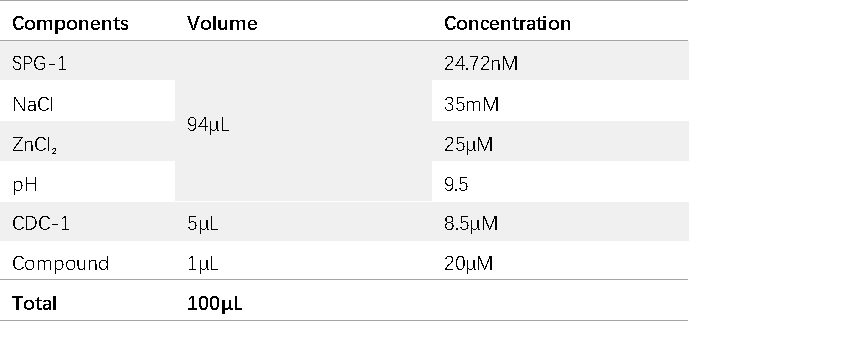
Figure8. Protein concentration and optimal buffer components and the inhibitor screening system of SPG-1.
Effective inhibitors in vitro we founded
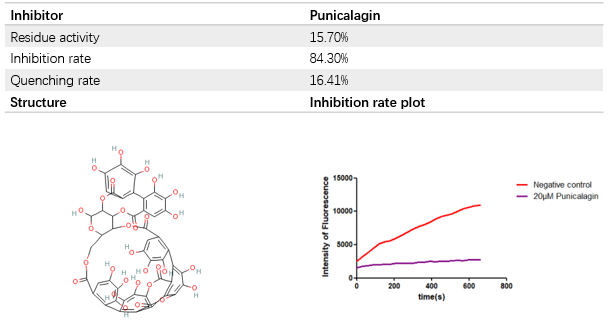
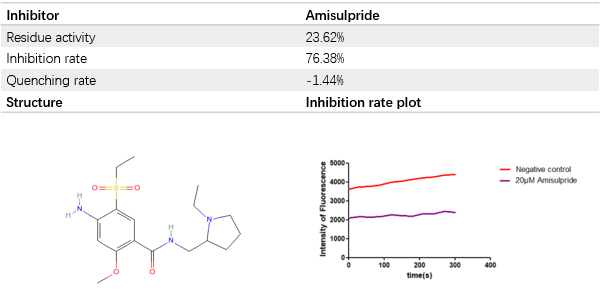
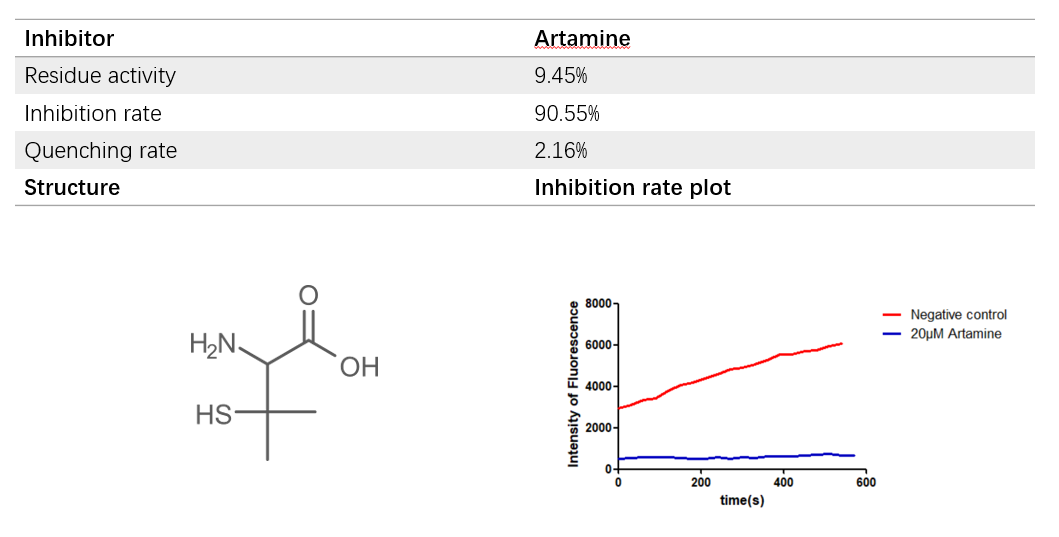
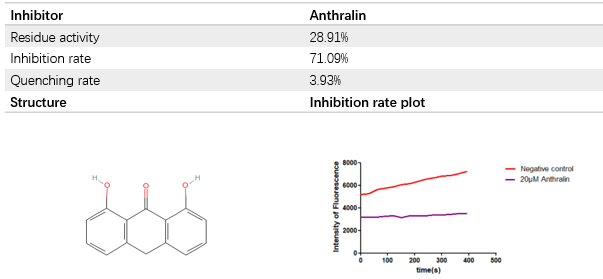
Above, we have established the SPG-1 high-throughput screening system, and then we used the microplate reader to conduct high-throughput screening to screen out Tannic acid with significant inhibitory effect on SPG-1 from the drug library containing over 1000 small molecules which are natural products extracted from traditional Chinese medicine.
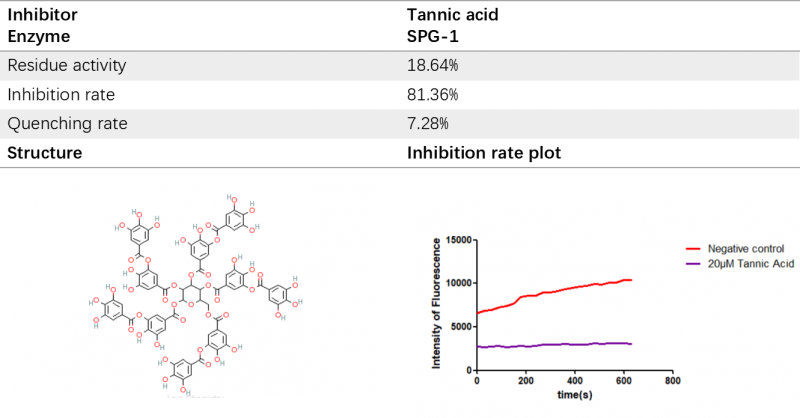
Extracorporeal IC50
We tested the IC50 of two inhibitors.
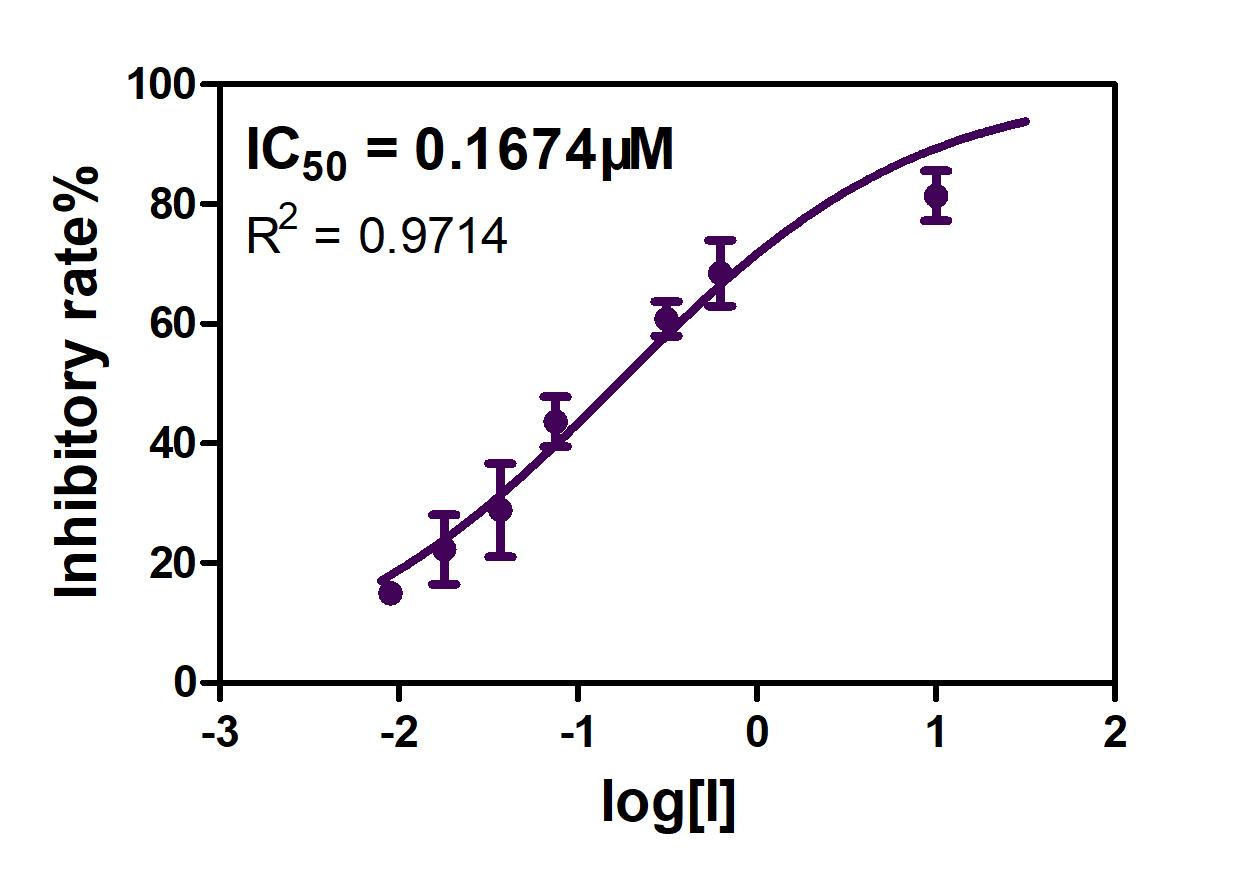
Figure 9. The IC50 of Tannic acid.
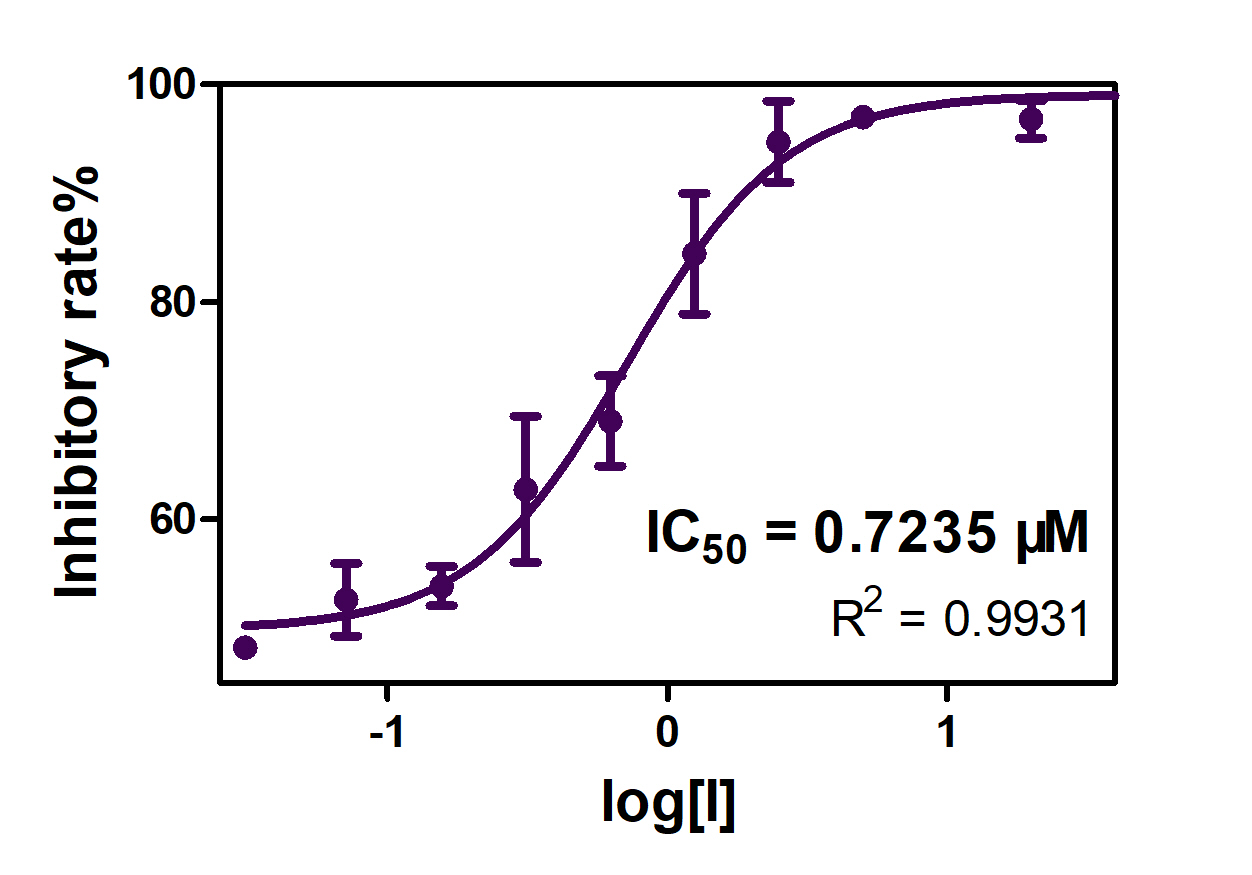
Figure 10. The IC50 of Punicalagin.
Monitoring in living bacterial cells with antibiotics
After high-throughput screening, tannic acid was screened as the inhibitor of SPG-1. We have used the UV visible method to assess the effectiveness of the treatment. The results are as follows:
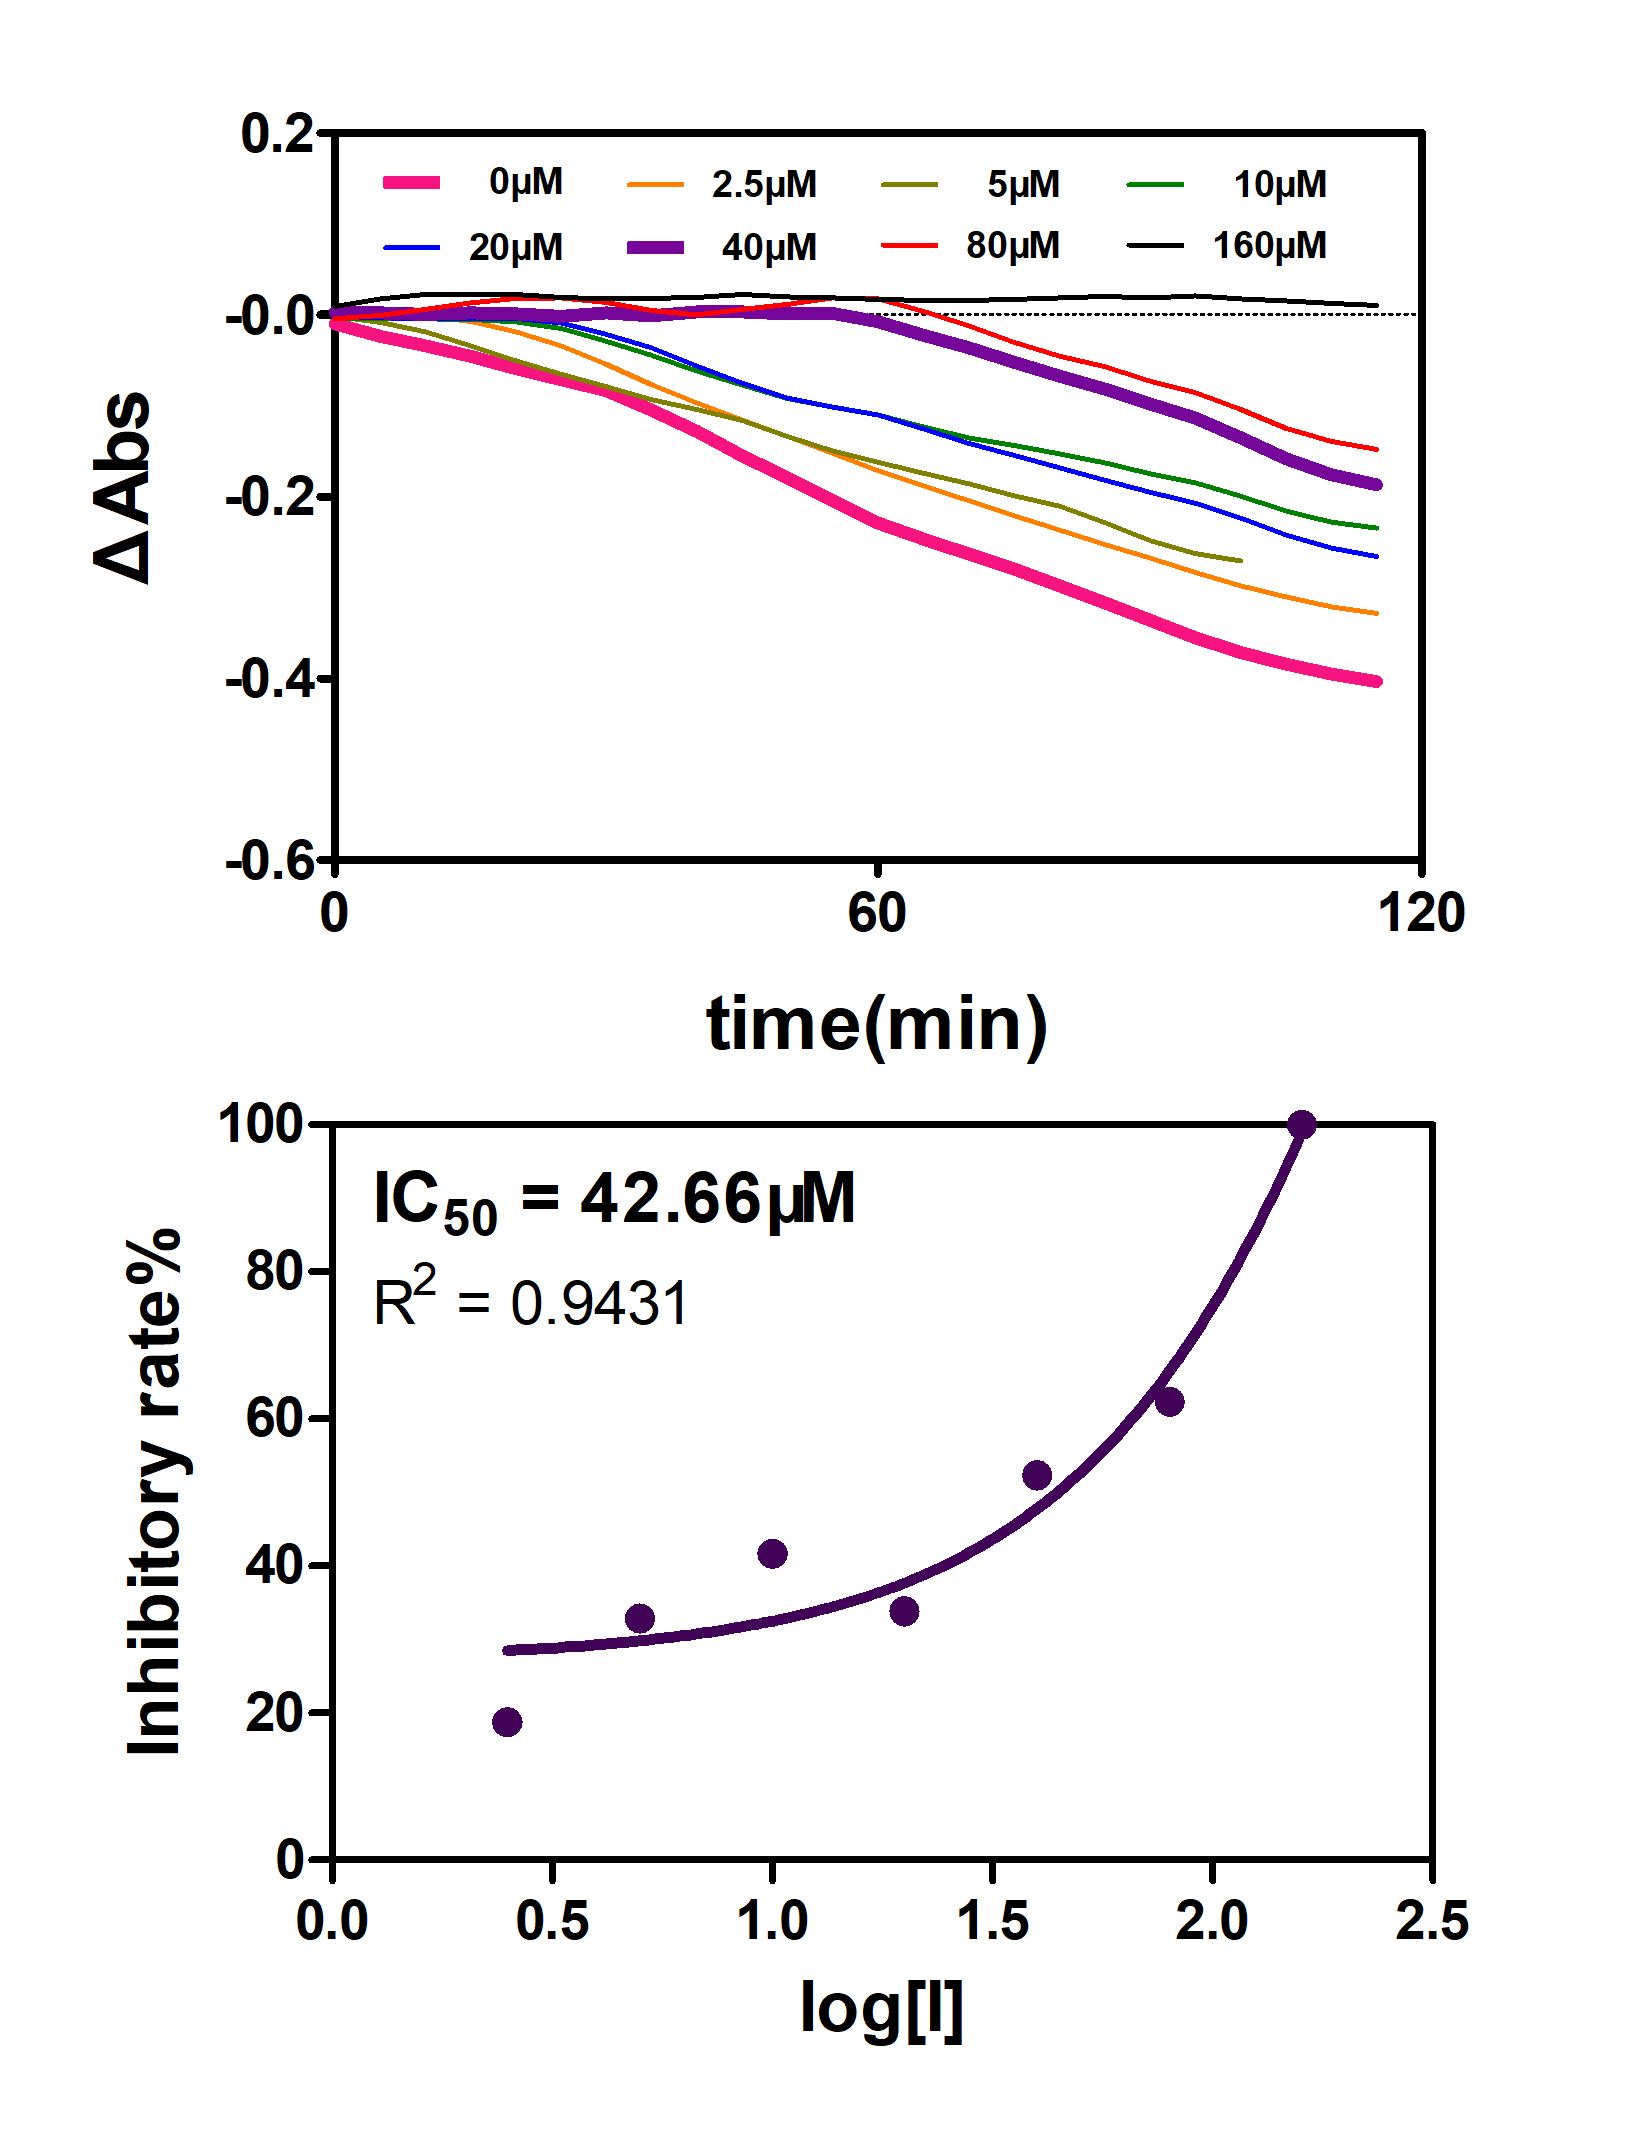
Figure 11. Monitoring in living bacterial cells with antibiotics and Tannic acid.
References
[1]The Soil Microbiota Harbors a Diversity of Carbapenem-Hydrolyzing β-Lactamases of Potential Clinical Relevance. Gudeta DD, Bortolaia V, Amos G, Wellington EM, Brandt KK, Poirel L, Nielsen JB, Westh H, Guardabassi L. Antimicrob Agents Chemother. 2015 Oct 19;60(1):151-60.
| None |
