Part:BBa_I746909:Experience
This experience page is provided so that any user may enter their experience using this part.
Please enter
how you used this part and how it worked out.
Applications of BBa_I746909
2019 iGEM team Gunma Japan
2019 iGEM team Gunma Japanvalidated this part in BL21(DE3).
Fig.1 This is our Abs600 Standard Curve measured by PerkinElmer,Multipmode Plate Reader.
Fig.2 This is our Fluorescein Standard Curve measured by PerkinElmer,Multipmode Plate Reader(Exc485 nm,Ems530 nm).
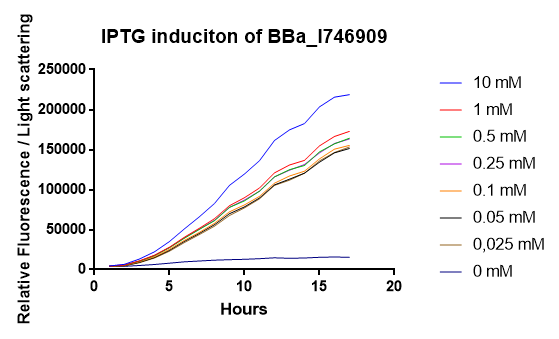
Fig.2 This figure shows the fluorescence is highly proportional to Abs600,the concentration of microorganisms. This means the GFP fluorescence is to be precisely expressed by the microorganisms. One colony of BE21(DE3)pSB1C3 BBa I746909 each from 2 plates were picked and cultured in 5 mL LB medium with 34 μL/mL Cam for 6.25 hours in falcon tubes,37℃. We conducted 2 biological and 4 technical replicates. Then these are diluted to be OD600 = 0.1.before added 500 μM IPTG.Abs600 and fluorescence of GFP were measured.All measurements went on under controlled temperature (25 ℃).
Fig.3 We also checked whether the colonies on plates are expressing GFP that derives from pSB1C3 BBa I746909 by directly putting 100 μM and 300 μM IPTG onto the colonies in hemisphere by pipettes.We note that this also means we could check the appropriate concentration for this time, for the teams who read this later.100 μM worked enough, but 300 μM seemed to have induced GFP more strongly.We recommend you 300 μM as a better choice.
Fig.4 The plates were also observed under visible light.We spotted a strong light toward the plates for 10 sec in advance to emphasize the difference between them.
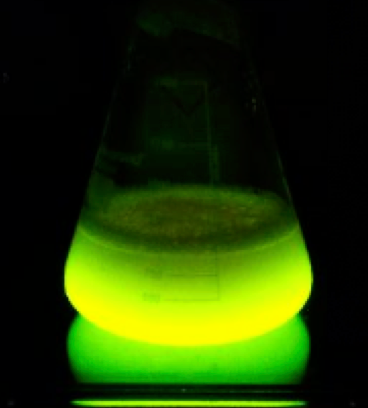
Fig.5 The BL21(DE3) in LB medium were also observed under visible light too. They were easily distinguished in room.
2018 iGEM team Linkoping Sweden
2018 iGEM team Linkoping Sweden validated this part.
[http://2014.igem.org/Team:Imperial iGEM Team Imperial
[http://2014.igem.org/Team:Aachen iGEM Team Aachen
The iGEM Team Aachen used the biobrick I746909 to test their [http://2014.igem.org/Team:Aachen/Project/2D_Biosensor sensor chip technology].

|
| Testing I746909 in sensor chips I746909 in sensor chips induced with 2µl IPTG and measured with a plate reader. Top chip is not induced, bottom chip is induced with IPTG. |
The biorbick I746909 was also used to test the measurement device [http://2014.igem.org/Team:Aachen/Project/Measurement_Device WatsOn].

|
| Testing I746909 in WatsOn I746909 in sensor chips induced with 2µl IPTG and measured with WatsOn. Left chip is not induced, right chip is induced with IPTG. |
2015 iGEM team Bielefeld-CeBiTec
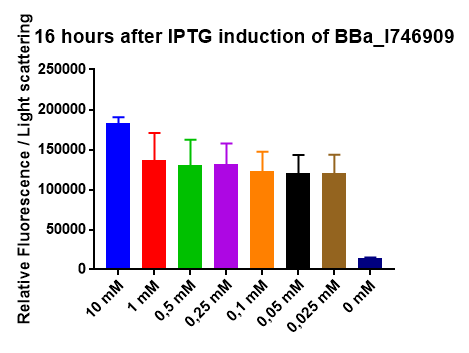
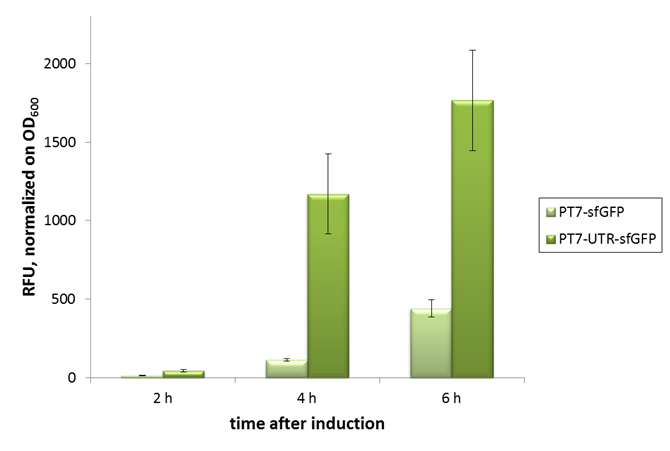
2015 iGEM team Bielefeld-CeBiTec used this part and improved it by addition of a designed, translation enhancing 5'-untranslated region (5'-UTR; BBa_K1758100). You can find further information at BBa_K1758102).
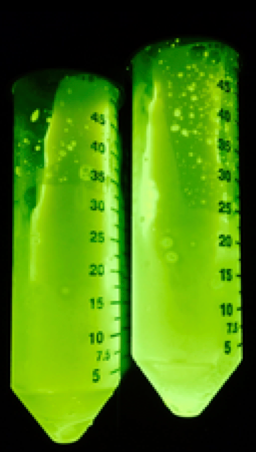
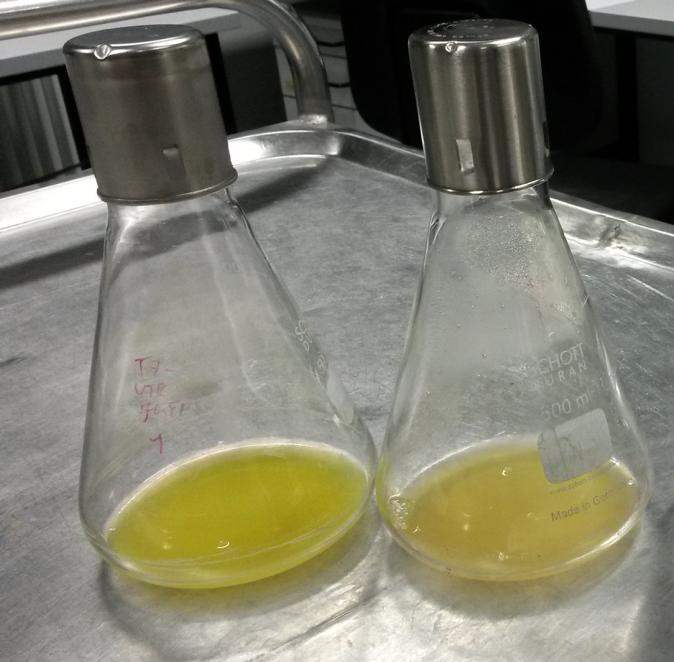
As can be seen in the picture, the difference was observable with the naked eye as well.
[http://2014.igem.org/Team:Imperial iGEM Team Imperial
[http://2014.igem.org/Team:Aachen iGEM Team Aachen
The iGEM Team Aachen used the biobrick I746909 to test their [http://2014.igem.org/Team:Aachen/Project/2D_Biosensor sensor chip technology].

|
| Testing I746909 in sensor chips I746909 in sensor chips induced with 2µl IPTG and measured with a plate reader. Top chip is not induced, bottom chip is induced with IPTG. |
The biorbick I746909 was also used to test the measurement device [http://2014.igem.org/Team:Aachen/Project/Measurement_Device WatsOn].

|
| Testing I746909 in WatsOn I746909 in sensor chips induced with 2µl IPTG and measured with WatsOn. Left chip is not induced, right chip is induced with IPTG. |
User Reviews
UNIQ497255ca82c2811d-partinfo-00000007-QINU UNIQ497255ca82c2811d-partinfo-00000008-QINU

 1 Registry Star


