Part:BBa_K2728004
GFA - A Glutathione-Dependent Formaldehyde-Activating Enzyme
Basic Description
An enzyme from Paracoccus denitrificans that accelerates this spontaneous condensation reaction, which catalyze the conversion of formaldehyde and glutathione was purified and named glutathione-dependent formaldehyde-activating enzyme (Gfa).
The gene GFA is located directly upstream of the gene for glutathione-dependent formaldehyde dehydrogenase, which catalyzes the subsequent oxidation of S-hydroxymethylglutathione. The glutathione-dependent formaldehyde conversion to formate starts with the adduct formation, formaldehyde reacts with the SH group of glutathione producing S-hydroxymethylglutathione (Reaction 1).
Fig 1: Thiol-dependent pathway
Formaldehyde-converting enzymes-Gfa is composed of one type of subunit of about 20 kDa and lack a chromophoric prosthetic group. In addition, both enzymes are encoded next to genes for enzymes involved in further oxidation of the cofactor-bound one-carbon unit to carbon dioxide.
Fig 2: 3D structure (from www.uniprot.org)
Sequence
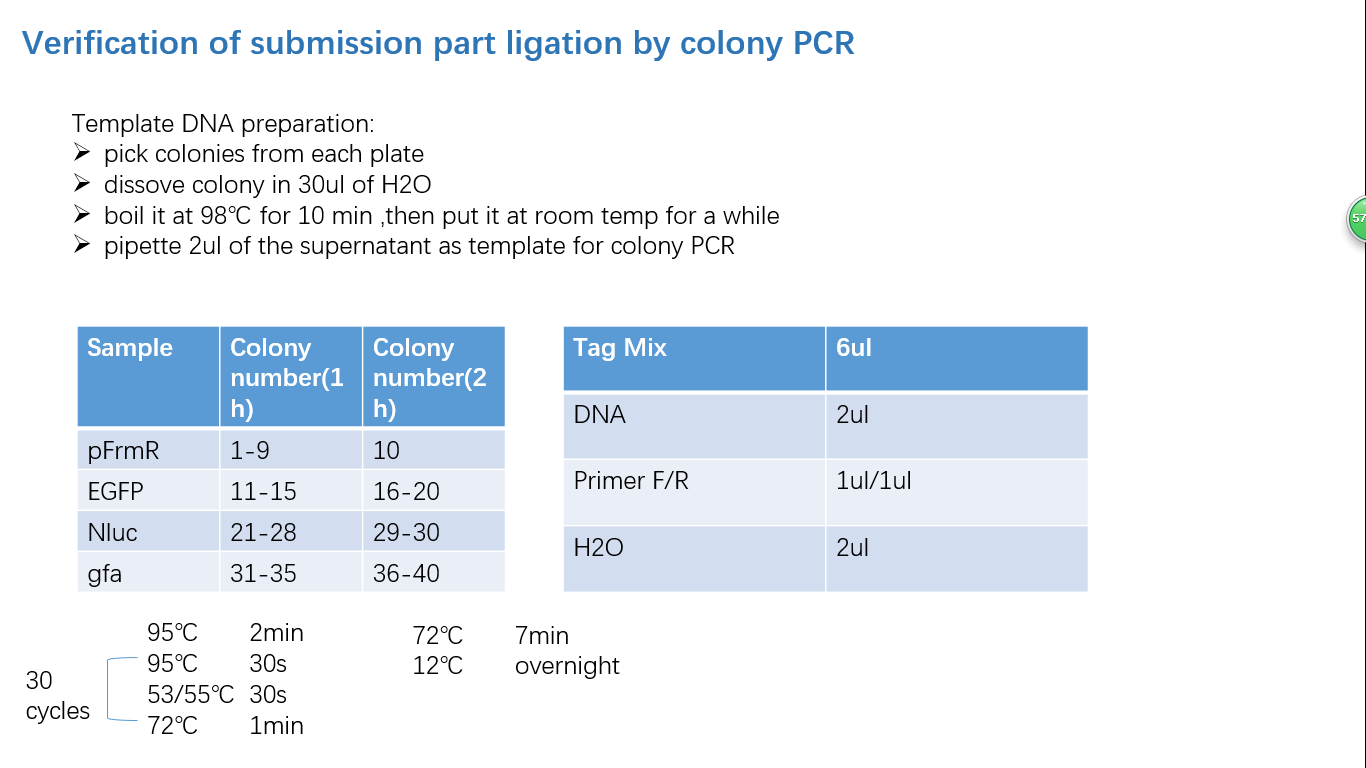
We ordered the synthesized plasmid from Genscript. After restriction digestion & transformation, we got our E. coli with GFA.
Fig 3: Order info
Origin
This gene originated from P. denitrificans. Putative proteins with sequence identity to GFA from P. denitrificans are present also in Rhodobacter sphaeroides, Sinorhizobium meliloti, and Mesorhizobium loti.
Experimental Characterization
Culture environment: saturated formaldehyde aqueous solution with concentration of 37 percent
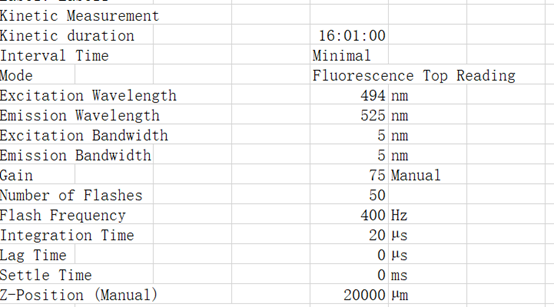
Instruments: tecan infinite m1000
Experiment group: BL21 with pFrmR+GFP and BL21 with GFA in ratio of 1:1
Control group A: BL21
Control group B: BL21 with pFrmR+EGFP
- Test the OD number of overnight-cultured strain;
- Diluted to 0.05, the strains are cultured under 37 celsius, 220prm.
For control groups:
- Take 5 tubes of 1ml system both from the control groups and add 0.5ul saturated formaldehyde solution into each tube. Mix evenly.
For experiment group:
- Take 500ul from each strain and mix them together.
- Add 0.5ul of saturated formaldehyde aqueous solution.
Related conditions:
Excitation Wavelength 495 nm
Emission Wavelength 525 nm
List of actions in this measurement script:
Shaking (Orbital) Duration: 900 s
Shaking (Orbital) Amplitude: 2 mm
Shaking (Orbital) Frequency: 306 rpm
Results:
The figure indicates that the experiment expressed the highest amount of fluorescence.
The experiment group only had half amount of EGFP bacteria compared with the control group B, but produced higher expression. The only way to explain this result is that GFA played an important role to degrade the formaldehyde, therefore decreased the toxicity of the environment of bacteria and enhance the survival rate. This also indicates that our engineered system shown below works. Due to the time limitation, we only successfully finished only one trial. We will test more combination of mixed ratio and formaldehyde concentrations in the coming days.
Parts Verification Before Submission
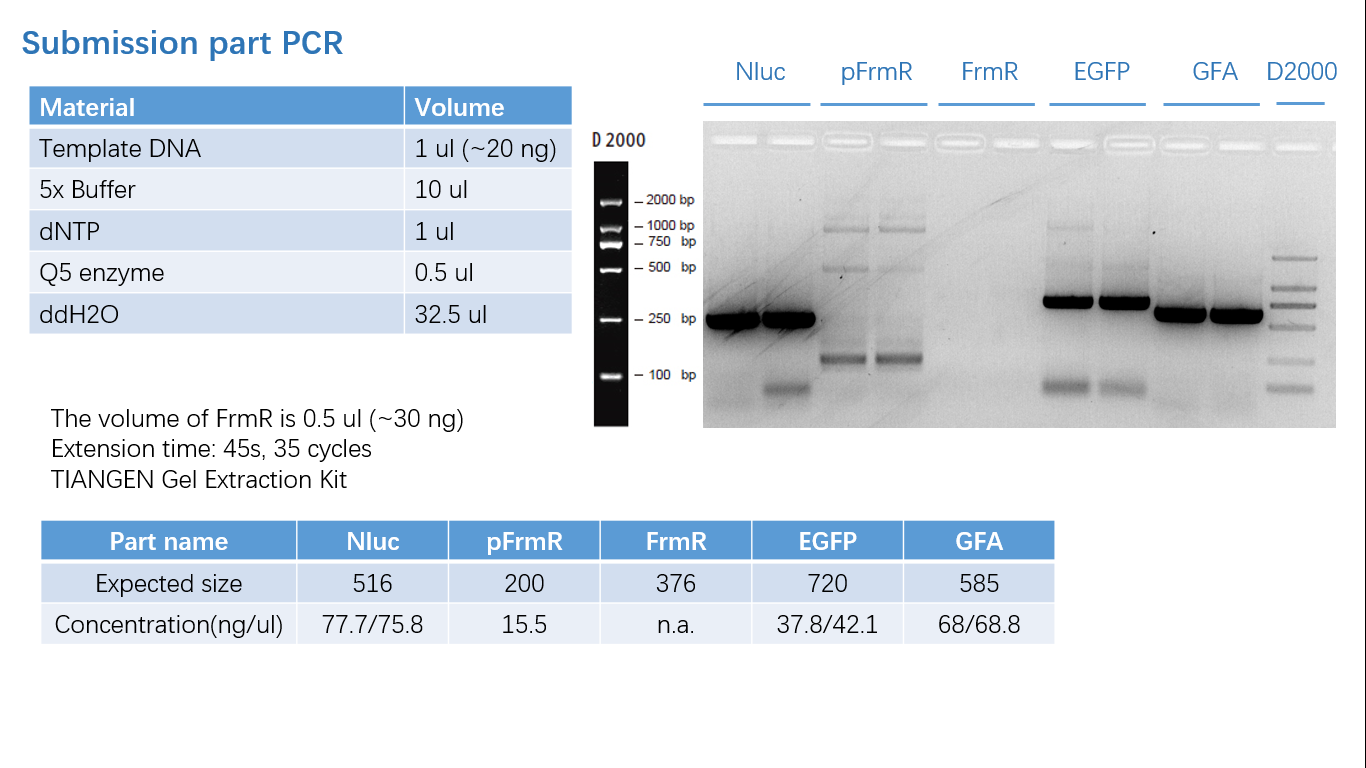
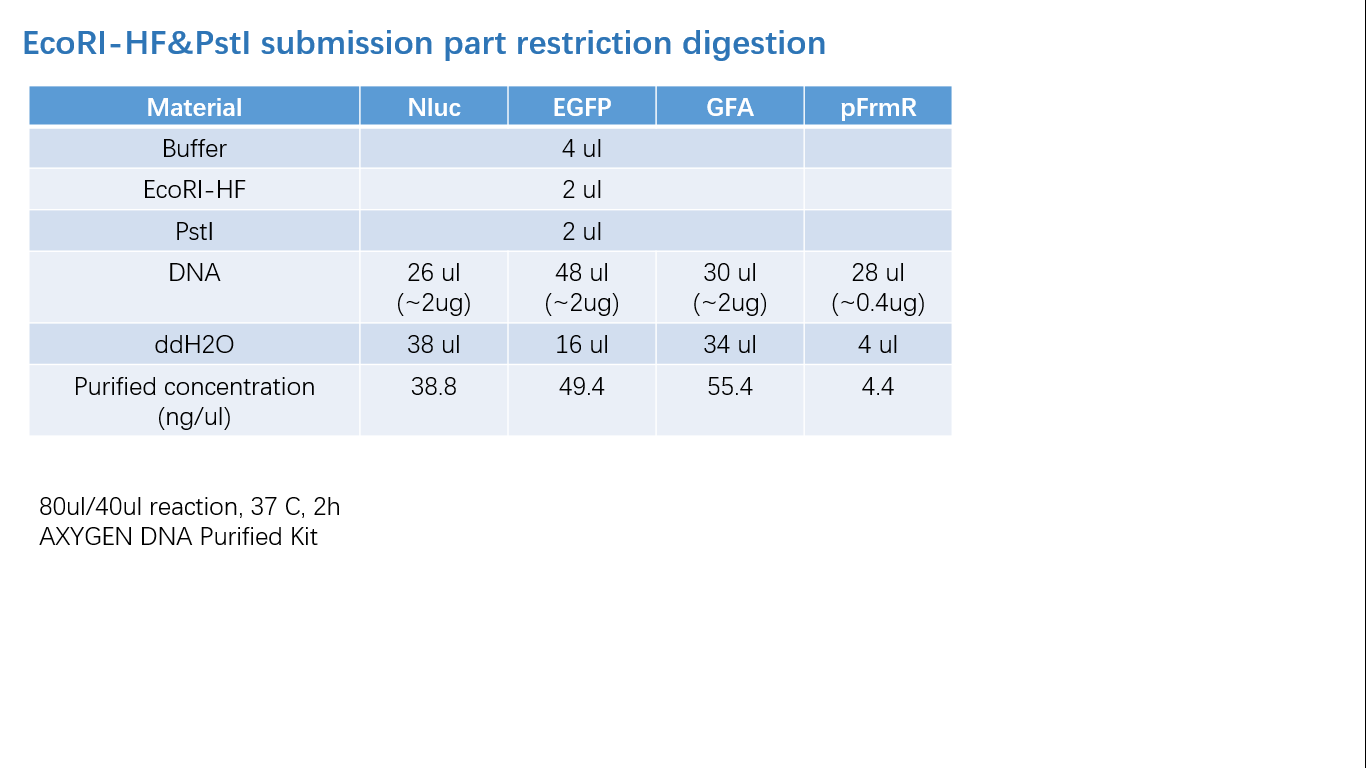
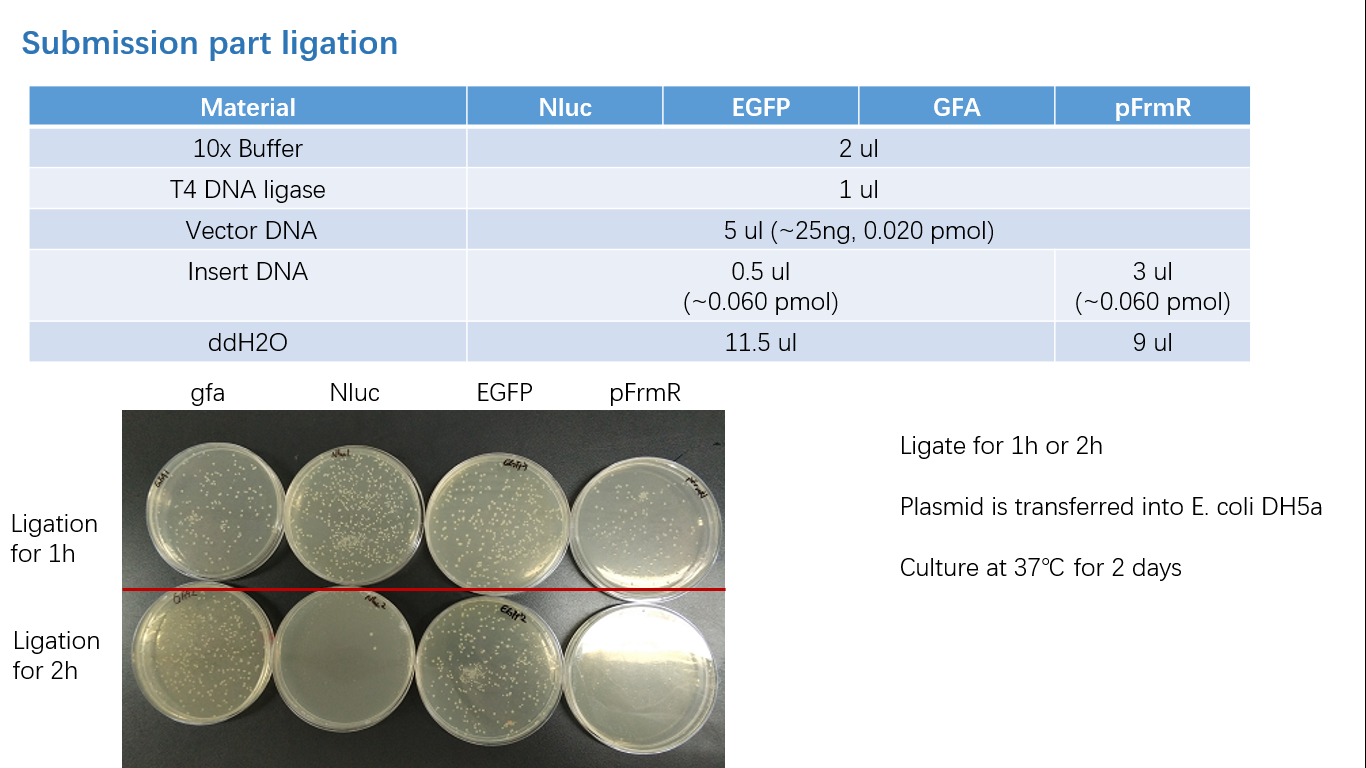
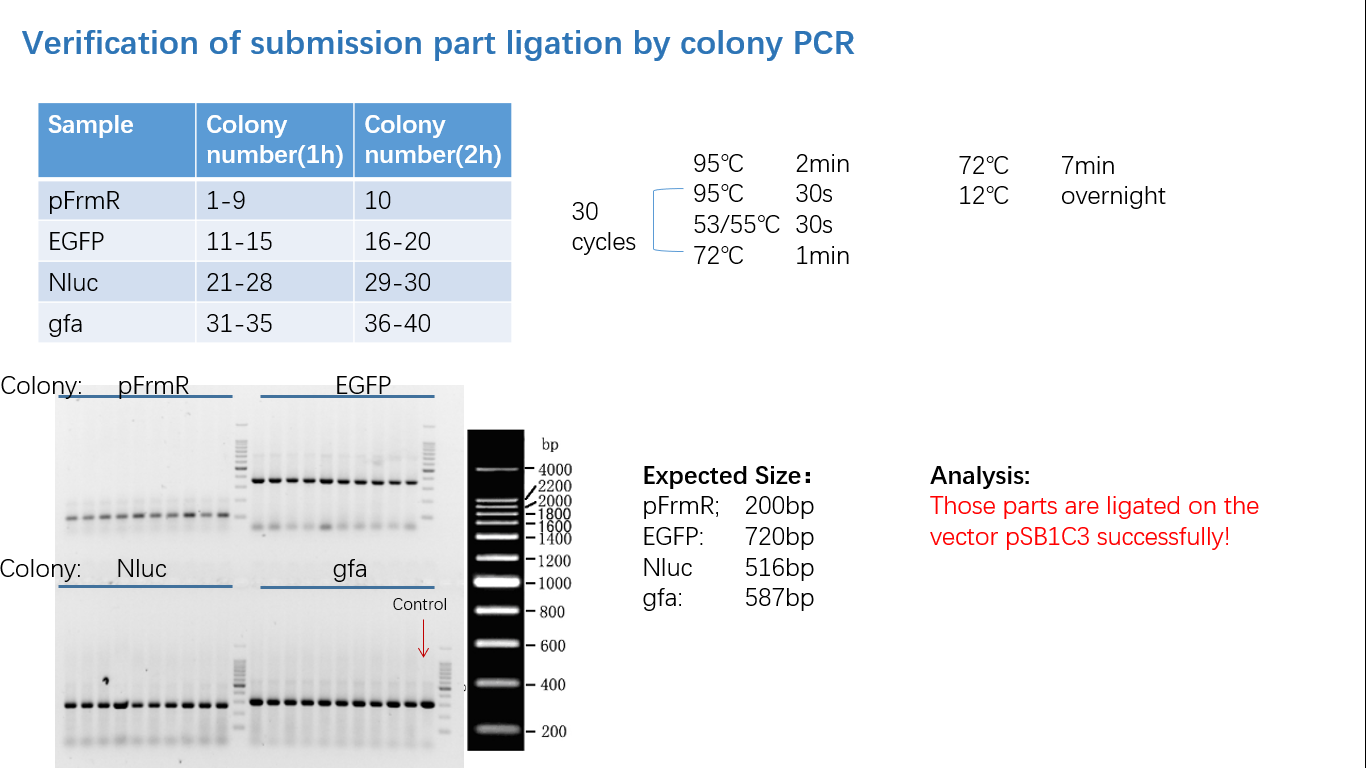
We verified our parts in the lab before submission. They are reliable! Please feel free to apply them onto your project.=)
Fig 1: PCR (to get targeted genes)
Fig 2: Restriction Digestion
Fig 3: Ligation
Fig 4: Colony PCR
Fig 5: Gel Verification
References
- Gonzalez, C. F., Proudfoot, M., Brown, G., Korniyenko, Y., Mori, H., Savchenko, A. V., & Yakunin, A. F. (2006). Molecular Basis of Formaldehyde Detoxification. Journal of Biological Chemistry, 281(20), 14514–14522.
- Goenrich, M., Bartoschek, S., Hagemeier, C. H., Griesinger, C. & Vorholt, J. A. (2002). A glutathione-dependent formaldehydeactivating enzyme (Gfa) from Paracoccus denitrificans detected and purified via two-dimensional proton exchange NMR spectroscopy.J Biol Chem 277, 3069–3072.
- Rohlhill J, Sandoval N R, Papoutsakis E T. Sort-seq approach to engineering a formaldehyde-inducible promoter for dynamically regulated Escherichia coli growth on methanol.[J]. Acs Synthetic Biology, 2017, 6(8).
Improve
In order to better realize the degradation of formaldehyde, 2019 iGEM team ZJUT-China improved the formaldehyde degradation pathway in the strain and submitted <a href="https://parts.igem.org/Part:BBa_K2936013">BBa_K2936013</a> as an improvement on BBa_K2728004.The design of this part is showed in Figure 1.

Our improvements include two aspects :(1) we improved the original basic part into a composite part, which later iGEM team could use directly on plasmids and genomes; (2) improved the degradation efficiency of formaldehyde. We verified the formaldehyde degradation efficiency of this pathway from two aspects. One is to measure the amount of formaldehyde degradation in the experimental group and the control group at the same time, the other is to measure the rate of formaldehyde degradation in the experimental group and the control group. The method we used was based on acetylacetone reaction This is the principle of this method is that formaldehyde reacts with acetylacetone in the buffer solution of acetic acid ammonium acetate with pH = 6, and rapidly generates stable yellow compound in boiling water bath. Finally measure its OD value at the wavelength of 413nm by spectrophotometer. The functional comparison of original part and improved part is shown in Figure 2.

Fig2. Functional comparison of original part and improved part
We tested BBa_K2936013 and BBa_K2728004 separately on plasmids, and used E. coli BL21 as the control group. The first step was to determine the amount of degradation. The strain only containing gfa gene was named FDS-1, while the strain containing complete pathway was named FDS-2. We cultured the two groups of strains and the control group respectively at 37 ℃ with 50 mg/L formaldehyde for 25 minutes . After centrifugation, supernatant was taken and reacted with acetylacetone, OD value of supernatant was measured, standard curve was determined (the result is shown in Figure 3), and the concentration of each strain was calculated for comparison (the result is shown in Figure 4).


From the two charts, it shows that after 25 minutes, the residual formaldehyde in FDS-2 bacterial solution was significantly less than that in FDS-1 bacterial solution. Therefore, the following conclusion can be drawn: under the same culture time and conditions, the degradation amount of formaldehyde in FDS-2 bacterial solution was higher than that in FDS-1 bacterial solution.
Then, we did another test. Two groups of strains and control strains were cultured under the same conditions, and then supernatants were centrifuged every 5 minutes to determine the OD value of acetylacetone reaction. Calculate the formaldehyde concentration according to the standard curve and compare it (the result is shown in Figure 5).

Fig5. Degradation rate of E. coli BL21/DH5α/FDS-1/FDS-2 against formaldehyde
We found that the formaldehyde degradation rate of FDS-2 strain was significantly higher than that of FDS-1 and three control groups, and the degradation rate curve of FDS-2 strain was linear within 10 minutes, while the degradation curve of FDS-1 strain coincided with that of BL21 strain. At 25 minutes, the rate curve showed that FDS-2 strain had completely degraded formaldehyde, while FDS-1 strain only degraded formaldehyde to 15mg/L. The rate curve of LB control group without bacterial solution was parallel to the X-axis, which indicated that the degradation of formaldehyde in bacterial solution environment was due to the action of bacterial strains rather than the volatilization of formaldehyde itself. At the same time, by comparing the rate curves of E. coli DH5α and E. coli BL21, it shows that the degradation rate of E. coli BL21 is higher than that of E. coli DH5α, so we chose E. coli BL21 strain as the chassis. Through our improvement, the ability of the strain to degrade formaldehyde has been greatly improved, so we believe that the above improvement is of great significance.
References
Sequence and Features
- 10COMPATIBLE WITH RFC[10]
- 12COMPATIBLE WITH RFC[12]
- 21COMPATIBLE WITH RFC[21]
- 23COMPATIBLE WITH RFC[23]
- 25COMPATIBLE WITH RFC[25]
- 1000COMPATIBLE WITH RFC[1000]
| None |


