Part:BBa_K1732009
pSB1C3-J23100-B0034-GFP-His-B0015
pSB1C3-J23100-B0034-GFP-His-B0015
His tagged GFP and strong RBS. The J23100 strong constitutive promoter allows for high level expression of the fluorescent protein used to measure fluorescence.
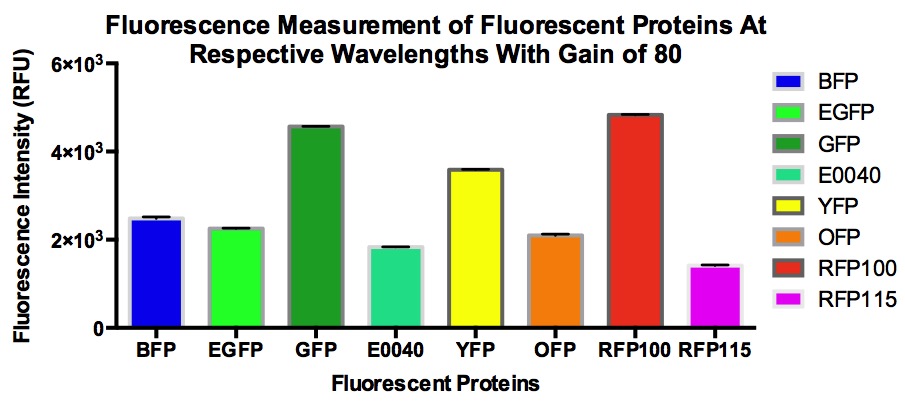
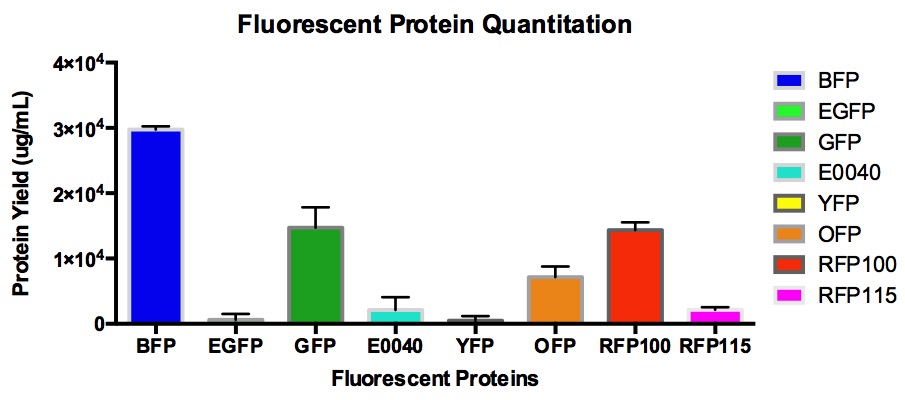
A set of fluorescent proteins which includes BFP, GFP, eGFP, E0040, OFP, YFP, and RFP with a J23100 constitutive promoter and RFP with a J23115 constitutive promoter were characterized. The relative fluorescence as well as the signal-to-noise ratio of all the proteins in the MACH competent cell line were calculated. GFP was measured at (ex/em = 488nm/509nm).
Alignment
Sequence alignment of original sequence to codon optimized sequence, indicating the differences in amino acids.
Original Set of Fluorescent Proteins (Not Codon Optimized)
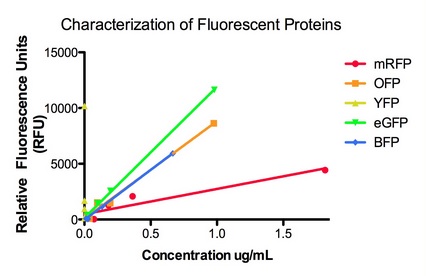
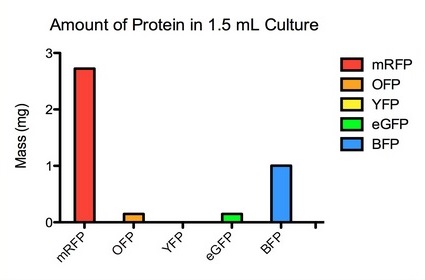
The graphs below show the data for the original set of fluorescent proteins prior to being codon optimized via the IDT codon optimization tool. The set consists of His tagged RFP, OFP, YFP, eGFP, and BFP, each with a strong RBS and WT lac promoter that allows for Lac induction of fluorescence.
Here we take various dilutions of each extracted protein and using their concentration from above we provided an exact amount for each. We graph amount versus total fluorescence as read with a gain of 100 on a TECAN Saffire2 fluorimeter. as shown by the r value, it appears that there is a linear relationship between fluorescence and quantity of protein with two exceptions: RFP and YFP. RFP appears to increase logarithmically, whereas YFP has a negligible protein output due to low expression and possibly repeated error in extraction. It is important to note that despite low quantity, YFP remains highly fluorescent.
This graph quantifies fluorescent proteins using a BCA protein asset with a BSA standard. The proteins were His-Tagged and extracted using a Ni-NTA protocol. from there we used a spectrophotometer to create a standard curve with BSA of known concentrations and a BCA dye. The dye allowed us to read the amount of protein from 1.5mL of culture as a function of absorbance (in a sense amplifying the scale of our readout for a reading more accurate than obtainable in the UV range with our available equipment).
Sequence and Features
- 10COMPATIBLE WITH RFC[10]
- 12INCOMPATIBLE WITH RFC[12]Illegal NheI site found at 7
Illegal NheI site found at 30 - 21COMPATIBLE WITH RFC[21]
- 23COMPATIBLE WITH RFC[23]
- 25INCOMPATIBLE WITH RFC[25]Illegal NgoMIV site found at 740
Illegal AgeI site found at 209 - 1000COMPATIBLE WITH RFC[1000]
| None |


