Part:BBa_K1216007
Variant of the wild-type pLuxR promoter with lower sensitivity
BBa_K1216007 is a variant of the wild-type luxR promoter with a lowered sensitivity for LuxR-AHL.
Sequence and Features
- 10COMPATIBLE WITH RFC[10]
- 12COMPATIBLE WITH RFC[12]
- 21COMPATIBLE WITH RFC[21]
- 23COMPATIBLE WITH RFC[23]
- 25COMPATIBLE WITH RFC[25]
- 1000COMPATIBLE WITH RFC[1000]
Characterization
Site saturation directed mutagenesis of the BBa_R0062 pluxR wild type promoter to obtain the pluxR variant BBa_K2126007
Our goal was to achieve mutations in the luxbox of the pLuxR BBa_R0062 promoter to shift the dose response curve of the promoter depending on the OHHL (3-oxo-hexanoyl-l-homoserine-l-lactone) concentration.
We did site directed saturation mutagenisis of specific sites of the luxbox according to literature ([http://www.ncbi.nlm.nih.gov/pmc/articles/PMC2446796/ Luis Caetano A Mutational Analysis Defines Vibrio fischeri LuxR Binding Sites])
We mutated the promoter directly in the BBa_J09855 construct and cloned a GFP gene as reporter to be able to screen for different dose response curves. In the end we isolate one mutated promoter which shows a shift in sensitivity. For more details see : Characterization of the pLuxR variant dose response to OHHL using plate reader analysis and single cell analysis
Characterization of the pluxR variant dose response to OHHL using plate reader analysis and single cell analysis
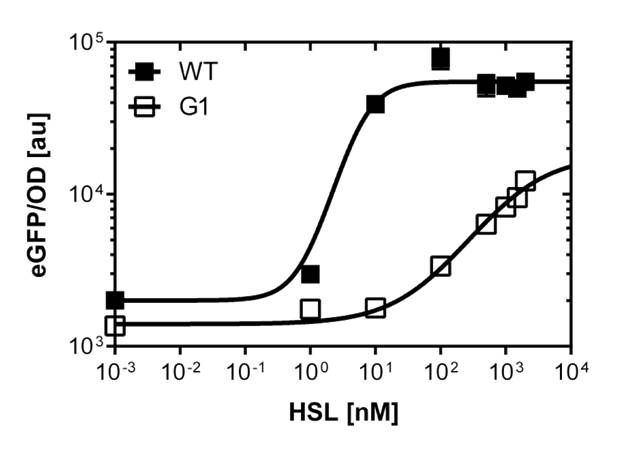
Characterization and comparison to the wild type pluxR using microtiter plate analysis
The GFP reporter allows us to make fluorescence measurement in plate reader experiments as well as in single cell analysis to characterize the promoter behavior depending on [OHHL], by recording the fluorescence [au]. According to literature [http://www.ncbi.nlm.nih.gov/pubmed/18760602 (Geske G.D. Evaluation of a focused library of N-aryl L-homoserine lactones reveals a new set of potent quorum sensing modulators)] we could define the first experimental OHHL ranges to induce the promoter. After some fine tunning and adjusting experiment we could narrow down the ranges to obtain a dose response curve in a reasonable resolution for the BBa_R0062 wild type promoter to the OHHL (3-oxo-hexanoyl-l-homoserine-lactone) concentration. See Figure 1. This datas were obtained from plate reader experiment. Accordnig to the sensivity range of the wild type promoter we could screen for promoters, and scan the potentially shifted variants in different ranges of [OHHL]. We finally isolate one promoter variant which shows a shift compared to the wild type. See G1 on Figure 1. The pluxR variant has an EC50=1'341 nM , the pluxR wild type has an EC50=5.86 nM according to the plate reader data. The single cell analysis gave us data of higher quality (see below).
Characterization of the pluxR dose response to OHHL in liquid culture and in agar plates by single cell analysis
To obtain high quality data we did single cell analysis over the range defined above. As expected the EC50 change compared to the microtiter plate data.
See Figure 2.


For the liquid culture we got :EC50=6'482nM, R2=0.97, n=0.8;
For the agar plates we got :EC50=17'814nM, R2=0.93, n=0.8
Figure 3 shows the dose reponse curve of the promoter depending on OHHL concentration. We performed this experiment in liquid culture as well as in agar plates (OHHL was added to the melted 1.5% agar), which was closer to our project. We observed a shift in the dose response between the liquid culture (EC50=6'482nM) single cell analysis and the one in agar plates(EC50=17'814nM).This correspond to a 3 fold shift.
Comparison of the pluxR variant and pluxR wild type dose response to OHHL in liquid culture and on agar plates
Figure 4 shows the comparison between the wild type pluxR and pluxR variant dose reponse curve to [OHHL] on agar plates (OHHL was added to the melted 1.5% agar), which was closer to our project. The shift in the dose response between the wild type pluxR (EC50=4.45 nM and the pluxR variant(EC50=17'814nM) is about 4003 times less sensitive according to the single cell analysis. See Figure 4
Figure 5. shows the comparison between the wild type pluxR and pluxR variant dose reponse curve to [OHHL] in liquid cultures. The shift in the dose response between the wild type pluxR (EC50=0.02 nM and the pluxR variant(EC50=6'462 nM) is about 300'000 times different according to the single cell analysis. See Figure 4
| None |


