
Difference between revisions of "Part:BBa K523006"
(→Functional Parameters: Austin_UTexas) |
|||
| Line 387: | Line 387: | ||
<center><img src = "https://static.igem.org/mediawiki/parts/f/fa/T--Austin_Utexas--no_burden_icon.png" style = "width:160px;height:120px"></center> | <center><img src = "https://static.igem.org/mediawiki/parts/f/fa/T--Austin_Utexas--no_burden_icon.png" style = "width:160px;height:120px"></center> | ||
</div> | </div> | ||
| − | <figcaption><center><b>Burden Value: | + | <figcaption><center><b>Burden Value: 9.6 ± 17.9% </b></center></figcaption> |
</figure> | </figure> | ||
<p> Burden is the percent reduction in the growth rate of <i>E. coli</i> cells transformed with a plasmid containing this BioBrick (± values are 95% confidence limits). This BioBrick did not exhibit a burden that was significantly greater than zero (i.e., it appears to have little to no impact on growth). Therefore, users can depend on this part to remain stable for many bacterial cell divisions and in large culture volumes. Refer to any one of the | <p> Burden is the percent reduction in the growth rate of <i>E. coli</i> cells transformed with a plasmid containing this BioBrick (± values are 95% confidence limits). This BioBrick did not exhibit a burden that was significantly greater than zero (i.e., it appears to have little to no impact on growth). Therefore, users can depend on this part to remain stable for many bacterial cell divisions and in large culture volumes. Refer to any one of the | ||
Revision as of 22:52, 3 September 2020
Plac + LacZ + malS
E. coli periplasmic α-amylase gene malS (see [http://www.ncbi.nlm.nih.gov/nuccore/48994873?from=3735520&to=3737550&report=gbwithparts info from GenBank: U00096.2]) under control of lac promoter. LacZα is also present.
Usage and Biology
While an amylase ought to be capable of degrading starch, the product protein is believed to be periplasmic and thus ought to only degrade starch if it leaks from the periplasm in significant quantities (but see below: this does seem to be the case). Its natural function in E. coli presumably involves degrading shorter glucose chains: [http://dx.doi.org/10.1128/JB.00767-08 Lengsfeld et al (2008)] state that "MalS produces preferentially maltohexaose from longer maltodextrins in the periplasm".
Other interesting and useful facts about the MalS protein can be found in [http://dx.doi.org/10.1074/jbc.272.35.22125 Spiess et al (1997)].
The SignalP program predicts that a 17 amino acid localisation signal (at the N terminal) is cleaved off before the protein reaches its mature form.
Iodine assay #1
We (Edinburgh 2011) placed BBa_K523001 under the control of the lac promoter (creating BBa_K523006) and streaked colonies on a starch agar plate. A (poorly characterised) negative control without this construct was also streaked out. The cells were incubated for 3 days.
One colony failed to grow for some reason, but the others did. We flooded the plate with iodine, which turns black in the presence of starch ([http://en.wikipedia.org/wiki/Iodine_test Wikipedia]):

|

|

| ||
| Before the assay. Colony 1 failed to grow. Control at top. | Immediately after iodine flooding. | 40 minutes after iodine flooding. |
We made three observations:
- The area under the negative control (top streak) turned black, while the areas under the malS streaks did not.
- The iodine gradually evaporated, turning the plate clear again.
- After 40 minutes, halos were seen around the two malS streaks.
We can think of two ways to explain observation 1:
- malS degraded starch, or:
- the control cells grew slower than the malS cells for some reason, and thus formed a thinner layer; iodine could pass through that layer to turn the starch underneath black, but could not pass through the thicker malS layer.
However, observation 3, the halos, seem to rule out this second explanation, and instead suggest actual diffusion of a starch-degrading enzyme (MalS) into the agar.
Iodine assay #2
The precise nature of the negative control above has been lost in the mists of time (it was JM109 E. coli with an unknown construct in pSB1C3).
We (Edinburgh 2011) repeated the iodine assay with a known control, PlacLacZ-bglX (part BBa_K523014). This part is a good control since it has both Plac-LacZ (like this part) and a periplasmic protein (like this part), and is known to actually work.
(Another control, using only Plac-LacZ, failed to grow because the source cells had been in the cold room too long.)

|

|

| ||
| Control at top. Bottom two streaks are malS. | Same plate, time = 25 minutes. | Same plate, time = 70 minutes. While the iodine has faded from all the bacteria, halos are now visible around the malS streaks but not the control. |
DNS assay
We (Edinburgh 2011) made cell extracts using this part and compared them to a negative control (BBa_K523000) in the following way:
Cells were sonicated and fractionated to obtain cell lysate and cell debris. 0.2% starch solution and phosphate buffered saline (PBS) were mixed with cell extract and incubated at 37 C. Every 30 minutes, a sample was taken from the reaction and 3,5-dinitrosalicylic acid (DNS) was added. The sample was heated in boiling water for 10 minutes. Enzyme activity was then halted by addition of potassium tartrate. The sample was cooled to room temperature and OD575 was measured.
If the cell extract is capable of starch degradation, this will cause the liberated glucose to react with the DNS, producing 3-amino,5-nitrosalicylic acid and so increasing the OD575 reading. The data are clearest for the cell lysate, but overall seem to indicate starch degradation:

Mucoid phenotype
Streaks of E. coli with this part, and grown on starch agar, eventually show a mucoid phenotype so pronounced they were described as "disgusting" by a hardened microbiologist. This phenotype is only visible after several days, and was first spotted on plates that had already been subjected to iodine treatment, so we (Edinburgh 2011) checked plates that were never subjected to iodine. These too show the effect:

|

| |
| Starch agar. Mucoid (slimy) phenotype. All colonies are malS. | Same plate, held up to the light. Control failed to grow because it wasn't chloramphenicol resistant. Oops. |
Mucoid phenotype "transmission"
We (Edinburgh 2011) wanted to check that a control strain of E. coli without this part doesn't display a mucoid phenotype on starch agar, and so E. coli with the aforementioned Plac-bglX part (BBa_K523014) was streaked out onto a starch agar plate alongside some more malS streaks.
We noticed an interesting fact: whether the control strain showed a mucoid phenotype depended on how close the cells were to the malS streaks. The part of the streak that was close to a malS streak did, while the part that was furthest away did not.

|
| The new starch agar plate. As before, one of the controls (top) failed to grow due to an extended period in the cold room. |
This seems to suggest that the MalS protein, or its products, are diffusing through the agar, and causing the nearby cells to show the same mucoid phenotype.
Growth on (minimal) starch agar
The starch agar mentioned above also had other carbon sources present. We tested the ability of K523006 to grow on minimal media but with only starch added as a carbon source. Indeed it could, while normal E. coli displayed weak or no growth:

|
| Growth on M9 minimal media with starch. |
Future experiments: Mucoid phenotype on LB agar
A control ought to be run testing whether this part displays the mucoid phenotype on normal agar. On the assumption that this phenotype is related to starch degradation, it should not.
We ([http://2015.igem.org/Team:TecCEM_HS/Parts TecCEM_HS 2015]) ran this experiment to see the phenotype difference between the bacteria that have BBa_K523006 in starch agar and in normal LB agar (no starch). There wasn't any mucoid phenotype to be seen on LB agar in comparison to starch agar, which showed the mucoid phenotype. We can observe that the mucoid phenotype that is shown by E.coli is in fact related to the ability of this part to degrade starch.

|

| |
| Starch agar after Iodine assay. Mucoid phenotype can be seen. | LB (Cam+) agar, the phenotype is not mucoid. All colonies contain BBa_K523006. |
Discussion
There is clear evidence that malS, when expressed from a high copy number plasmid, is capable of at least mild starch degradation.
The mucoid phenotype was unexpected. It is possible that starch degradation has led to a high supply of glucose, leading to extra exopolysaccharide being produced. This might also explain the "transmission" of the phenotype to nearby cells.
Sequence and Features
- 10COMPATIBLE WITH RFC[10]
- 12INCOMPATIBLE WITH RFC[12]Illegal NheI site found at 1841
- 21INCOMPATIBLE WITH RFC[21]Illegal BglII site found at 607
- 23COMPATIBLE WITH RFC[23]
- 25INCOMPATIBLE WITH RFC[25]Illegal AgeI site found at 977
Illegal AgeI site found at 2142 - 1000COMPATIBLE WITH RFC[1000]
IMPROVEMENT REFERENCE: YAU-China 2019
We replaced Plac + LacZ with T7 promoter (BBa_K2999008) to enhance the expression of downstream genes. The new part is: (BBa_K2999007).(Group: iGEM19_YAU-China), Designed by: Xin Ma.
Characterisation by 2019 Hong Kong UCCKE Team
Group: iGEM 2019 Hong Kong UCCKE
Author: Wong Annabelle
Summary: We conducted an assay to compare the catalytic activity on starch of BBa_K23006 clones with 1% amylase solution. Results are recorded in 3 days with the help of iodine solution.
Purpose
Team Edinburgh conducted 2 iodine assays to compare the catalytic activity of BBa_K23006 colonies with a negative control and a known control PlacLacZ-bglX, which proved the ability of malS to degrade starch. Therefore, we undertook the experiment by comparing the catalytic activity of BBa_K23006 on starch with a positive control, 1% amylase solution.
Methods
We transferred a spot of clone of BBa_K23006 and a spot of 1% amylase on opposite sides of the starch agar plate. The cells were incubated for three days at 37℃. Every day, we flooded the plate with iodine, and measured the diameter of clear zone formed by the two samples respectively.
The protocol can be found in our wiki page: https://2019.igem.org/Team:Hong_Kong_UCCKE/Contribution
Results
| Day 1 | Day 2 | Day 3 |
|---|---|---|
 |
 |
 |
1% amylase solution(+ control) added on the top, clone of BBa_K23006 in the bottom

Graph 1.The diameter of clear zone of α-amylase and 1% amylase
From the results, a clear zone and growth of halos around the clone can be observed under iodine solution, which corresponds with the former conclusion that malS can degrade starch. In comparison, 1% amylase solution showed a greater initial starch degradation amount. Yet it’s slope of diameter of clear zone almost levels off in day 3, which suggests that the rate of digestion slows down with time. In contrast, the clones showed a steeper increase in the diameter of clear zone from Day 2 to 3. This can be explained by the continuous production of malS which results in a continuous digestion of starch in the long run.
VIT_Vellore Characterization: Expression
Methods
We decided that one facet of our characterization will be in the manipulation of expression levels in bacteria for the chosen enzyme. This is because a high volume of production can help us obtain more samples that can be used for further processing. So we decided to optimize the production of the enzyme in E.coli by modifying three different growth affecting factors: pH, Carbon source and nitrogen source. We chose these factors as they are the most important factors in any media. Following incubation at 37°C overnight we lysed the cells using ultrasonication, spun it down to remove the debris, and used 0.5ml of the lysate for all our experiments. DNS assay enzyme incubation conditions were changed as required.
Results and Interpretation
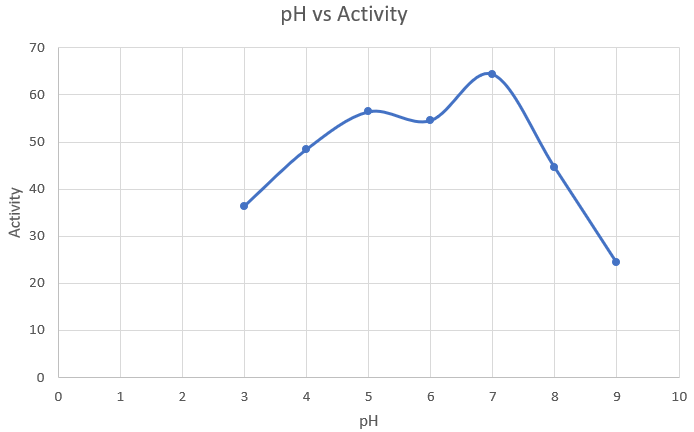
Media optimization: pH
Observations and Inference
As expected, 7 is the optimum pH for amylase production.
Media optimization: Nitrogen source
| S.no | | Nitrogen Source | | Activity |
|---|---|---|
| 1 | Yeast extract | 1.633 |
| 2 | Malt extract | 0.908 |
| 3 | Beef extract | 14.492 |
| 4 | Peptone | 1.183 |
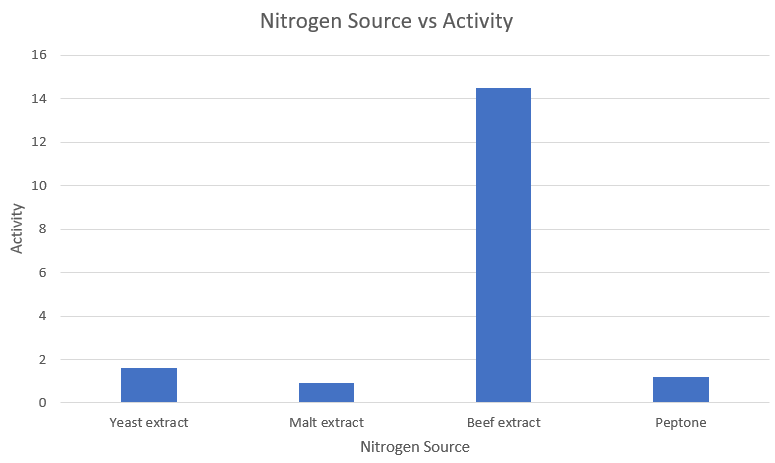
Observations and Inference
As we can clearly see, beef extract is the most optimum nitrogen source for amylase expression.
Media optimization: Carbon source
| S.no | | Carbon Source | | Activity |
|---|---|---|
| 1 | Dextrose | 0.433 |
| 2 | Starch | 3.591 |
| 3 | Sucrose | 7.483 |
| 4 | Fructose | 4.867 |
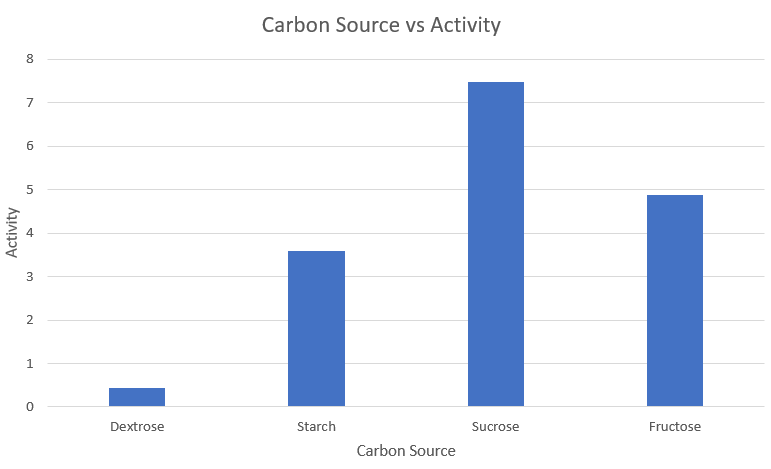
Observations and Inference
We can thus conclude that Sucrose is the optimum carbon source for amylase expression.
VIT_Vellore Characterization: Activity
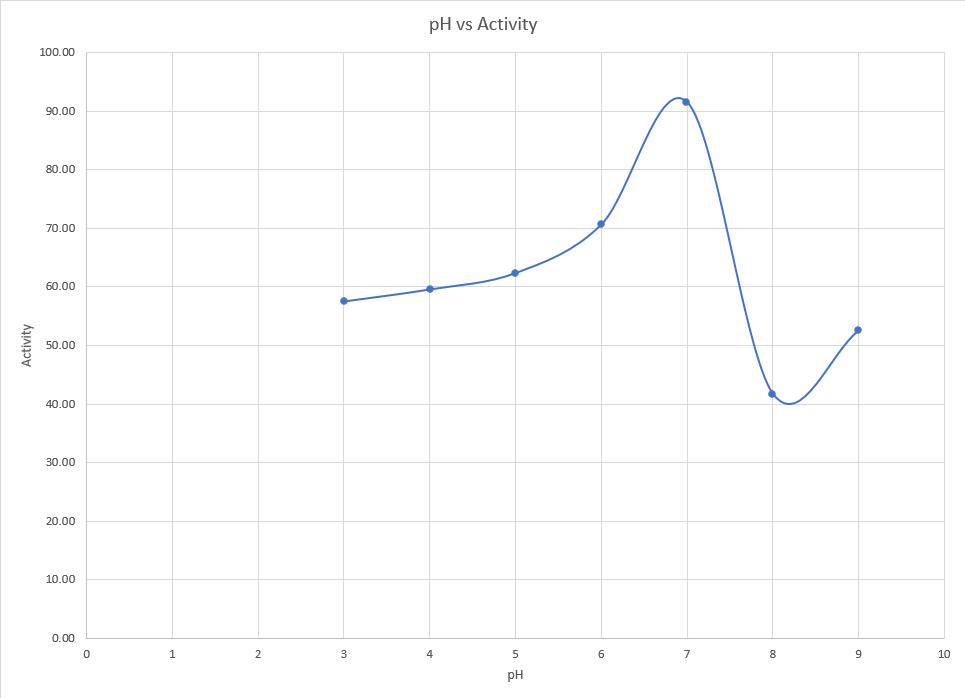
pH effect
We decided to use DNS assay as it will give a reliable estimate of the activity of the of the enzyme. We decided to check the effect of temperature and pH on the activity of the enzyme. Similar to the expression characterization, we obtained the cell lysate using ultrasonication and centrifugation which was later used for the assay.
For the effect of pH on activity, the cell lysates obtained were mixed with mild acids or bases and appropriate buffers were added to maintain the pH in the range of 3 to 9. The list of buffers used can be found here. To these solutions, DNS assay was performed.
<p/>
Results
<p>It is clearly evident pH 7 is the ideal condition for the enzyme to function. At pH even slightly higher than this, a sharp drop in activity is observed. Even at lower pH, activity remains significantly low.
Temperature effect
Similar to the pH characterization, temperature characterization was done by collecting the lysates and incubating them in temperatures ranging from 0°C to 80°C for five minutes. These solutions were later used for DNS assay.
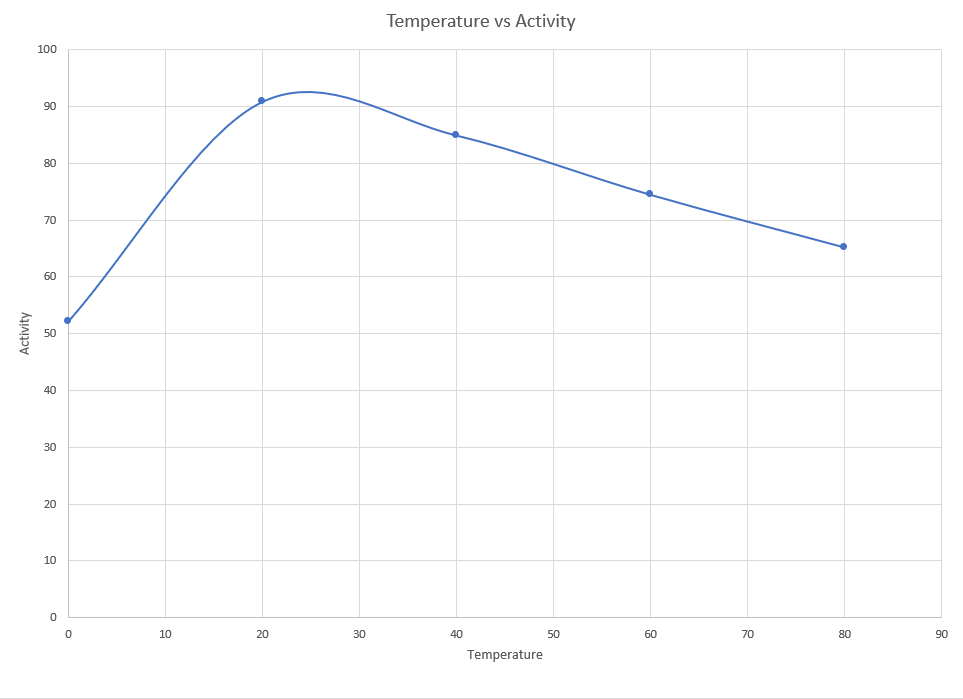
Results:
The maximum activity is found to be at 24°C and we notice a sharp decline in activity as the temperature reduces. However it was not as steep as we had initially expected. Though the activity decreases much gradually as the temperature increases.
For more information, check out our characterization page.
Functional Parameters: Austin_UTexas
Burden Imposed by this Part:
Burden is the percent reduction in the growth rate of E. coli cells transformed with a plasmid containing this BioBrick (± values are 95% confidence limits). This BioBrick did not exhibit a burden that was significantly greater than zero (i.e., it appears to have little to no impact on growth). Therefore, users can depend on this part to remain stable for many bacterial cell divisions and in large culture volumes. Refer to any one of the BBa_K3174002 - BBa_K3174007 pages for more information on the methods, an explanation of the sources of burden, and other conclusions from a large-scale measurement project conducted by the 2019 Austin_UTexas team.
This functional parameter was added by the 2020 Austin_UTexas team.