
Difference between revisions of "Part:BBa K2970013"
| Line 5: | Line 5: | ||
The promoter <partinfo>BBa_J23102</partinfo> was inserted into the backbone <partinfo>pSB1C3</partinfo> with <partinfo>BBa_E0240</partinfo> for characterization. Goal was the comparison between this promoter and <partinfo>BBa_J23100</partinfo>. | The promoter <partinfo>BBa_J23102</partinfo> was inserted into the backbone <partinfo>pSB1C3</partinfo> with <partinfo>BBa_E0240</partinfo> for characterization. Goal was the comparison between this promoter and <partinfo>BBa_J23100</partinfo>. | ||
| − | + | ===Results=== | |
| + | We characterized the activity of the promoters we used in our project, the two constitutive promoters from the Anderson Family, <partinfo>BBa_J23100</partinfo> and <partinfo>BBa_J23102</partinfo>. We measured the expression of GFP downstream of the promoters. | ||
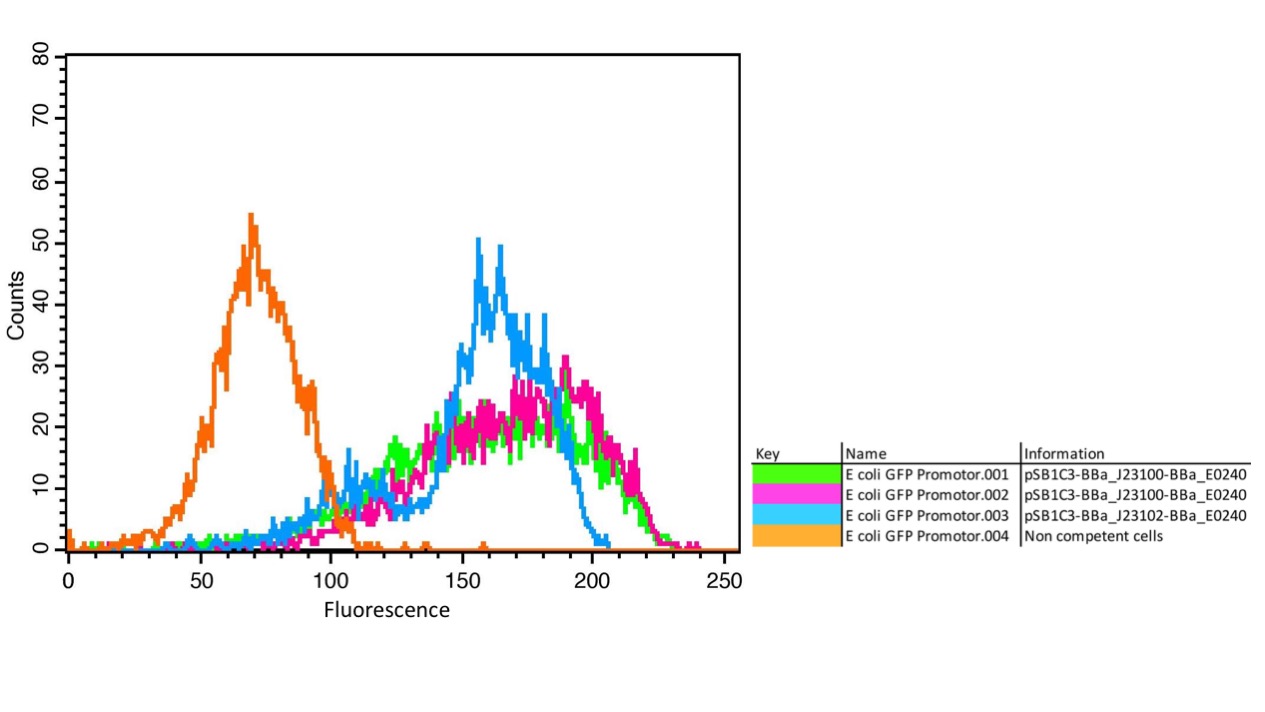
| + | The parts were cloned into <i>E. coli</i> DH5α competent cells. The fluorescence measurements were performed using flow cytometry and plate reader measurements. The results of the flow cytometry measurement are shown in Figure 1. | ||
| + | <html> | ||
| + | <figure> | ||
| + | <img width="100%" src="https://2019.igem.org/wiki/images/5/5a/T--Hamburg--ResultsFigure1.jpeg"> | ||
| + | <figcaption> | ||
| + | <b>Figure 1: </b>A) FACS measurement of GFP in E. coli with the promoters BBa_J23100 and BBa_J23102. Non-competent cells without GFP as negative control show a background fluorescence signal (orange); competent cells with GFP and the different promoters BBa_J23100 (green and pink) and BBA_J23102 (blue) show clear fluorescence signals with different intensities depending on the promoter. | ||
| + | </figure> | ||
| + | </html> | ||
| + | |||
| + | The results confirm the different strengths of the constitutive promoters. <partinfo>BBa_J23100</partinfo> expresses a stronger fluorescence signal than <partinfo>BBa_J23102</partinfo>. As a negative control we used non-competent cells to measure background emission. | ||
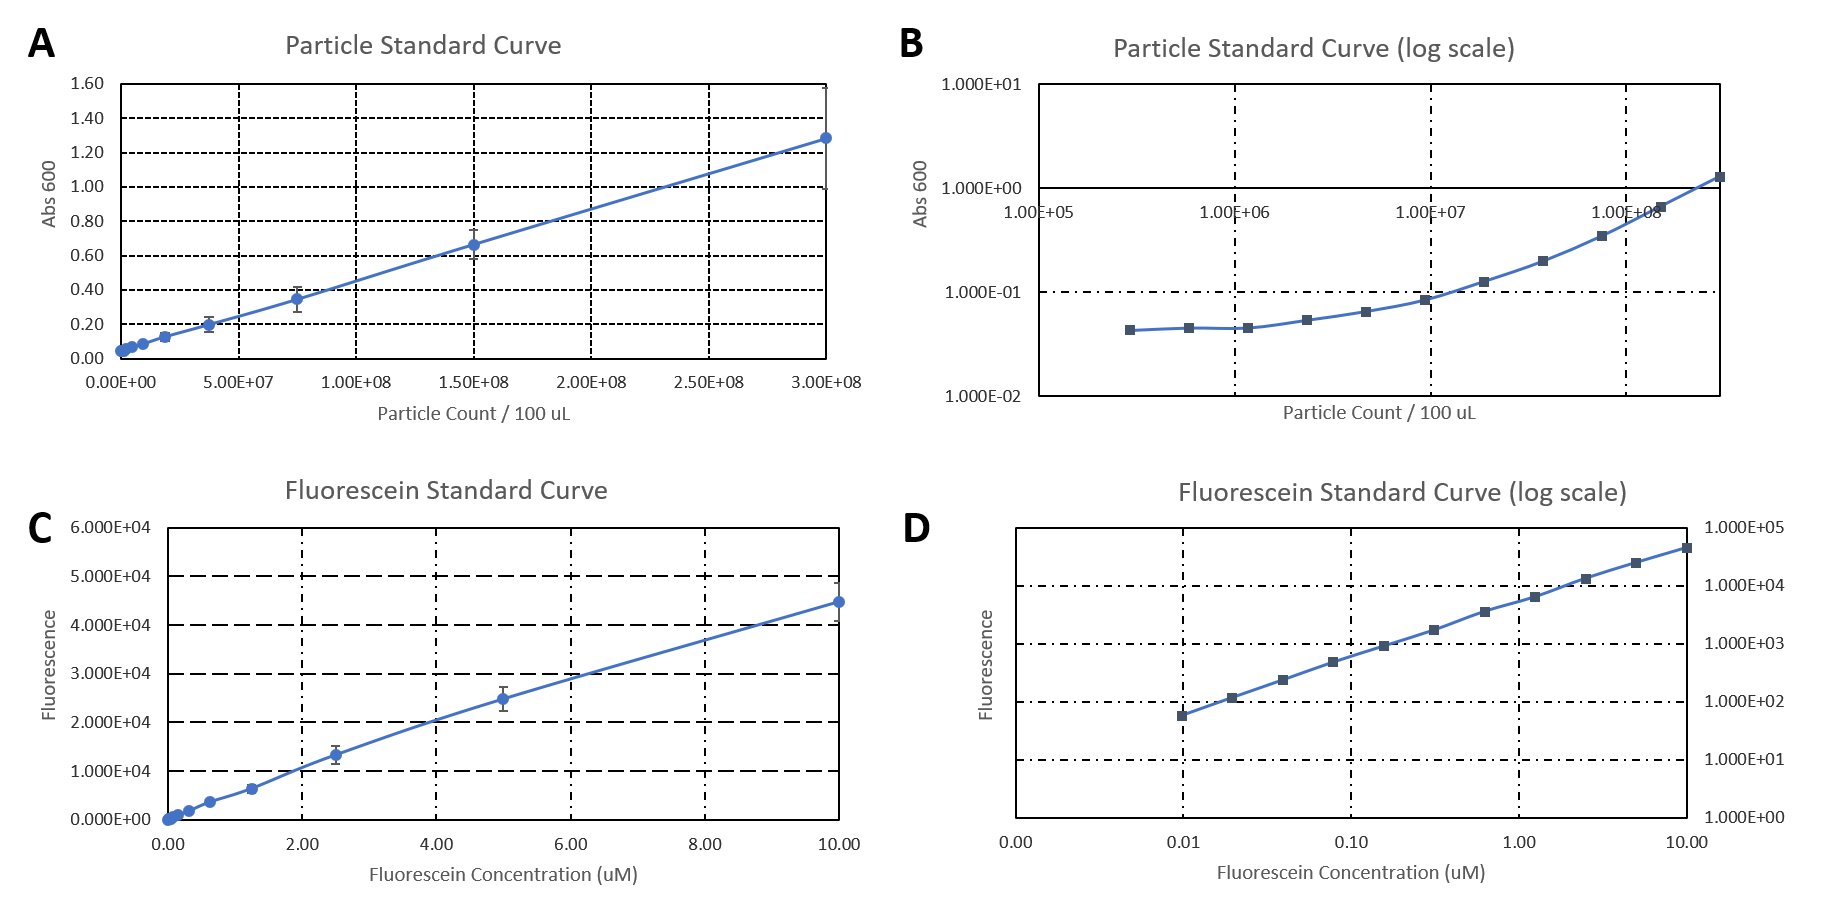
| + | The data used to calibrate the plate reader measurements are shown in Figure 2. The results of our measurement of GFP on the plate reader are shown in Figure 3. | ||
| + | <html> | ||
| + | <figure> | ||
| + | <img width="100%" src="https://2019.igem.org/wiki/images/8/8a/T--Hamburg--ResultsFigure9.png"> | ||
| + | <figcaption> | ||
| + | <b>Figure 2: </b>A) Plate reader calibration. A) Particle standard curve. B) Particle standard curve in log scale. C) Fluorescein standard curve. D) Fluorescein standard curve in log scale. | ||
| + | </figure> | ||
| + | </html> | ||
| + | |||
| + | <html> | ||
| + | <figure> | ||
| + | <img width="100%" src="https://2019.igem.org/wiki/images/d/d4/T--Hamburg--ResultsFigure7.png"> | ||
| + | <figcaption> | ||
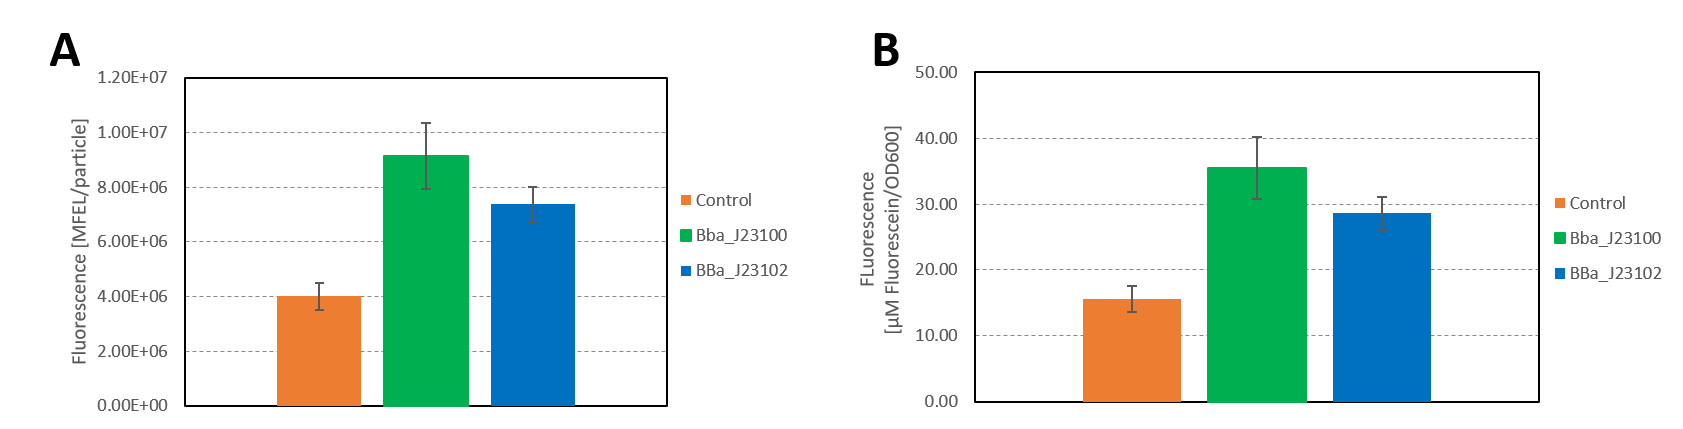
| + | <b>Figure 3: </b>A) Plate reader measurement of GFP in E. coli with the promoters BBa_J23100 and BBa_J23102. Promoter BBa_J23100 (green) expresses higher fluorescence than BBa_J23102 (blue). As control non-competent cells were used (orange). A) Fluorescence calculated in MFEL/particle B) Fluorescence calculated in µM Flourescein/OD600. Error bars show the standard deviation. | ||
| + | </figure> | ||
| + | </html> | ||
| + | |||
| + | The results confirm the previous results from the FACS measurement. The promoter <partinfo>BBa_J23100</partinfo> expresses a stronger fluorescence signal when compared to <partinfo>BBa_J23102</partinfo>. | ||
| + | We calculated the strengths of these promoters relative to the control:<br> | ||
| + | <partinfo>BBa_J23100</partinfo>: 2.28<br> | ||
| + | <partinfo>BBa_J23102</partinfo>: 1.84<br> | ||
| + | The relative strength of <partinfo>BBa_J23102</partinfo> when compared to <partinfo>BBa_J23100</partinfo> is 0.8. In comparison, the values in the registry is 0.856. | ||
| + | |||
| + | Additionally, we sequenced the plasmids used in our measurement. The reported sequence matched the Anderson promoter <partinfo>BBa_J23100</partinfo>. The reported sequence for the promoter <partinfo>BBa_J23102</partinfo> showed three point mutations, which could have impacted the strength of the promoter. The following mutations occurred: 6A>G, 22G>A, 27T>A. This explains the decrease in the relative promoter strength of <partinfo>BBa_J23100</partinfo> compared to <partinfo>BBa_J23102</partinfo>. | ||
| + | |||
| + | |||
Latest revision as of 02:28, 22 October 2019
J23102 Test Composition
The promoter BBa_J23102 was inserted into the backbone pSB1C3 with BBa_E0240 for characterization. Goal was the comparison between this promoter and BBa_J23100.
Results
We characterized the activity of the promoters we used in our project, the two constitutive promoters from the Anderson Family, BBa_J23100 and BBa_J23102. We measured the expression of GFP downstream of the promoters.
The parts were cloned into E. coli DH5α competent cells. The fluorescence measurements were performed using flow cytometry and plate reader measurements. The results of the flow cytometry measurement are shown in Figure 1.
The results confirm the different strengths of the constitutive promoters. BBa_J23100 expresses a stronger fluorescence signal than BBa_J23102. As a negative control we used non-competent cells to measure background emission.
The data used to calibrate the plate reader measurements are shown in Figure 2. The results of our measurement of GFP on the plate reader are shown in Figure 3.
The results confirm the previous results from the FACS measurement. The promoter BBa_J23100 expresses a stronger fluorescence signal when compared to BBa_J23102.
We calculated the strengths of these promoters relative to the control:
BBa_J23100: 2.28
BBa_J23102: 1.84
The relative strength of BBa_J23102 when compared to BBa_J23100 is 0.8. In comparison, the values in the registry is 0.856.
Additionally, we sequenced the plasmids used in our measurement. The reported sequence matched the Anderson promoter BBa_J23100. The reported sequence for the promoter BBa_J23102 showed three point mutations, which could have impacted the strength of the promoter. The following mutations occurred: 6A>G, 22G>A, 27T>A. This explains the decrease in the relative promoter strength of BBa_J23100 compared to BBa_J23102.
Sequence and Features
- 10COMPATIBLE WITH RFC[10]
- 12INCOMPATIBLE WITH RFC[12]Illegal NheI site found at 7
Illegal NheI site found at 30 - 21COMPATIBLE WITH RFC[21]
- 23COMPATIBLE WITH RFC[23]
- 25COMPATIBLE WITH RFC[25]
- 1000INCOMPATIBLE WITH RFC[1000]Illegal BsaI.rc site found at 706