Difference between revisions of "Part:BBa K3182108"
| Line 21: | Line 21: | ||
<h2>CBDcipA crystal structure</h2> | <h2>CBDcipA crystal structure</h2> | ||
| − | [[File:T--Linkoping_Sweden--rotatingcbdanimationloop.gif|420px|thumb|left|<b>Figure | + | [[File:T--Linkoping_Sweden--rotatingcbdanimationloop.gif|420px|thumb|left|<b>Figure 2.</b> Crystal structure of CBDcipA with a resolution of 1.75 Å which were solved by [http://www.ncbi.nlm.nih.gov/pmc/PMC452321 Tormo et al. 1989]. PDB code 1NBC. In red from the left, W118, R112, D56, H57 and Y67, thought to be the surface which interacts strongly with polysaccarides.]] |
<h3>Important molecular faces</h3> | <h3>Important molecular faces</h3> | ||
| Line 40: | Line 40: | ||
The part has a very strong expression with a T7-RNA-polymerase promotor (<partinfo>BBa_I719005</partinfo>) as well as a 5'-UTR (<partinfo>BBa_K1758100</partinfo>) region which has been shown to further increase expression in E. coli (<partinfo>BBa_K1758106</partinfo>), ([http://www.ncbi.nlm.nih.gov/pubmed/2676996 Olins et al. 1989]), ([http://www.ncbi.nlm.nih.gov/pubmed/23927491 Takahashi et al. 2013]). | The part has a very strong expression with a T7-RNA-polymerase promotor (<partinfo>BBa_I719005</partinfo>) as well as a 5'-UTR (<partinfo>BBa_K1758100</partinfo>) region which has been shown to further increase expression in E. coli (<partinfo>BBa_K1758106</partinfo>), ([http://www.ncbi.nlm.nih.gov/pubmed/2676996 Olins et al. 1989]), ([http://www.ncbi.nlm.nih.gov/pubmed/23927491 Takahashi et al. 2013]). | ||
| − | [[File:T--Linkoping_Sweden--expression.png|900px|thumb|center|<b>Figure | + | [[File:T--Linkoping_Sweden--expression.png|900px|thumb|center|<b>Figure 3.</b> Benchling screenshot of the expression system. The T7-RNA-polymerase promotor is followed by a T7 g10 leader sequence which enhances the binding to the 16S ribosomal RNA. After the leader sequence a poly A spacer is found, which has been shown to increase translation in vitro. Before the start codon a strong RBS, g10-L, followed by an AT-rich spacer can be seen, which will slightly increase translation of the following gene.]] |
<h1>Usage and Biology</h1> | <h1>Usage and Biology</h1> | ||
| Line 46: | Line 46: | ||
[[Image:T--Linkoping_Sweden--CBD-sfGFPstorodl4.jpeg|300px]] | [[Image:T--Linkoping_Sweden--CBD-sfGFPstorodl4.jpeg|300px]] | ||
[[Image:T--Linkoping_Sweden--CBD-sfGFPrör4.jpeg|300px]] | [[Image:T--Linkoping_Sweden--CBD-sfGFPrör4.jpeg|300px]] | ||
| − | <b>Figure | + | <b>Figure 4</b> Picture 1: Binding studies of the CBDcipA-sfGFP bound to bacterial cellulose. Washed three times with either 70 % ethanol, PBS or deionized water. Picture 2: Induced culture after 16 hours. E. coli BL21 (DE3) cells were grown in prescence of 25 ug/mL chlorampenicol until an OD600 of 0.8 at 37 degrees Celsius, and later induced with 0.5 mM IPTG. The induced culture were then incubated in 16 degrees Celsius for 16 hours. Picture 3: Left: CBDcipA-sfGFP bound to bacterial cellulose in form of a thin film, right: bacterial cellulose reference. Binding of CBDcipA-sfGFP was done the same way as the pictures below. |
<br><br> | <br><br> | ||
| Line 54: | Line 54: | ||
[[Image:T--Linkoping_Sweden--CBD-sfGFPrör3.jpeg|300px]] | [[Image:T--Linkoping_Sweden--CBD-sfGFPrör3.jpeg|300px]] | ||
| − | <b>Figure | + | <b>Figure 5</b> Picture 1: Lysate containing CBDcipA-sfGFP with bacterial cellulose before incubation. Picture 2: Lysate (CBDcipA-sfGFP) bound to bacterial cellulose after incubation in room temperature for 30 minutes on an end-to-end rotator. Picture 3: Bacterial cellulose after incubation with 70 % ethanol in room temperature for 30 minutes on an end-to-end rotator. All pictures were taken on a 302 nm UV-table for better visualization of the result. |
<br><br> | <br><br> | ||
| − | [[File:T--Linkoping_Sweden--agarosescbdsfpgf.png|900px|thumb|center|<b>Figure | + | [[File:T--Linkoping_Sweden--agarosescbdsfpgf.png|900px|thumb|center|<b>Figure 6.</b> The negative controls refers to the agarose and agarose powder not being exposed to the CBD-sfGFP containing lysate. <I>A and B: </I>Agarose 2,2% was used in. In <I>A</I> the agarose can be observed in normal white light and in <I>B</I> the agarose was put on an UV-table (302nm). <I>C and D</I>: Agarose powder was incubated in ]] |
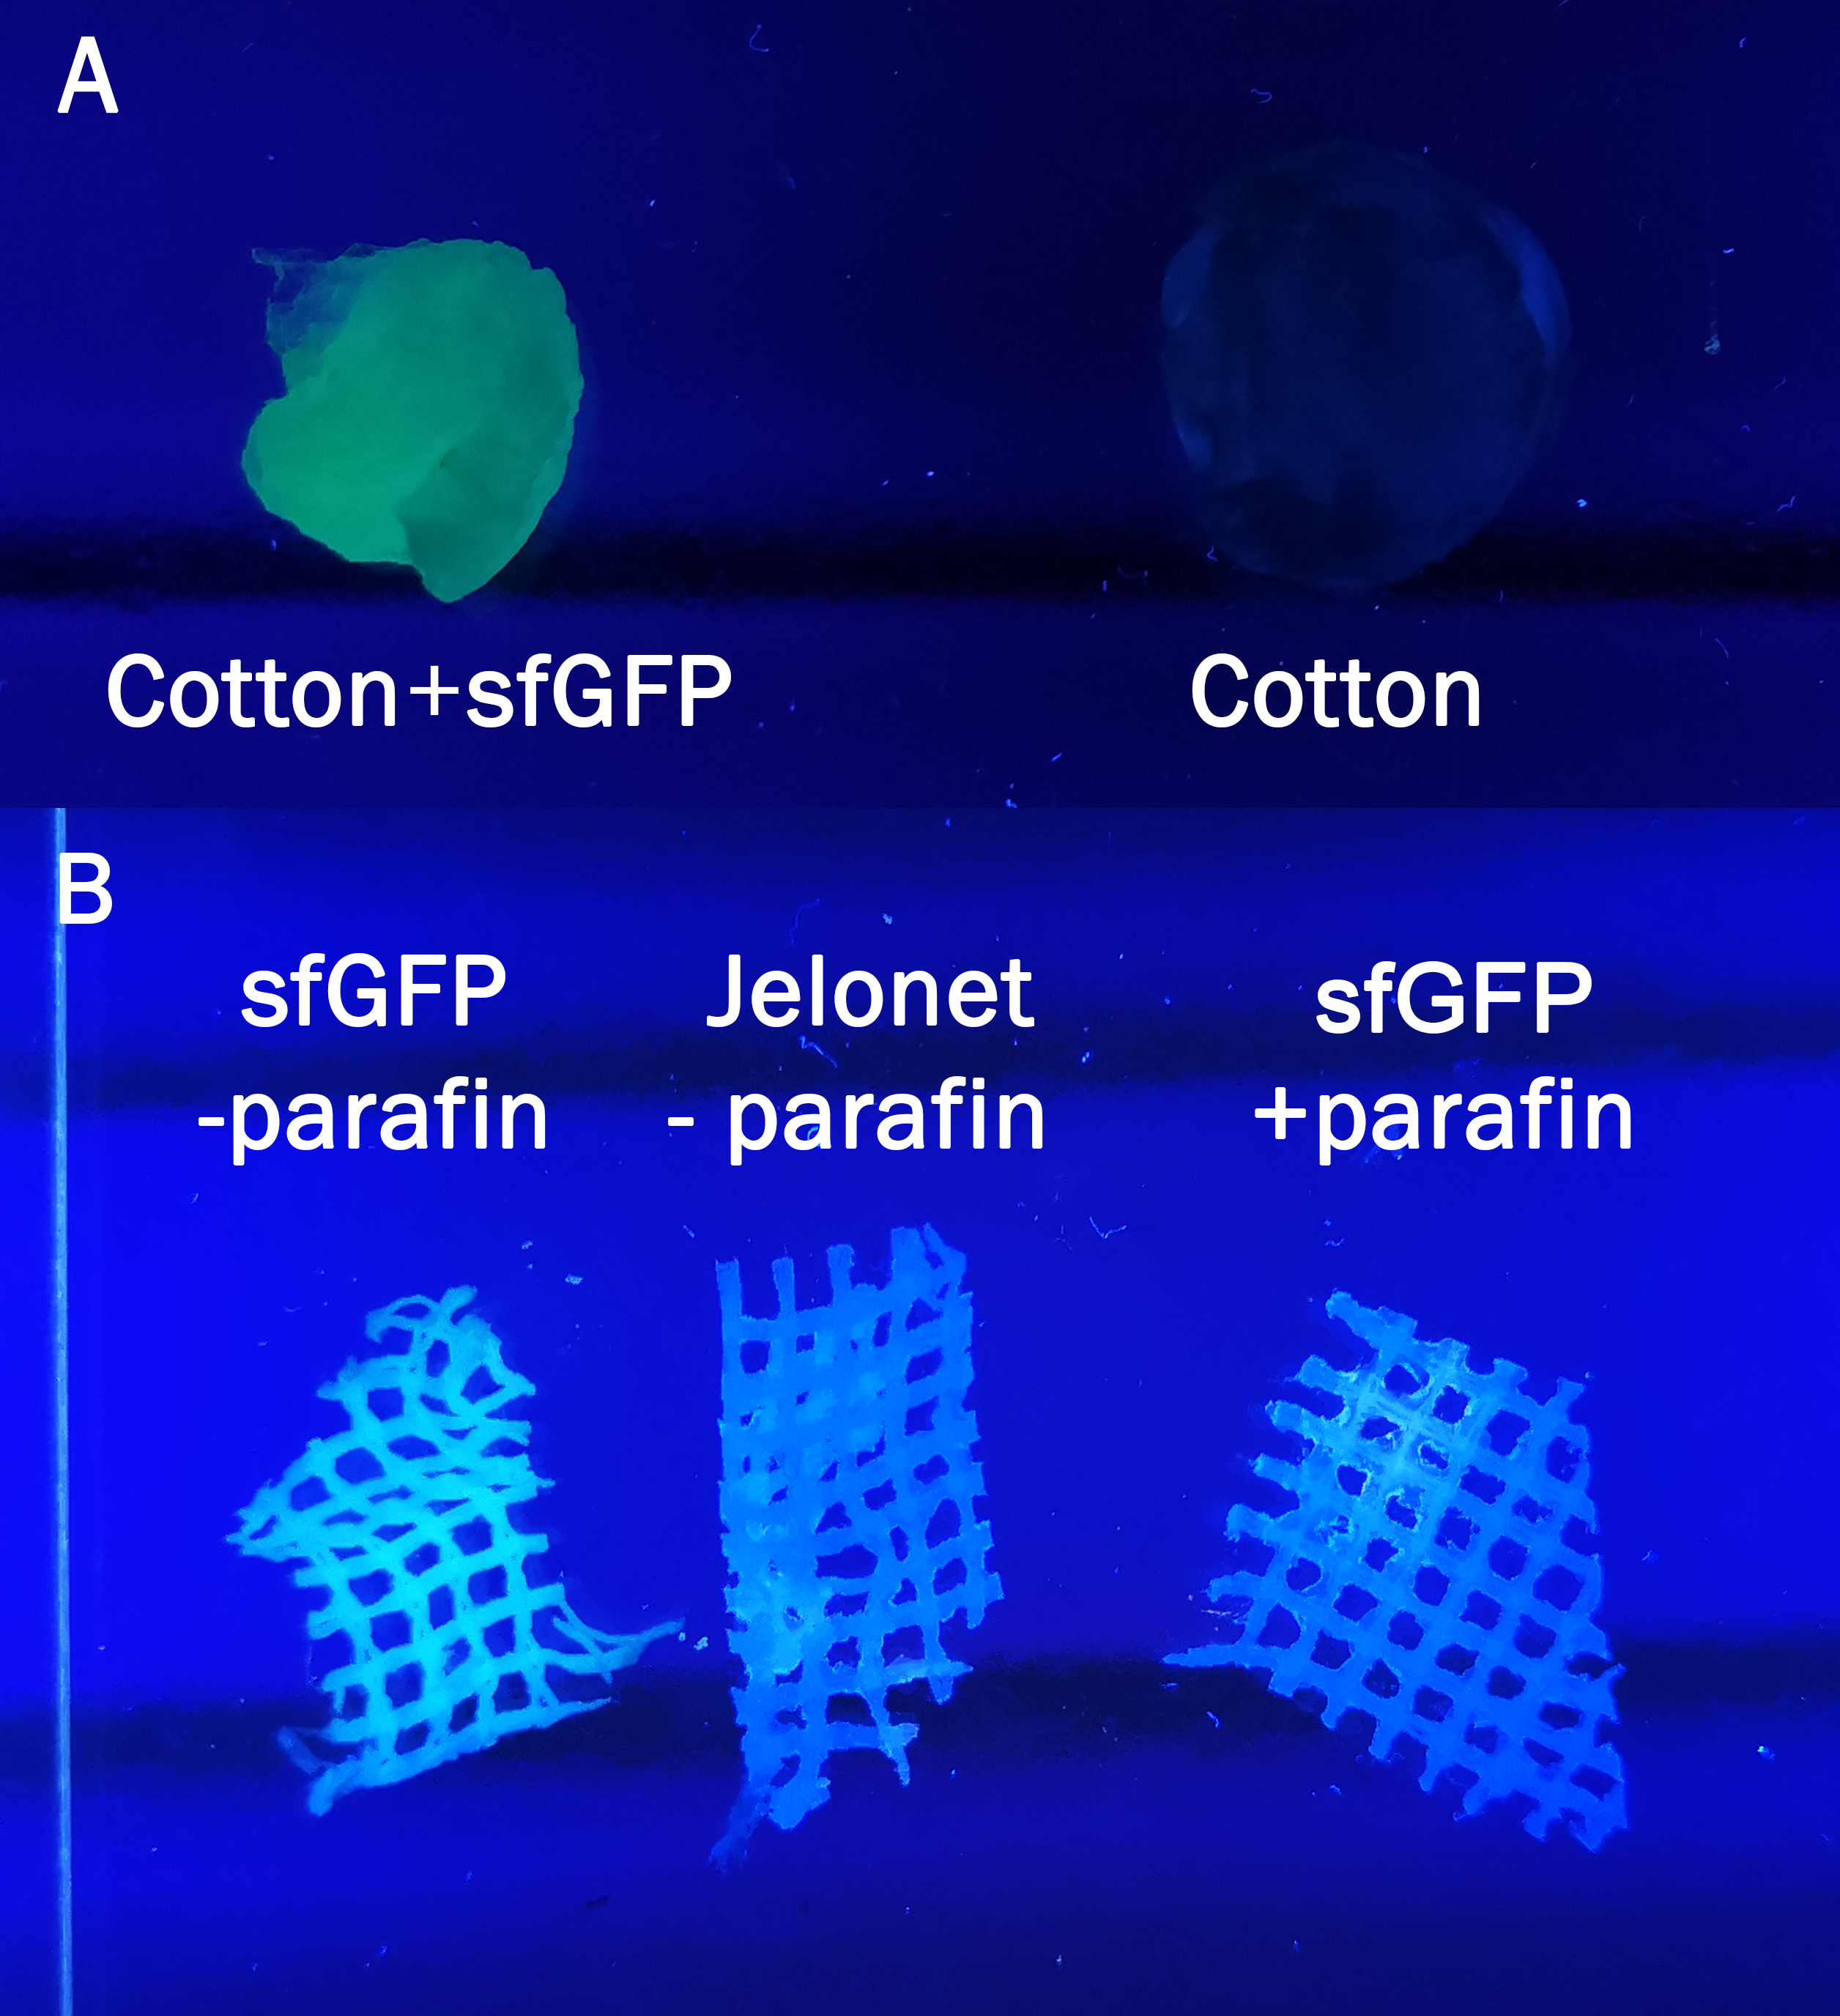
| − | [[File:T--Linkoping_Sweden--cottonandjelonet.png|400px|thumb|center|<b>Figure | + | [[File:T--Linkoping_Sweden--cottonandjelonet.png|400px|thumb|center|<b>Figure 7.</b> The cotton (A) and jelonet +parafin and -parafin (B) without sfGFP written out refers to negative controls. Both pictures are taken with a UV-table (302nm). <I>A</I> Cotton was incubated in bacterial lysate containing CBD-sfGFP for 30min and both cotton samples were washed with 70% ethanol before analyzing on the UV-table<I>B</I> The jelonet bandage was . ]] |
All of the photos above utilised the same BL21 (DE3) Gold CBD-sfGFP lysate and was incubated the same amount of time, 30min in room temperature. Both the CBD-sfGFP bound agarose and agarose that was not incubated CBD-sfGFP was washed in 70% ethanol once. | All of the photos above utilised the same BL21 (DE3) Gold CBD-sfGFP lysate and was incubated the same amount of time, 30min in room temperature. Both the CBD-sfGFP bound agarose and agarose that was not incubated CBD-sfGFP was washed in 70% ethanol once. | ||
| Line 64: | Line 64: | ||
<br><br><br> | <br><br><br> | ||
<h2> Purification of CBD-sfGFP</h2> | <h2> Purification of CBD-sfGFP</h2> | ||
| − | [[File:T--Linkoping_Sweden--sfgfp-cbd-elution.png|500px|thumb|left|<b>Figure | + | [[File:T--Linkoping_Sweden--sfgfp-cbd-elution.png|500px|thumb|left|<b>Figure 8.</b>Purification with 2g of cellulose (Whatman, #CF11 medium length cellulose fibres) in a column. The first striped bar is the flowthrough after adding BL21 (DE3) Gold lysate. The black bars are the RFU of the 70% ethanol washes. The blue bars are the distilled water (dH2O) elutions in which 1mL dH2O was added until the column stopped dropping. The red and grey ethanol 70% and dH2O bars illustrate the possible interfering RFU values of each fluid.]] |
CBD-sfGFP was purified with 2g cellulose fibres medium length (Whatman, #CF11) in a column. The first striped graph is the flowthrough after adding BL21 (DE3) Gold lysate. | CBD-sfGFP was purified with 2g cellulose fibres medium length (Whatman, #CF11) in a column. The first striped graph is the flowthrough after adding BL21 (DE3) Gold lysate. | ||
| Line 70: | Line 70: | ||
The different washes of 70% ethanol (black bars) was to remove unspecifically bound CBD-sfGFP, leading to the bound CBD-sfGFP remaining. This can be seen in the bar graph due to the drastic drop of sfGFP elution which means that the 70% ethanol is not useful for CBD-sfGFP elution. The water washes (dH2O, blue bars) indicate that an efficient elution of CBD-sfGFP can be performed within the first 4-6 elutions of dH2O. The last two bars (red, ethanol 70% and grey, dH2O) indicate the endogenous fluorescent abilities of each solution. It is minimal for ethanol and none for dH2O. | The different washes of 70% ethanol (black bars) was to remove unspecifically bound CBD-sfGFP, leading to the bound CBD-sfGFP remaining. This can be seen in the bar graph due to the drastic drop of sfGFP elution which means that the 70% ethanol is not useful for CBD-sfGFP elution. The water washes (dH2O, blue bars) indicate that an efficient elution of CBD-sfGFP can be performed within the first 4-6 elutions of dH2O. The last two bars (red, ethanol 70% and grey, dH2O) indicate the endogenous fluorescent abilities of each solution. It is minimal for ethanol and none for dH2O. | ||
<br><br> | <br><br> | ||
| − | The washes and elutions can be observed in an SDS-gel in figure | + | The washes and elutions can be observed in an SDS-gel in figure 13 below. In which the lanes 3-6 contains the four washes with 70 % ethanol and lanes 7-10 contains the four first elution fractions with dH2O. |
<br><br><br><br><br><br><br><br> | <br><br><br><br><br><br><br><br> | ||
<h2> Binding assays of CBD-sfGFP </h2> | <h2> Binding assays of CBD-sfGFP </h2> | ||
| − | [[File:T--Linkoping_Sweden--progressive_sfGFP_binding_assay.jpeg|420px|thumb|left|<b><I>Figure | + | [[File:T--Linkoping_Sweden--progressive_sfGFP_binding_assay.jpeg|420px|thumb|left|<b><I>Figure 9.</I></b> This graph describes the fluorescence of CBD-sfGFP lysate after incubation with cellulose CF11. The volume of bacterial lysate remained constant att 700 ul and the mass of cellulose CF11 was varied between 0-100 mg, which can be seen on the x-axis. The fluorescence was plotted on the y-axis and was measured at emission 510 nm with a gain of 40.]] </h3> |
The illustration to the left, see figure X, shows that increasing amount of cellulose CF11 fibers increases the binding of CBD-sfGFP. | The illustration to the left, see figure X, shows that increasing amount of cellulose CF11 fibers increases the binding of CBD-sfGFP. | ||
| Line 86: | Line 86: | ||
| − | [[File:T--Linkoping_Sweden--sfGFP_binding_capability.jpg|420px|thumb|left|<b><I>Figure | + | [[File:T--Linkoping_Sweden--sfGFP_binding_capability.jpg|420px|thumb|left|<b><I>Figure 10.</I></b> This graph depicts the total binding capability of CBD-sfGFP to the cellulose bandage over time, measured by absorbance spectrometry at the 492.5 nm. Plotted on the y-axis is the absorbance at 485 nm and on the x-axis is time in minutes. The difference between the first and last absorbance value is proportional to the total binding of a cellulose bandage.]] |
<br><br><br><br><br><br><br><br> | <br><br><br><br><br><br><br><br> | ||
<h3>Binding capability of CBD-sfGFP</h3> | <h3>Binding capability of CBD-sfGFP</h3> | ||
| Line 103: | Line 103: | ||
<h2>Reporter of successful cleavage and release from the cellulose binding domain</h2> | <h2>Reporter of successful cleavage and release from the cellulose binding domain</h2> | ||
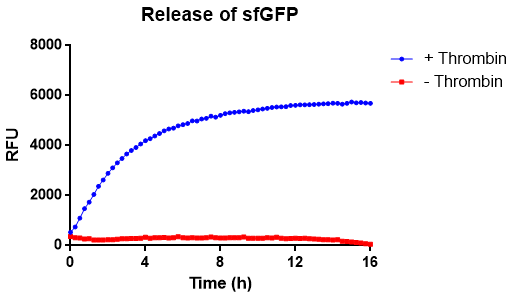
| − | [[File:T--Linkoping_Sweden--trombinövertid.png|420px|thumb|left|<b>Figure | + | [[File:T--Linkoping_Sweden--trombinövertid.png|420px|thumb|left|<b>Figure 11.</b> A kinetic experiment of thrombins protease activity. Bacterial cellulose, with CBDcipA-sfGFP attached, were analyzed spectrophotometrically.]] |
<h3>Spectrophotometrically analysis of thrombin cleavage</h3> | <h3>Spectrophotometrically analysis of thrombin cleavage</h3> | ||
| Line 109: | Line 109: | ||
<br><br><br><br><br><br> | <br><br><br><br><br><br> | ||
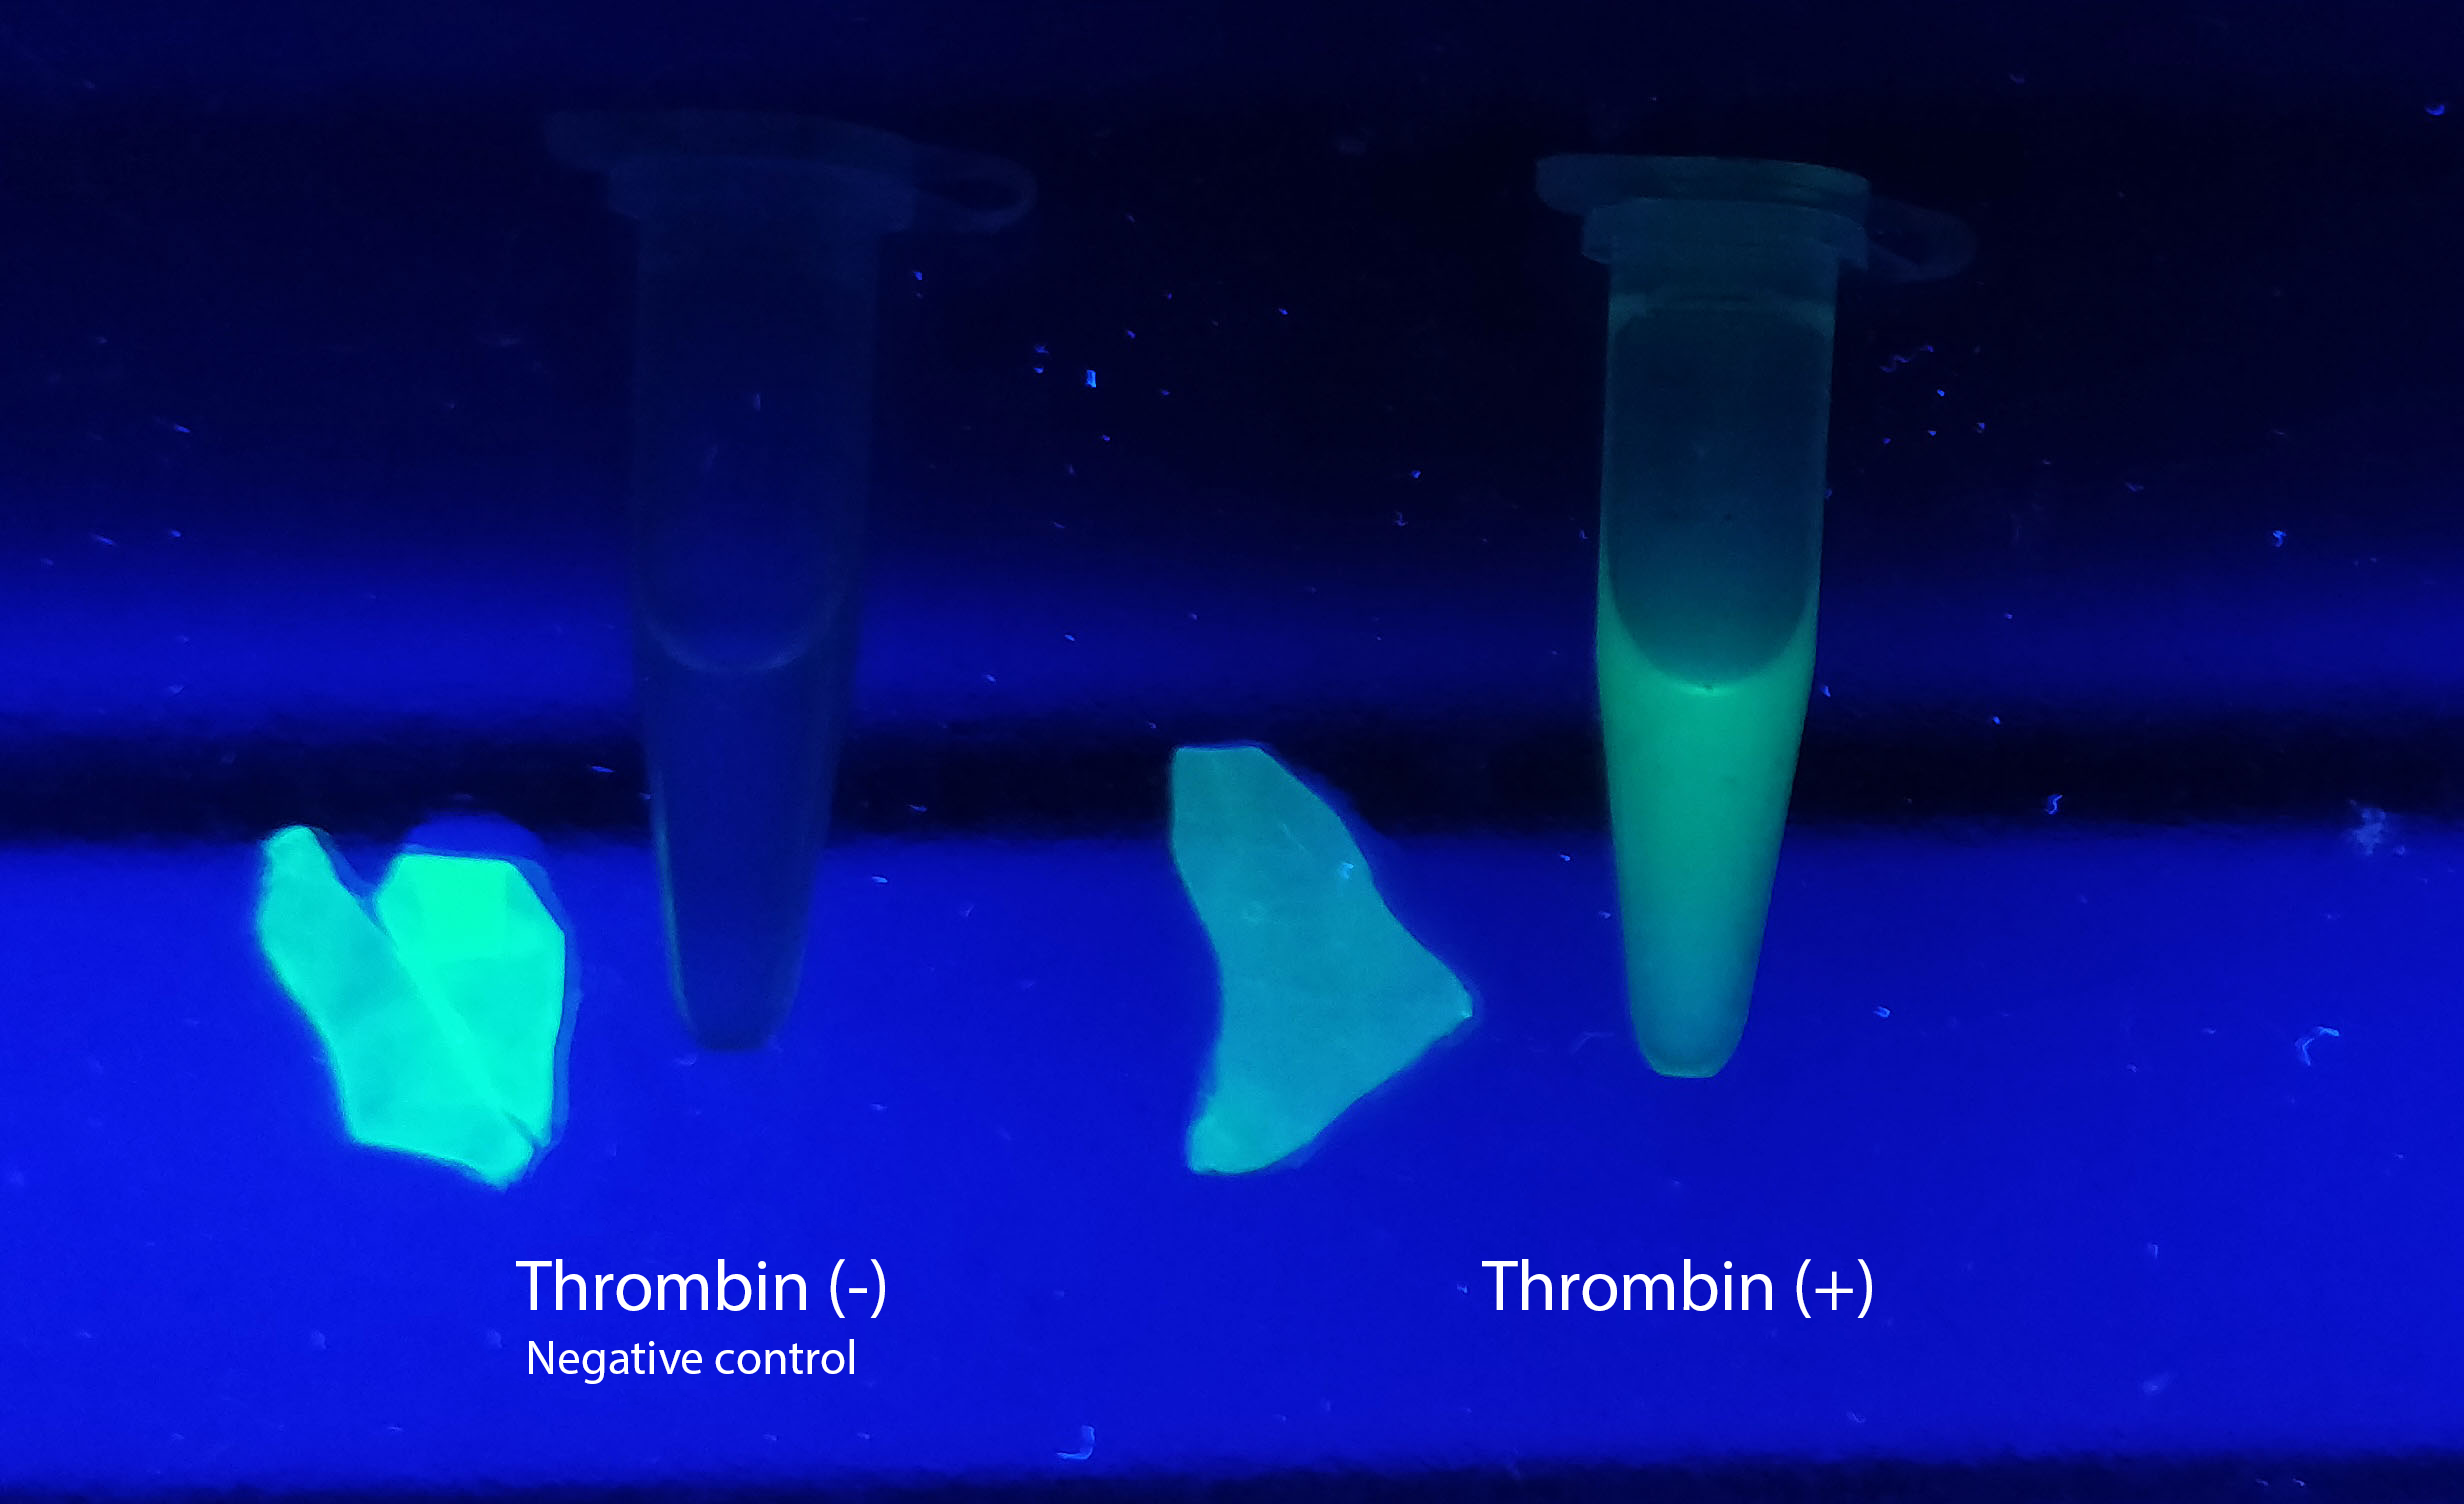
| − | [[File:T--Linkoping_Sweden--Thrombincontrolphoto.jpg|420px|thumb|left|<b>Figure | + | [[File:T--Linkoping_Sweden--Thrombincontrolphoto.jpg|420px|thumb|left|<b>Figure 12.</b> Visual control of human thrombin protease activity. Bacterial cellulose was incubated with CBDcipA-sfGFP for 30 minutes on an end-to-end rotator in room temperature. ]] |
<h3>Visual experiment of thrombin cleavage</h3> | <h3>Visual experiment of thrombin cleavage</h3> | ||
| Line 115: | Line 115: | ||
<br><br><br><br><br><br><br><br> | <br><br><br><br><br><br><br><br> | ||
| − | [[File:T--Linkoping_Sweden--GFPSDS.png|420px|thumb|left|<b>Figure | + | [[File:T--Linkoping_Sweden--GFPSDS.png|420px|thumb|left|<b>Figure 13.</b> SDS-PAGE analysis of CBDcipA-sfGFP and thrombin cleavage product. The gel to the left is a 4–20% Mini-PROTEAN® TGX™ by BioRad and the ladder is a PageRuler™ Prestained Protein Ladder. The gel was run at 200 V for 30 minutes. Lane 1 contains the ladder, lane 2 bacterial lysate with CBDcipA-sfGFP, lane 3-6 contains four washes with 70 % ethanol, lane 7-10 contains four elution fractions with deionized water. Lane 11 contains sfGFP (from cleaving with thrombin).]] |
<h3>SDS-PAGE analysis of cleavage and expression</h3> | <h3>SDS-PAGE analysis of cleavage and expression</h3> | ||
Revision as of 14:15, 13 October 2019
Contents
Sequence and Features
- 10COMPATIBLE WITH RFC[10]
- 12COMPATIBLE WITH RFC[12]
- 21INCOMPATIBLE WITH RFC[21]Illegal BamHI site found at 580
- 23COMPATIBLE WITH RFC[23]
- 25COMPATIBLE WITH RFC[25]
- 1000INCOMPATIBLE WITH RFC[1000]Illegal SapI.rc site found at 598
Introduction
pT7-CBDcipA-sfGFP
This part consists of a carbohydrate binding domain (CBD) from Clostridium thermocellum (C. thermocellum) cellulose scaffolding protein (CipA). This binding domain is a central part of Clostridium thermocellum's cellusome and has a strong affinity for cellulose. The CBD was fused to another protein using a flexible GS-linker (-GGGGSGGGGS-)in order to attach this complex to a polysaccaride material. A thrombin cleavage site (-LVPRGS-) was added to the end of the linker and its breakage will leave a glycine and serine attached to the N-terminal of the fusion protein.
Protease site and use
The thrombin site was added to enable the ability to release the fusion protein down into skin wounds. Thanks to our integrated human practice we learned that infections span much deeper into wounds that we thought. Simply attaching the CBD-fusion protein to a carbohydrate material would not enable the fusion protein to reach far into the wound. The thrombin site was also chosen because of thrombin's endogenous existence in humans.
Assembly compabilities
An internal BamHI recognition sequence (RS) has been added to enable interchangeable fusion proteins to the CBD. BamHI was chosen because its RS codes for glycine and serine, fitting it to the end of the thrombin site. It is also a cost-effective enzyme and is unaffected by methylated DNA. BamHI is a part of the RFC21 standard.
CBDcipA crystal structure
Important molecular faces
CBDcipA is composed of a nine-stranded beta sandwich with a jelly roll topology and binds a calcium ion. It further contains conserved residues exposed on the surface which map into two clear surfaces on each side of the molecule. One of the faces mainly contains planar strips of aromatic and polar residues which may be the carbohydrate binding part. Further aspects are unknown and unique to this CBD such as the other conserved residues which are contained in a groove.
Carbohydrate binding domain specificity
Since the CBD is from the cellusome of C. thermocellum some research labeled it a cellulose binding domain. However, iGEM19 Linköping noticed that this domain could also bind to different sources of polysaccaride materials. This serves as a domain for iGEM19 Linköpings modular bandage, where the polysaccaride material can be exchanged for other/similar materials and not exclusively cellulose.
The choice of carbohydrate binding domain
iGEM Linköping 2019 chose CBDcipA due to the fact that many other iGEM teams had explored the possibilities of this domain. Our basic design was influenced by [http://2014.igem.org/Team:Imperial iGEM14 Imperial], [http://2015.igem.org/Team:edinburgh iGEM15 Edinburgh] and [http://2018.igem.org/Team:ecuador iGEM18 Ecuador]. Purification and where to place the fusion protein (N- or C-terminal) was determined by studying the former projects. CBDcipA also originates from a thermophilic bacteria which further increases the domain's applications.
Expression system
The part has a very strong expression with a T7-RNA-polymerase promotor (BBa_I719005) as well as a 5'-UTR (BBa_K1758100) region which has been shown to further increase expression in E. coli (BBa_K1758106), ([http://www.ncbi.nlm.nih.gov/pubmed/2676996 Olins et al. 1989]), ([http://www.ncbi.nlm.nih.gov/pubmed/23927491 Takahashi et al. 2013]).

Usage and Biology
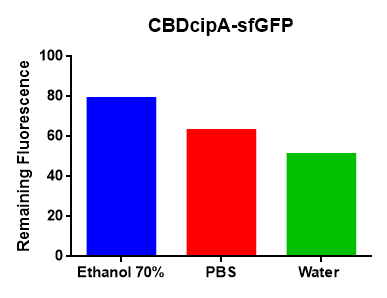
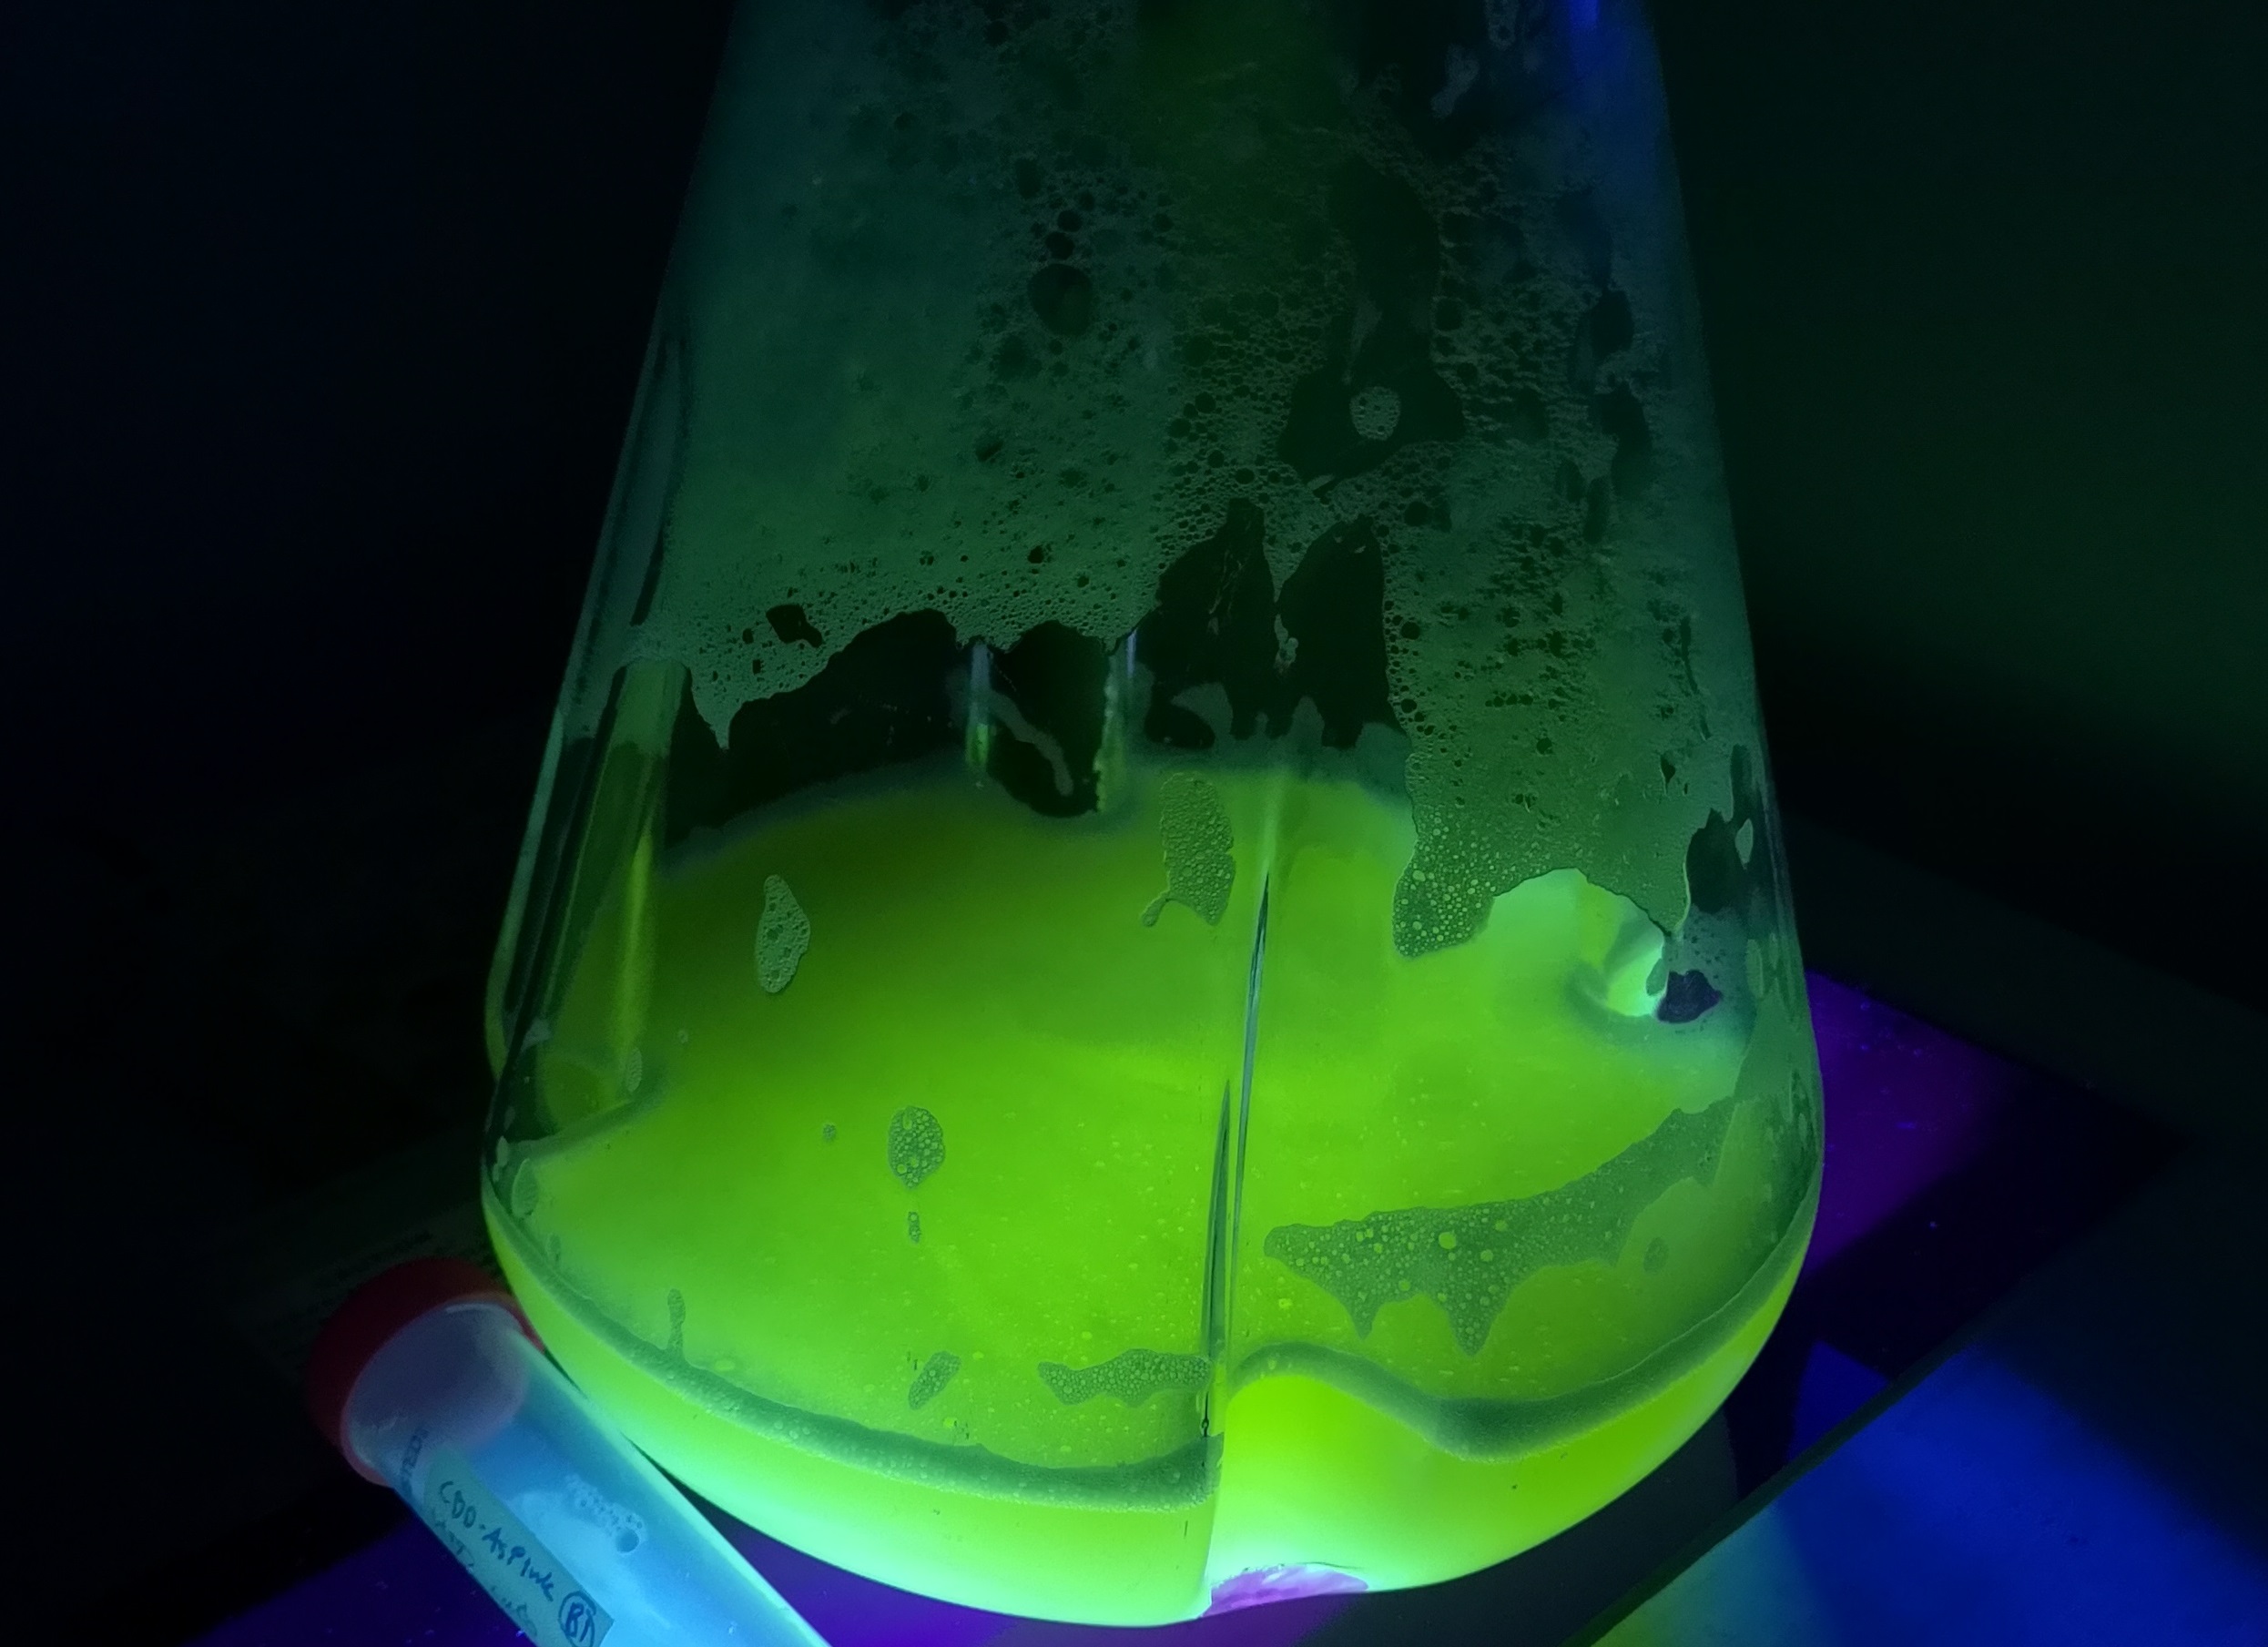
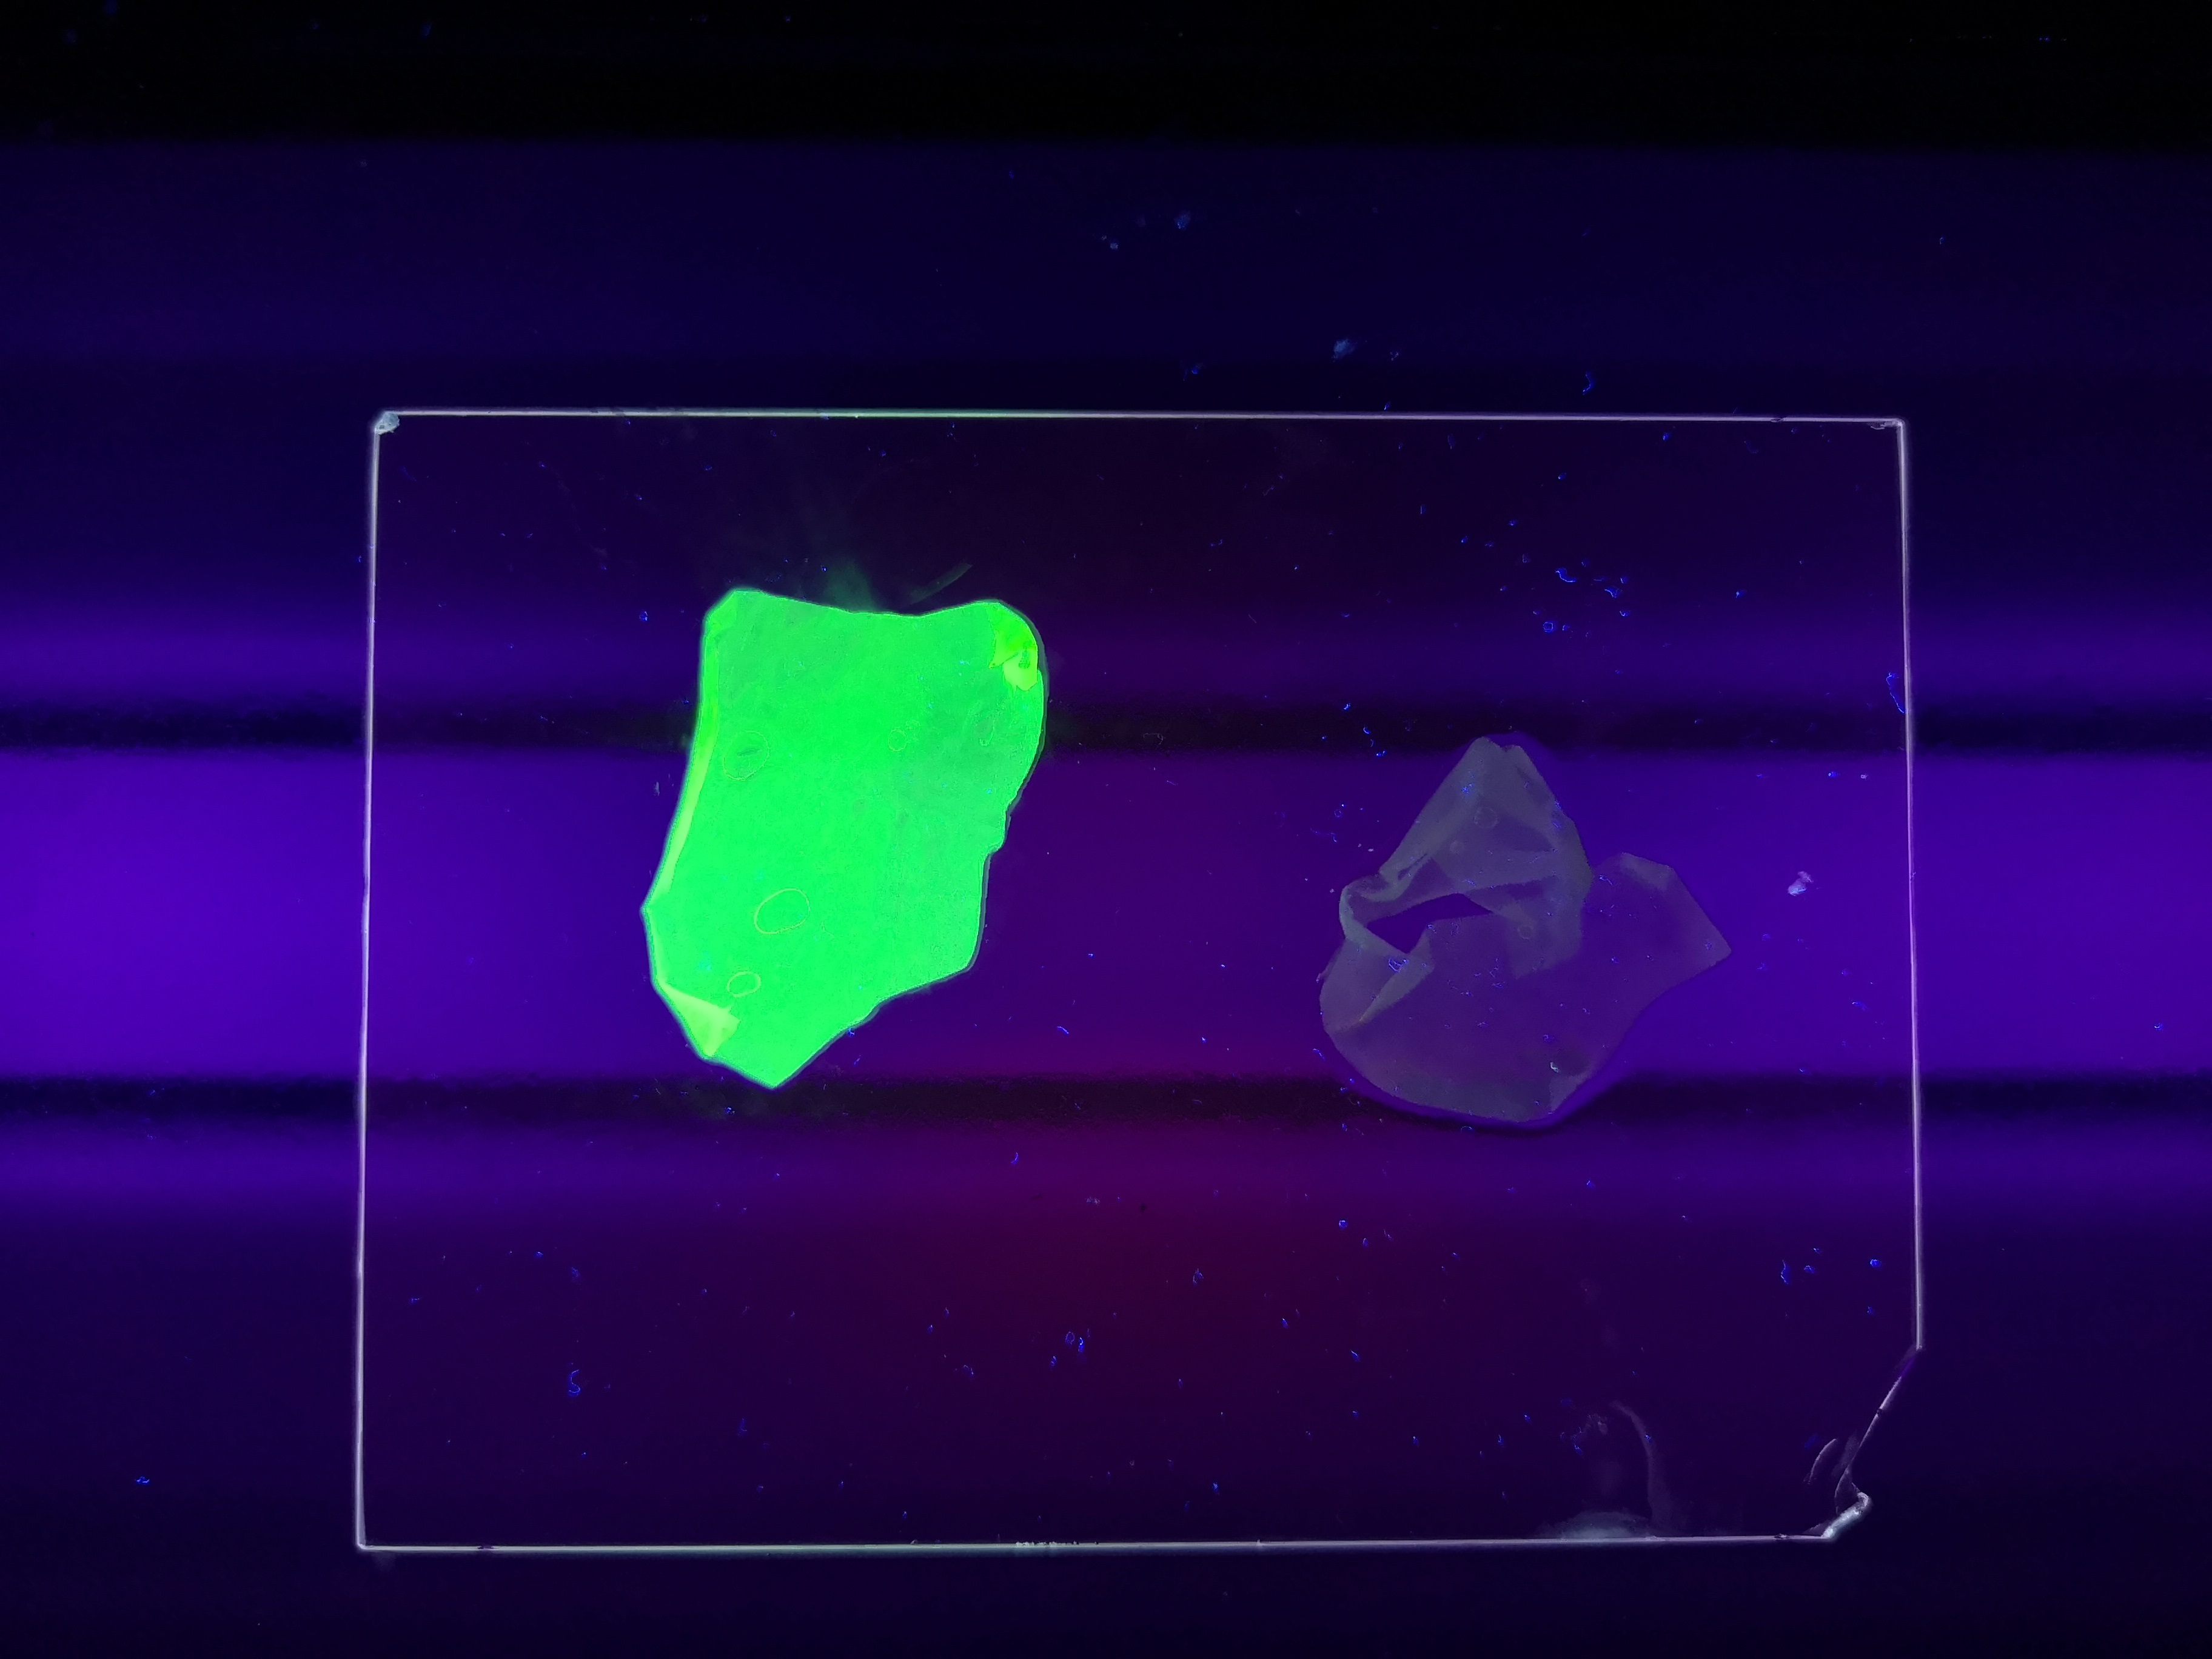 Figure 4 Picture 1: Binding studies of the CBDcipA-sfGFP bound to bacterial cellulose. Washed three times with either 70 % ethanol, PBS or deionized water. Picture 2: Induced culture after 16 hours. E. coli BL21 (DE3) cells were grown in prescence of 25 ug/mL chlorampenicol until an OD600 of 0.8 at 37 degrees Celsius, and later induced with 0.5 mM IPTG. The induced culture were then incubated in 16 degrees Celsius for 16 hours. Picture 3: Left: CBDcipA-sfGFP bound to bacterial cellulose in form of a thin film, right: bacterial cellulose reference. Binding of CBDcipA-sfGFP was done the same way as the pictures below.
Figure 5 Picture 1: Lysate containing CBDcipA-sfGFP with bacterial cellulose before incubation. Picture 2: Lysate (CBDcipA-sfGFP) bound to bacterial cellulose after incubation in room temperature for 30 minutes on an end-to-end rotator. Picture 3: Bacterial cellulose after incubation with 70 % ethanol in room temperature for 30 minutes on an end-to-end rotator. All pictures were taken on a 302 nm UV-table for better visualization of the result.
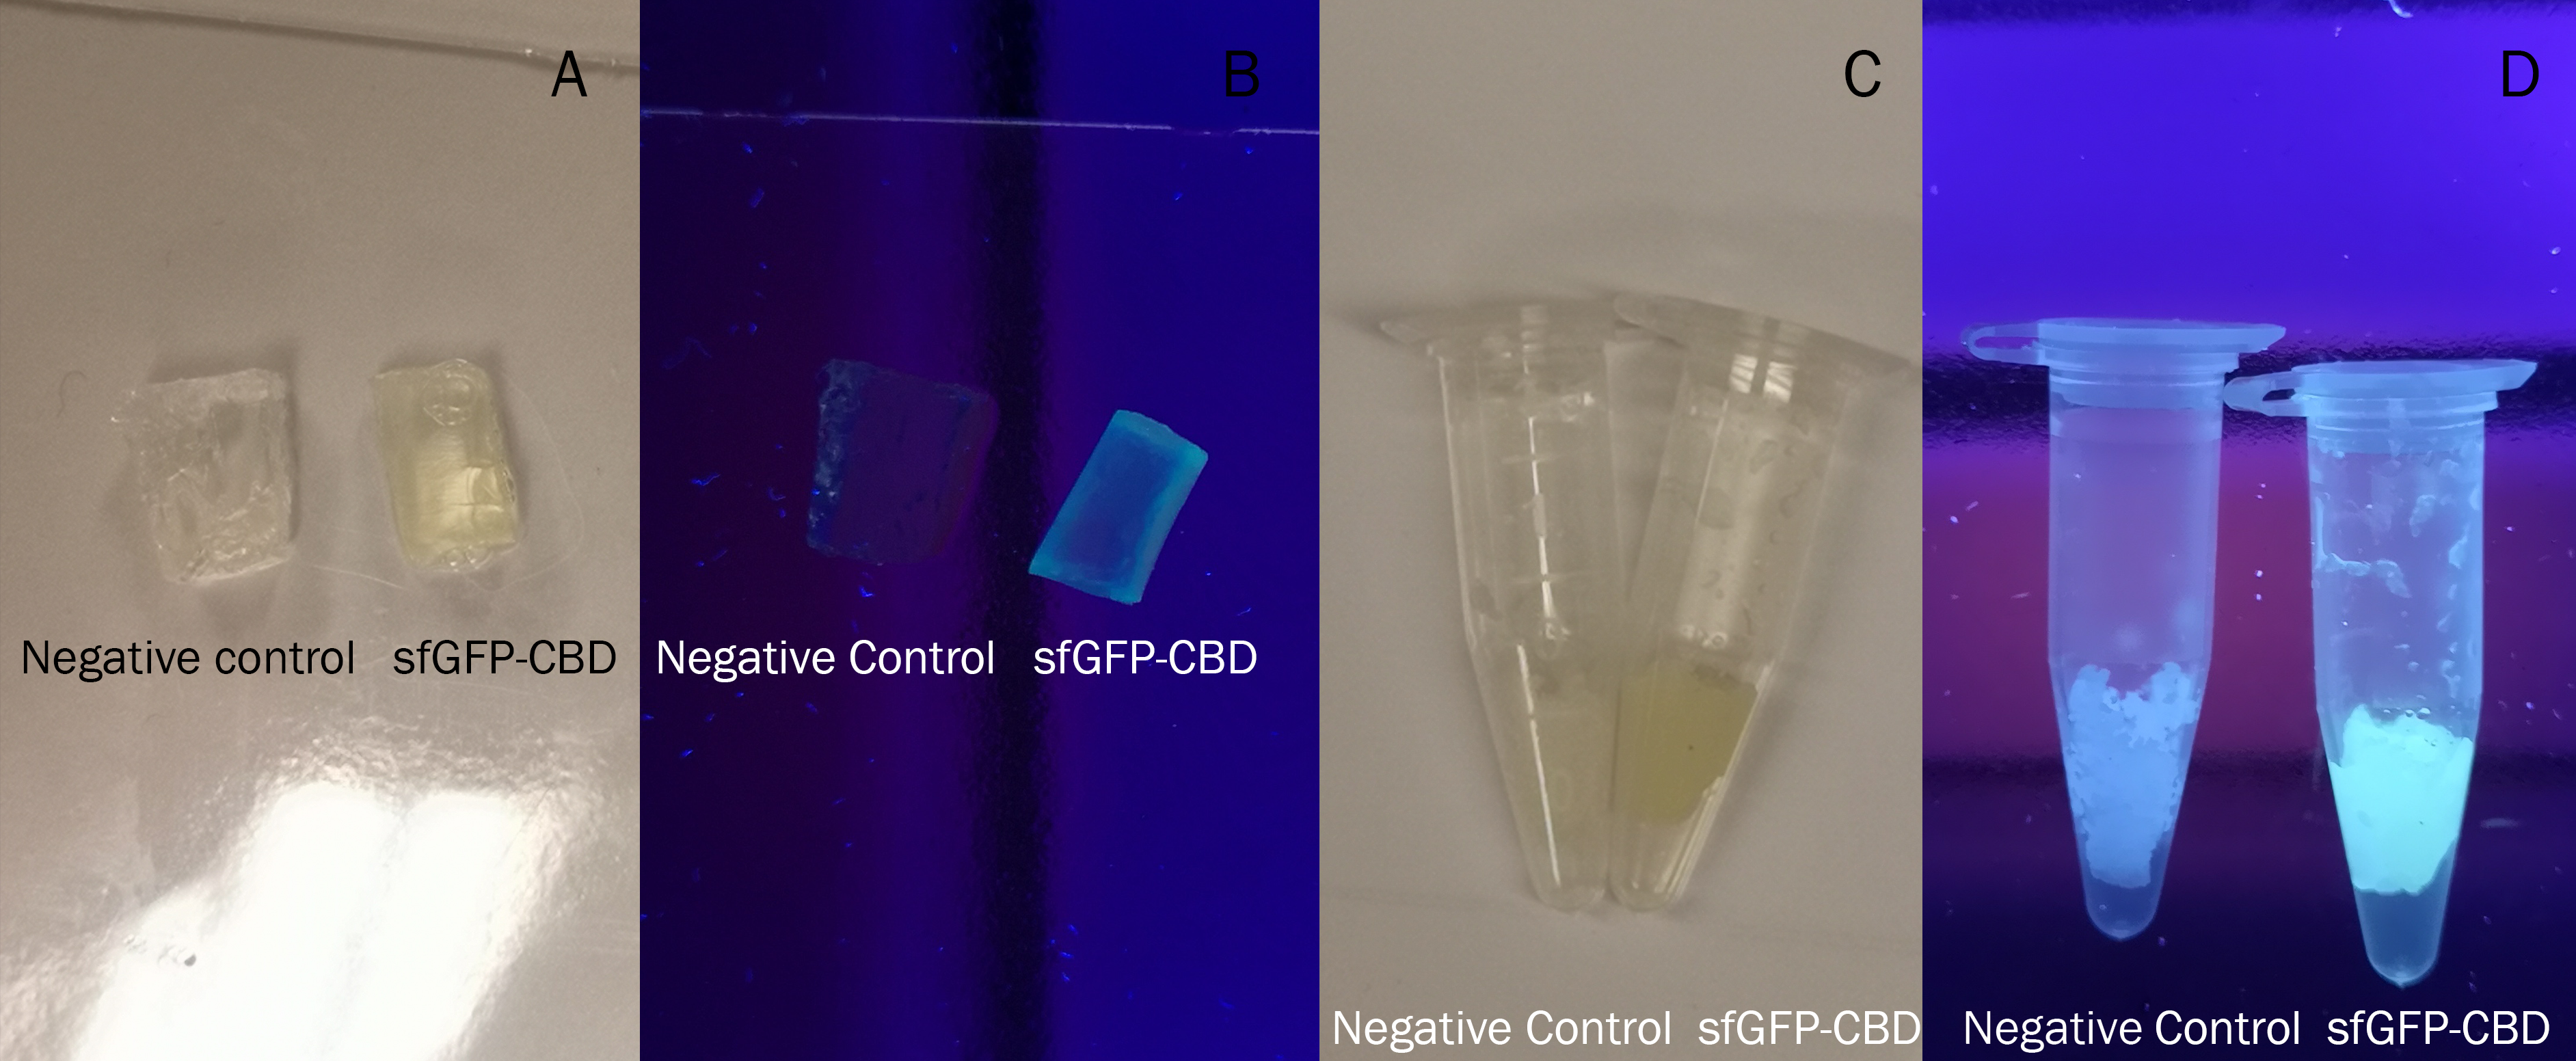
All of the photos above utilised the same BL21 (DE3) Gold CBD-sfGFP lysate and was incubated the same amount of time, 30min in room temperature. Both the CBD-sfGFP bound agarose and agarose that was not incubated CBD-sfGFP was washed in 70% ethanol once.
Purification of CBD-sfGFP
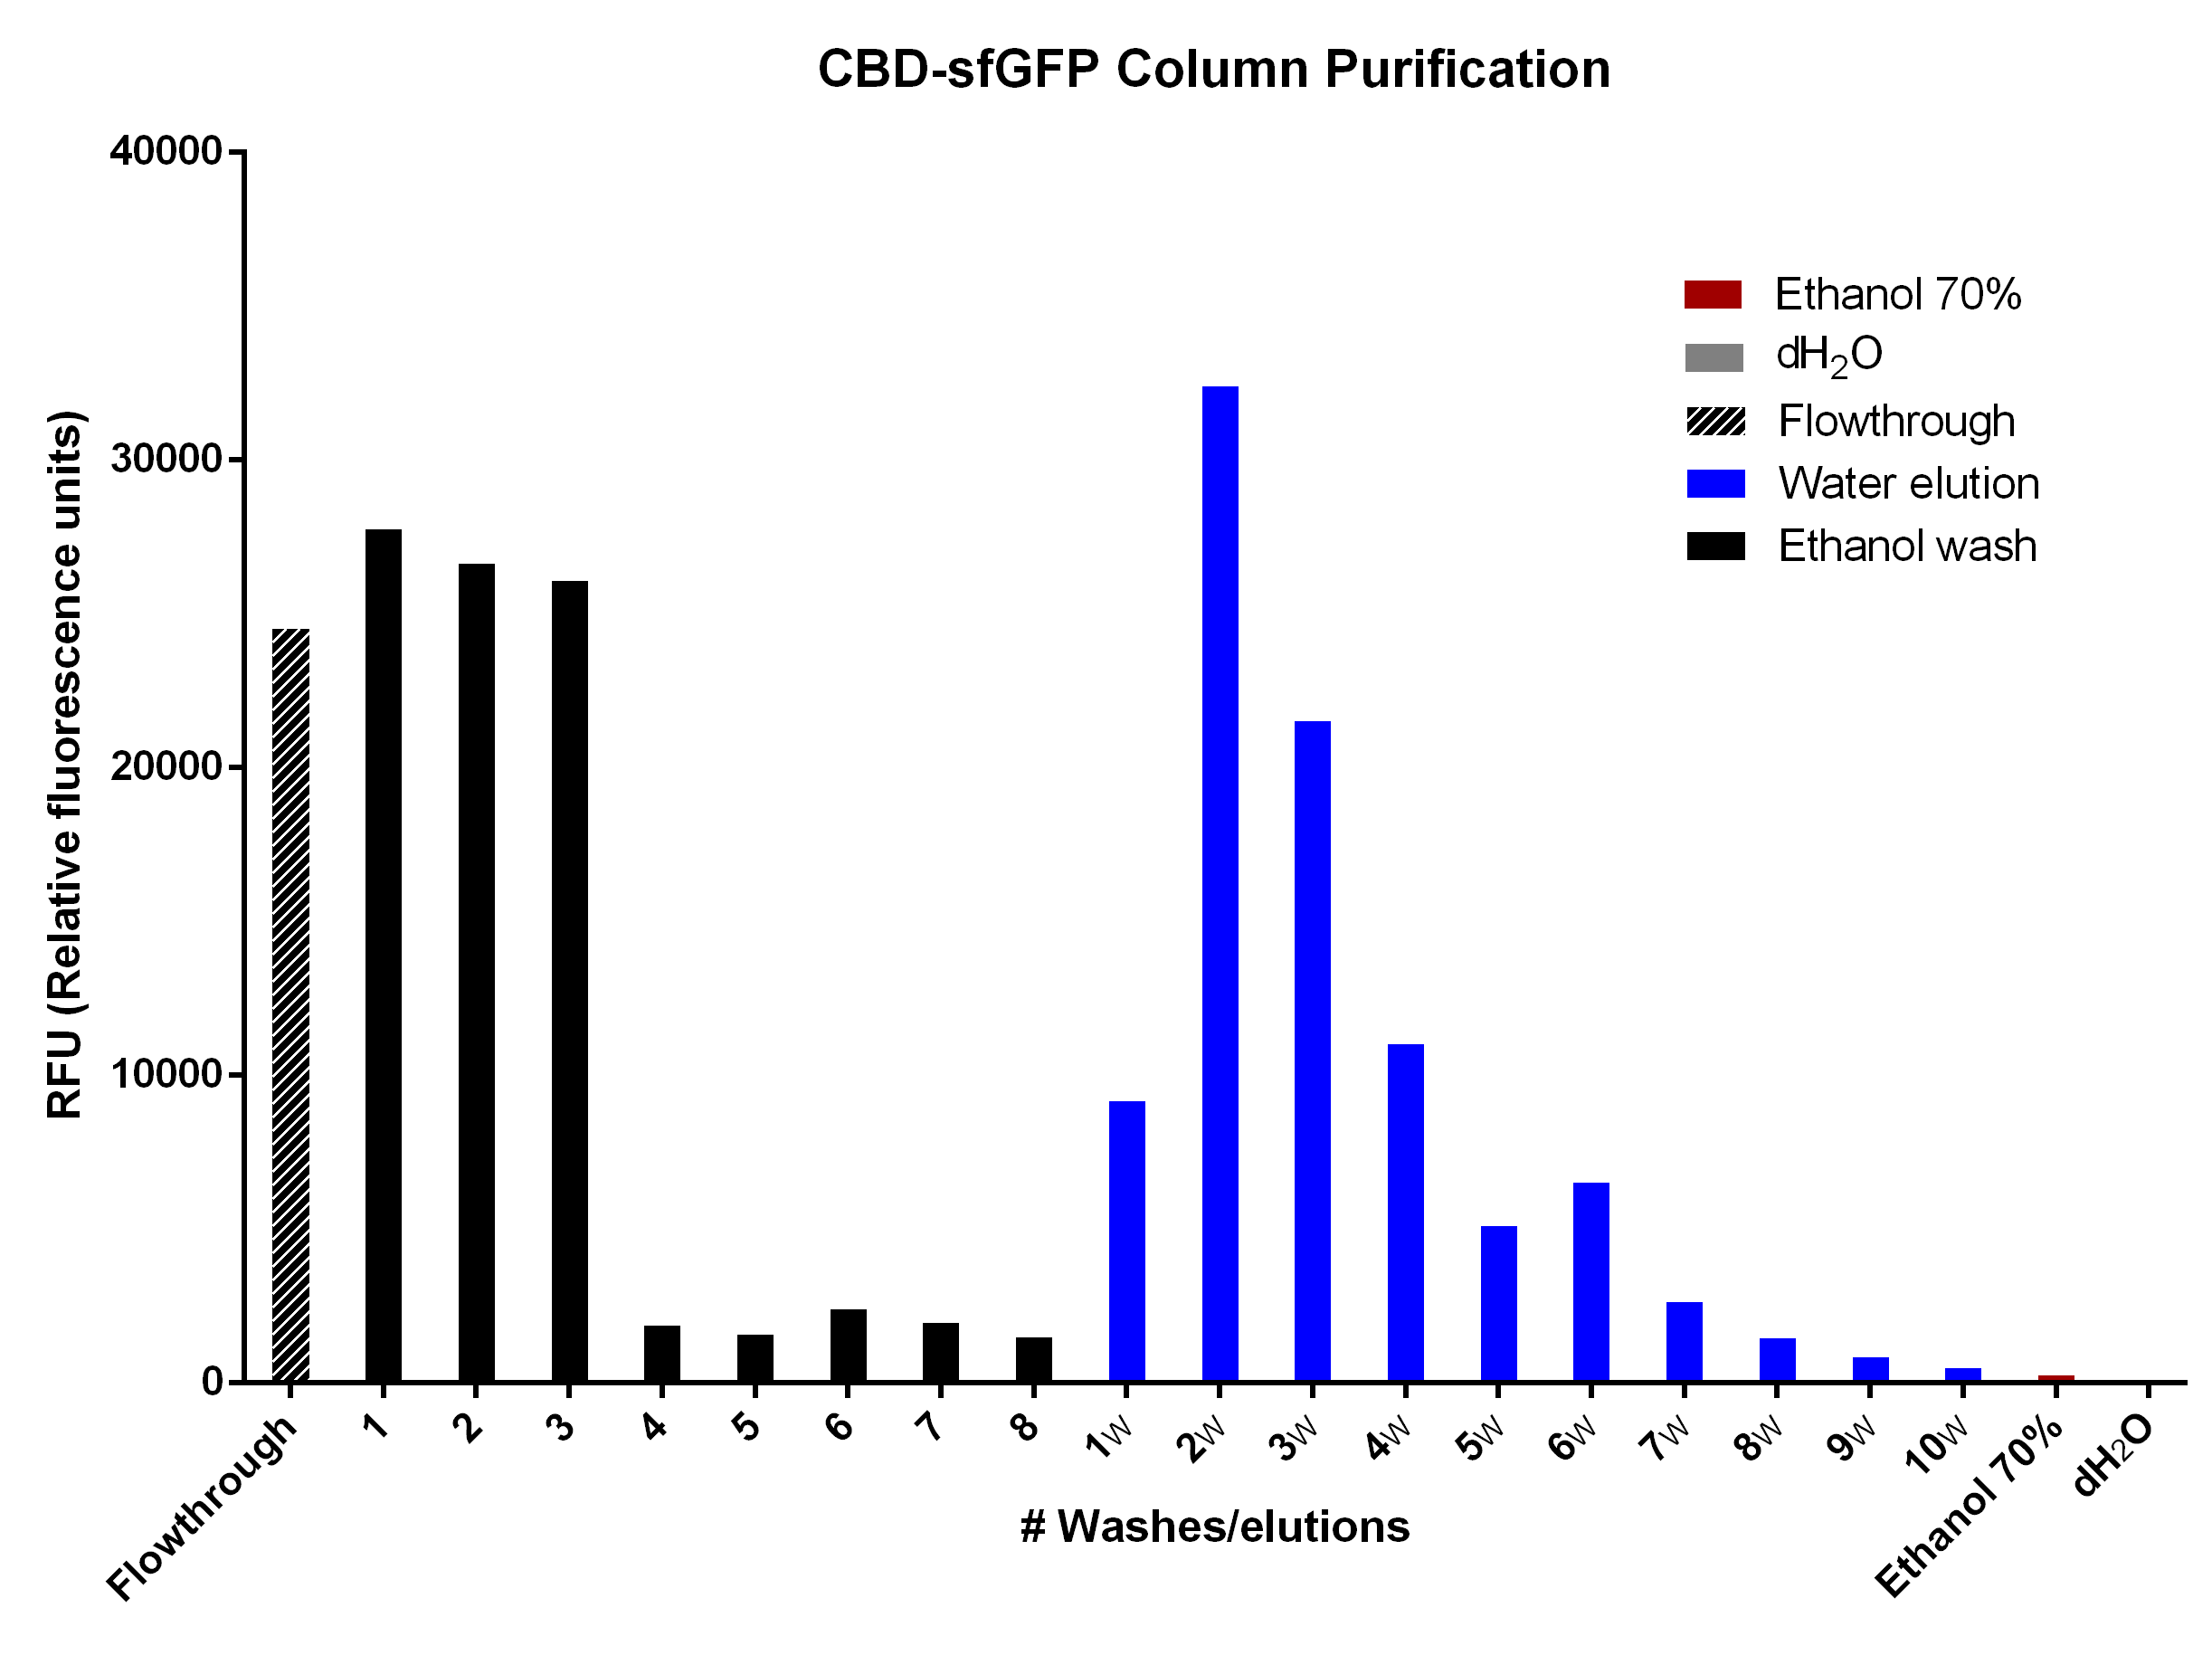
CBD-sfGFP was purified with 2g cellulose fibres medium length (Whatman, #CF11) in a column. The first striped graph is the flowthrough after adding BL21 (DE3) Gold lysate.
The different washes of 70% ethanol (black bars) was to remove unspecifically bound CBD-sfGFP, leading to the bound CBD-sfGFP remaining. This can be seen in the bar graph due to the drastic drop of sfGFP elution which means that the 70% ethanol is not useful for CBD-sfGFP elution. The water washes (dH2O, blue bars) indicate that an efficient elution of CBD-sfGFP can be performed within the first 4-6 elutions of dH2O. The last two bars (red, ethanol 70% and grey, dH2O) indicate the endogenous fluorescent abilities of each solution. It is minimal for ethanol and none for dH2O.
The washes and elutions can be observed in an SDS-gel in figure 13 below. In which the lanes 3-6 contains the four washes with 70 % ethanol and lanes 7-10 contains the four first elution fractions with dH2O.
Binding assays of CBD-sfGFP
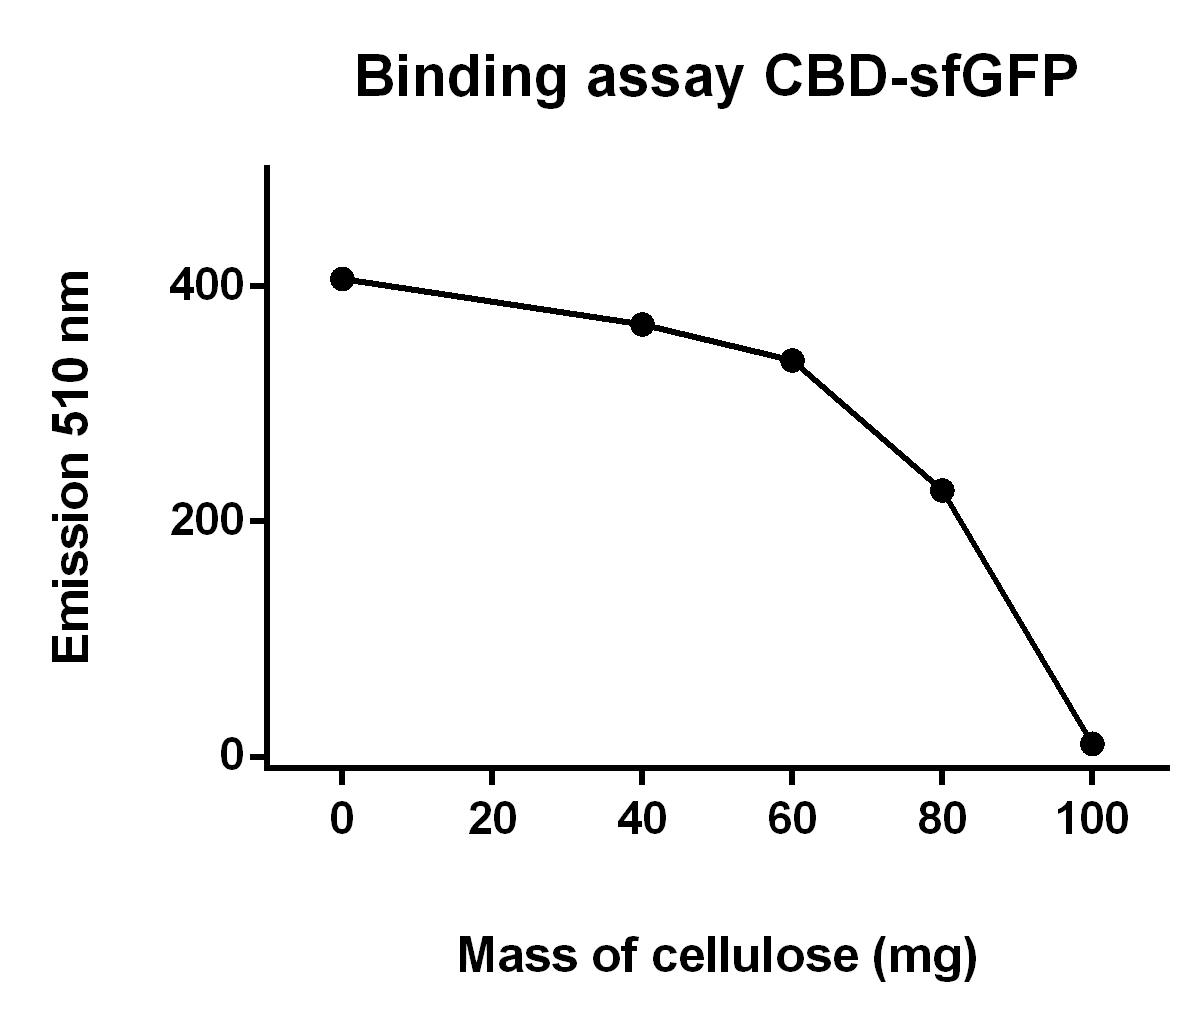
The illustration to the left, see figure X, shows that increasing amount of cellulose CF11 fibers increases the binding of CBD-sfGFP.
To make the binding assay, Eppendorf tubes with varying mass of cellulose between 0.00 - 1.00 g was mixed with a constant volume of CBD-sfGFP lysate (700 uL) and vortexed. The tubes was then attached to a end-to-end rotator for 30 minutes, thereafter they were placed in a tube holder until the cellulose powder settled in the bottom and the supernatant containing lysate was clear of cellulose. After that 100 µL from each of the supernatants was applied on a plate reader which measured the fluorescence of CBD-sfGFP at xx nm.

Binding capability of CBD-sfGFP
The figure to the left resembles the binding capability of CBD-sfGFP to the cellulose bandage over time, measured by absorbance spectrometry at the 492.5 nm.
According to studies of sfGFP the absorption maximum is 485 nm, but in this study CBD-sfGFP had the absorption maximum at 492.5 nm. This leads to a change of absorption coefficient value (epsilon), which could not be found so instead a value of epsilon at 485 nm were used for calculating the binding capability of the protein. At 492.5 nm around ~93% of the electrons is excited which leads to an approximate value of the amount that could bind in to the cellulose surface per square cm.
This was done by incubating 6 ml purified CBD-sfGFP solved in 650 ul 10x PBS with 0.2 g of a cellulosebandage with an area of 4.05 cm^2. The absorbance dropped 0.113 until the curve subside. Using this data and the molar absorbance of sfGFP at 481 nm, we could calculate the total amount of sfGFP that could bind into the bandage over time.
In this study the calculated value of 22,22 µg per cm^2 sfGFP that could bind into the cellulose bandage. This bindning assay was not done at 4°C, which could lead to a less efficient binding capability of the protein.
Reporter of successful cleavage and release from the cellulose binding domain
Spectrophotometrically analysis of thrombin cleavage
In figure X the release of sfGFP from our bacterial cellulose bandage can be seen over time. The cellulose-CBD-sfGFP were attached to the side of wells of a 96-well plate and 200 uL 1X thrombin cleavage buffer (20 mM Tris-HCl, 150 mM NaCl and 2.5 mM CaCl2) were added. To the wells with cellulose-CBDcipA-sfGFP and buffer, 0.03 units of human thrombin were added and fluorescence (ex. 485 nm, em. 510 nm) were measured from the bottom and up (center of the well) for 16 hours. The temperature was set to 37 degrees Celsius. In blue, successful release of sfGFP from the CBD can be seen. In red, the control experiment can be seen, where no thrombin was added.
Visual experiment of thrombin cleavage
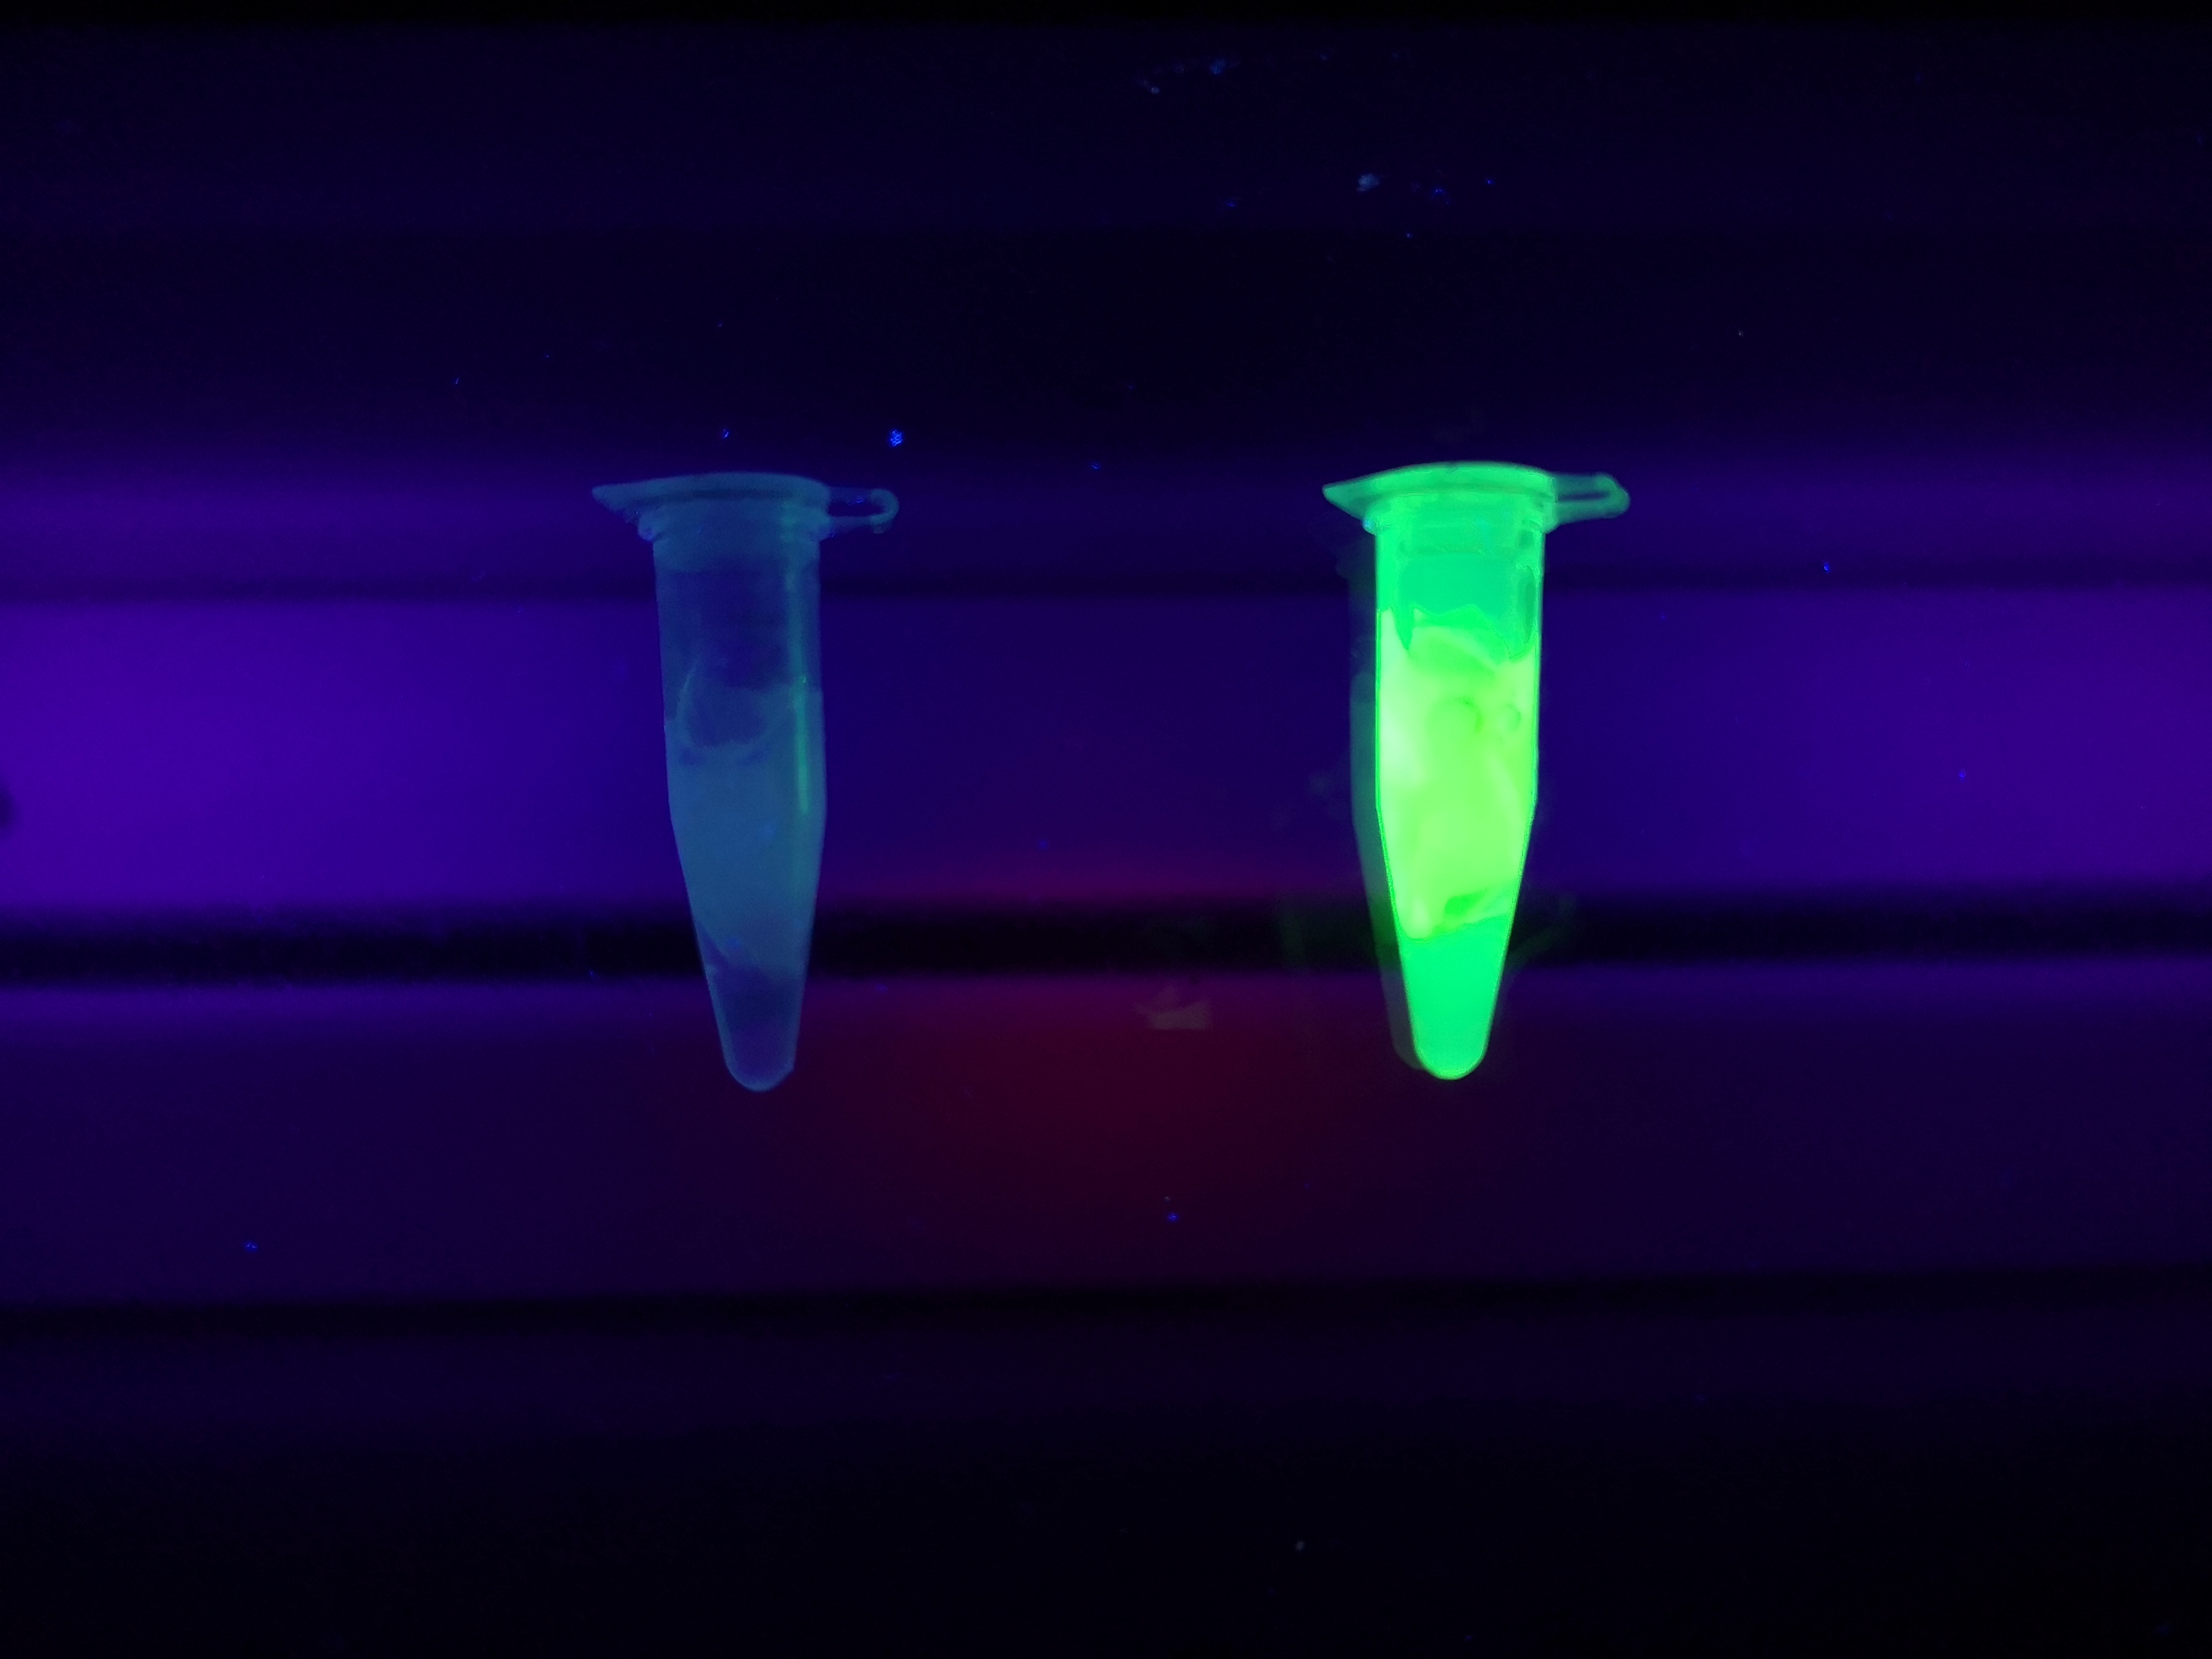
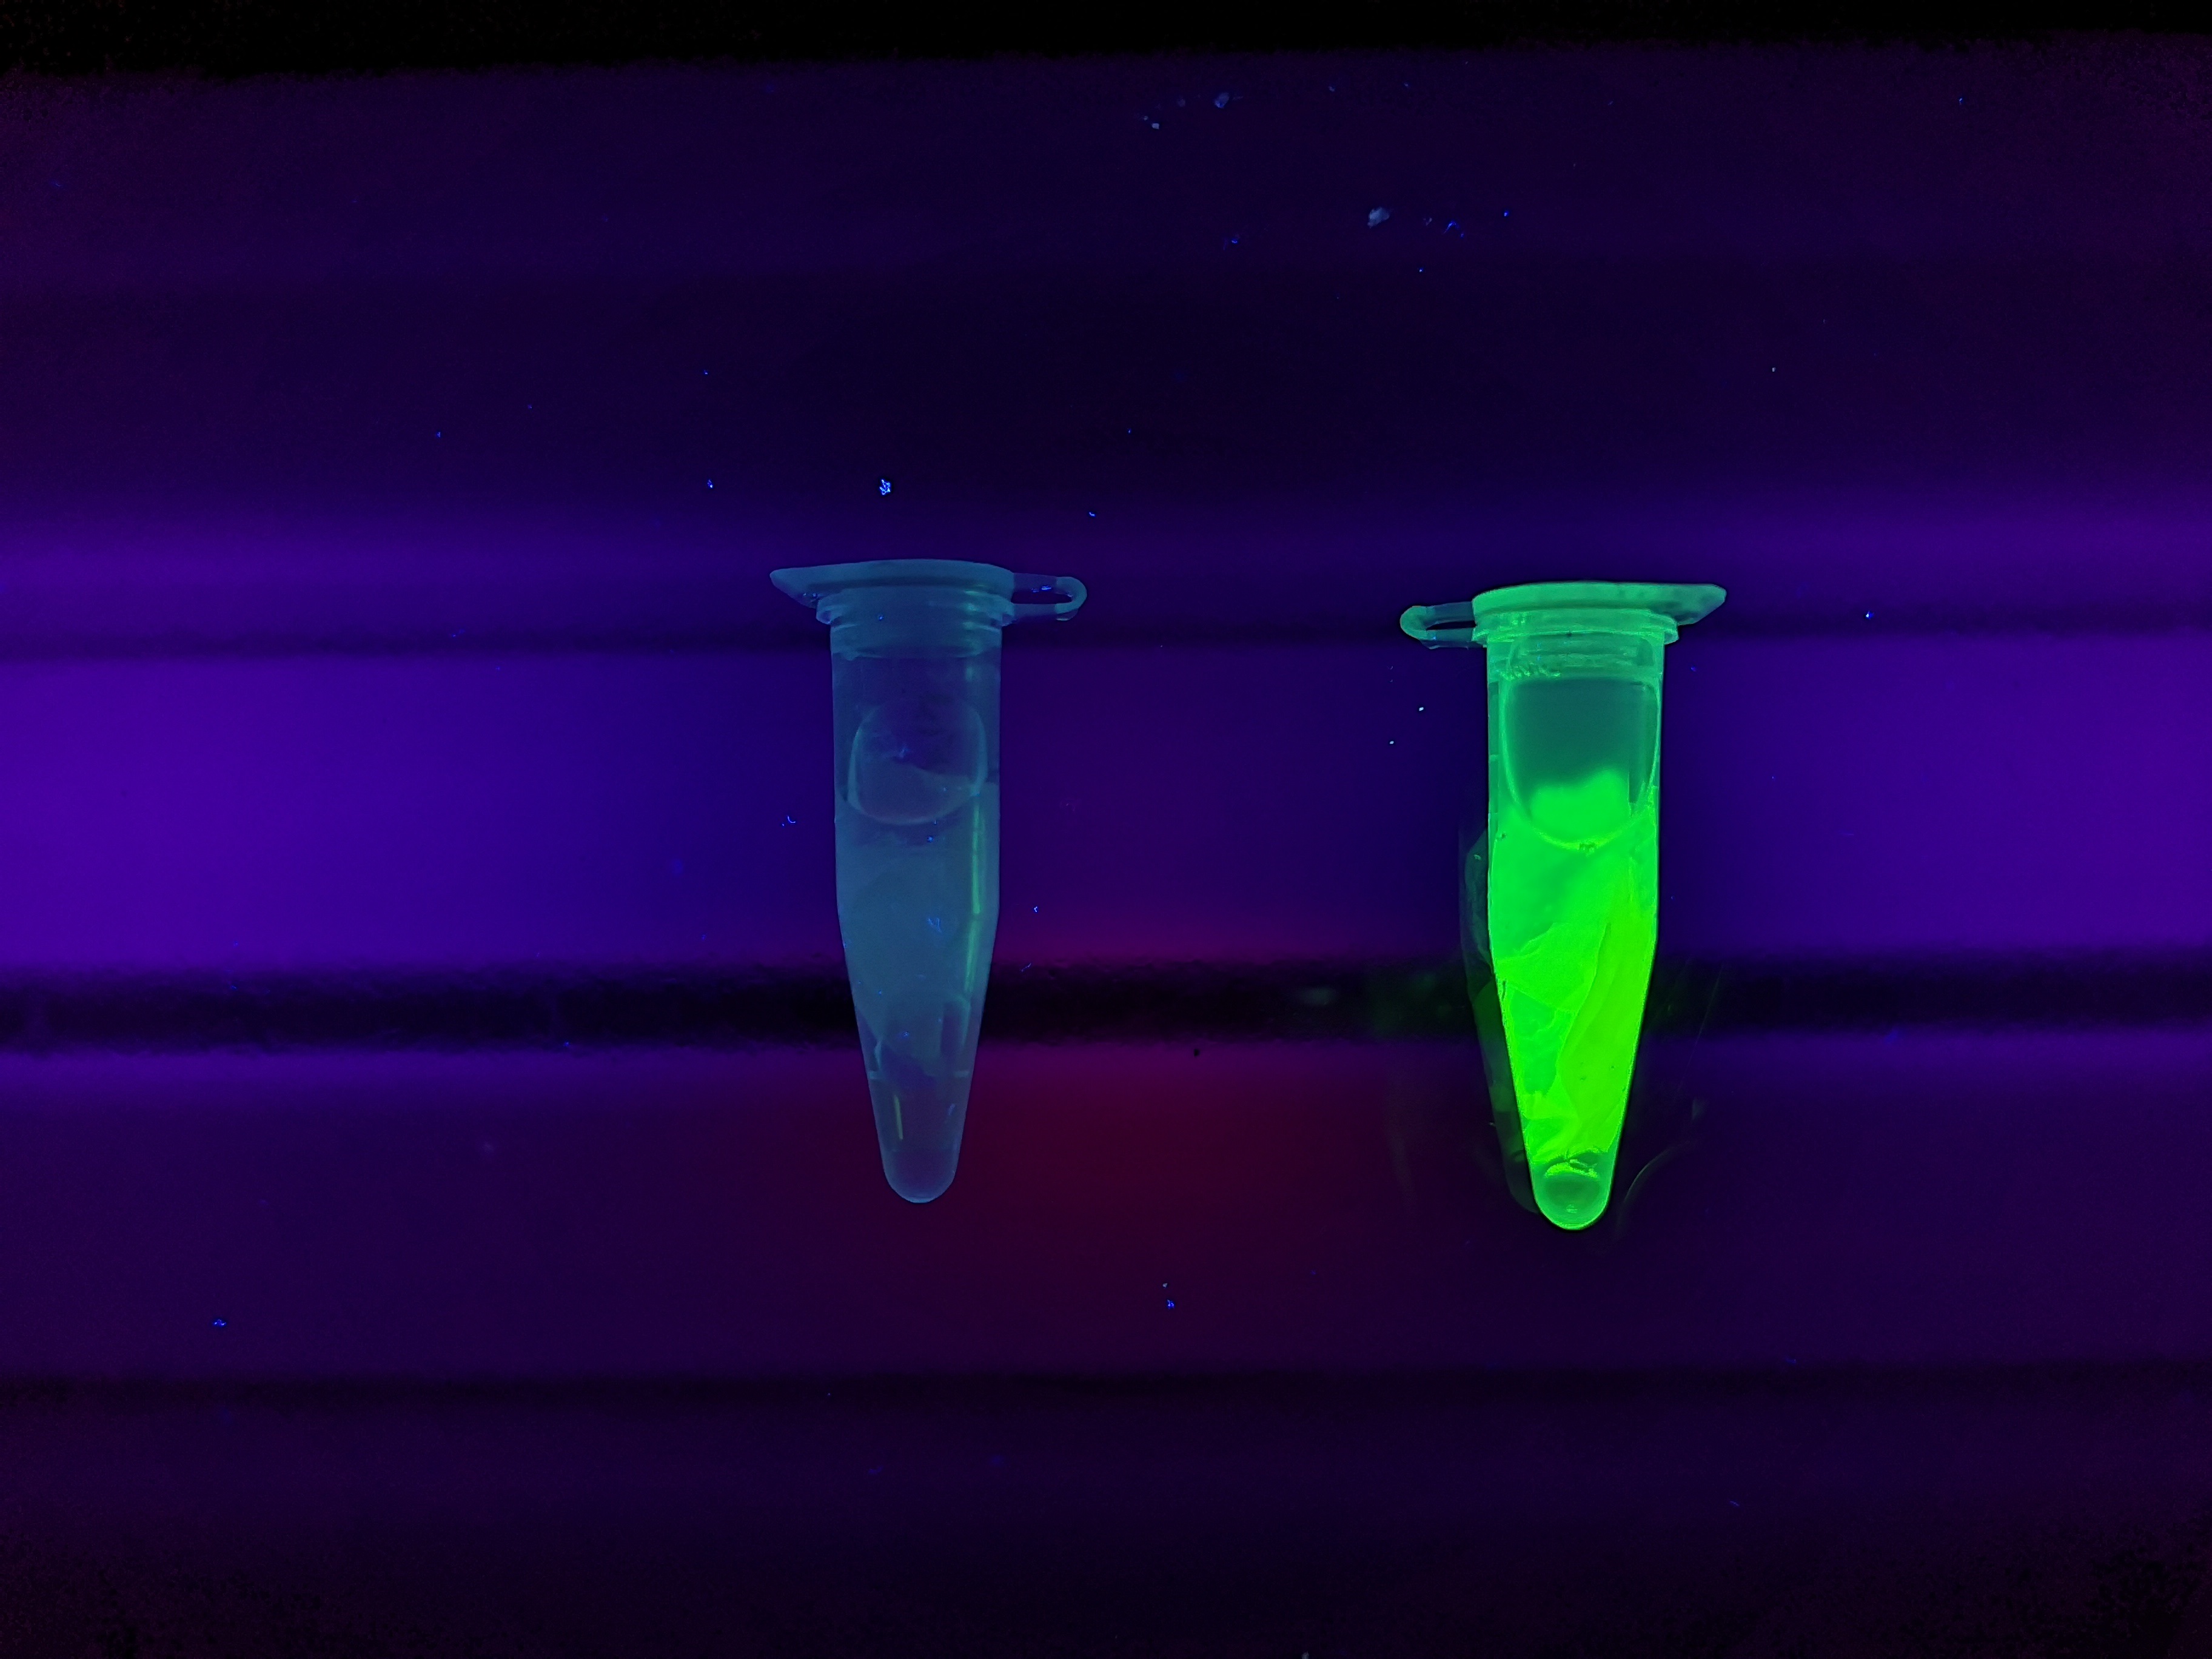
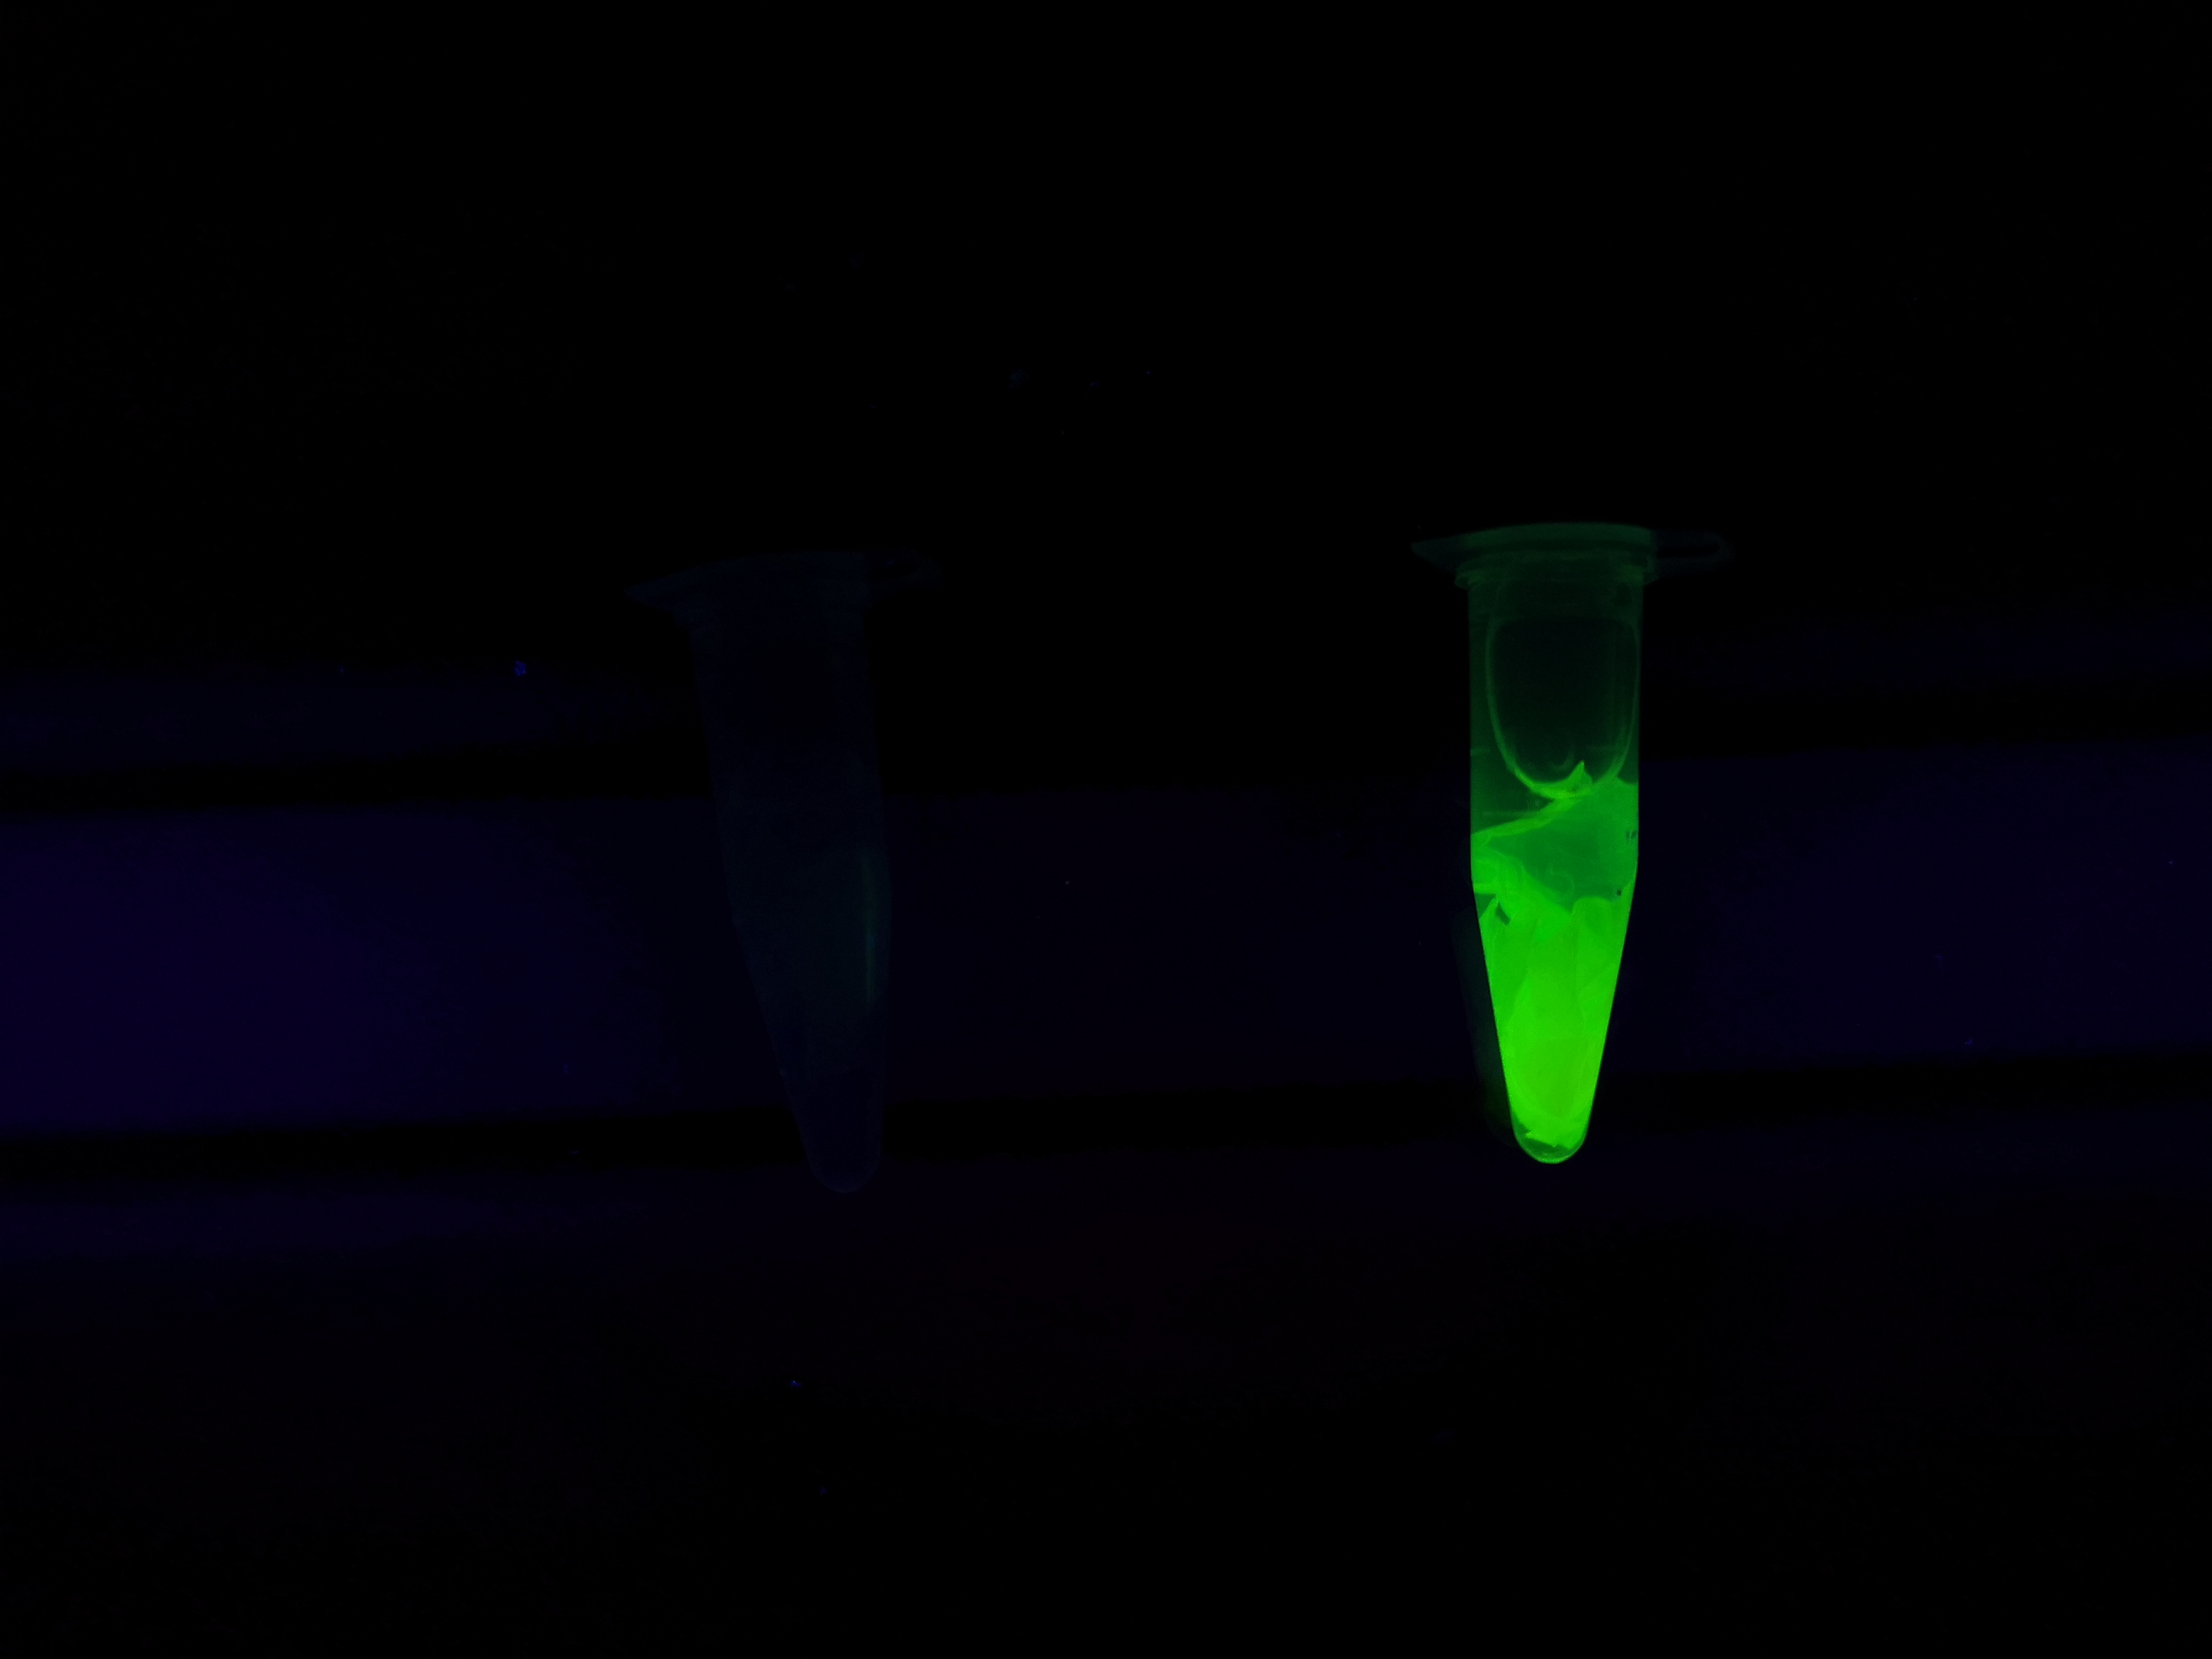
To the left a visual experiment with this part can be seen. After unbound protein had been removed the cellulose was washed three times with 70 % ethanol. To test the activity, 200 uL thrombin cleavage buffer (20 mM Tris-HCl, 150 mM NaCl and 2.5 mM CaCl2) were added along side 0.03 units of human thrombin to the bacterial cellulose. To the right in the figure, the successful cleavage of CBDcipA-sfGFP can be seen. The cellulose is to the left of the tube where free (cleaved at the thrombin site) sfGFP can be seen. To the left, the control sample can be seen, where no sfGFP can be seen in the supernatant. The picture is taken on a 302 nm UV-table to better visualize the results.
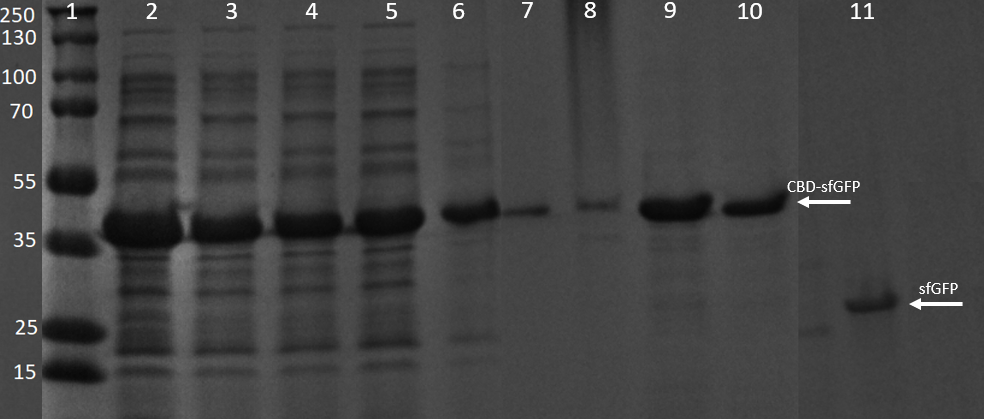
SDS-PAGE analysis of cleavage and expression
E. coli BL21 (DE3) cells were grown in prescence of 25 ug/mL chlorampenicol until an OD600 of 0.8 at 37 degrees Celsius, and later induced with 0.5 mM IPTG. The induced culture were then incubated in 16 degrees Celsius for 16 hours. The bacteria was then lysed with sonication at 30 % for 6 minutes. Most of this part could be found in the soluble fraction. The lysate (1 mL) was then incubated with cellulose (CF11) for 30 minutes in room temperature. Four washes with 70 % ethanol was then conducted all with a volume of 1 mL. Elution of CBDcipA-sfGFP was done with 1 mL fractions of dH2O. One replicate was instead cleaved with thrombin instead. Thrombin cleavage buffer (20 mM Tris-HCl, 150 mM NaCl and 2.5 mM CaCl2) was added to the Eppendorf tube with the cellulose at a volume of 500 uL, and 0.03 units was then added to the solution. The cleavage was done in room temperature over 16 hours, with inversion of the tube.


