Difference between revisions of "Part:BBa K1847002"
| Line 31: | Line 31: | ||
<h1>Data</h1> | <h1>Data</h1> | ||
[[File:ETH15_P63lldPR.png|thumb|Figure 2. Dose-response curves for the promoter BBa_K1847002]] | [[File:ETH15_P63lldPR.png|thumb|Figure 2. Dose-response curves for the promoter BBa_K1847002]] | ||
| − | In Figure 2 we can see that the lactate influences the promoter in a low fashion, with an ON/OFF ratio of about 1.2 | + | In Figure 2 we can see that the lactate influences the promoter in a low fashion, with an ON/OFF ratio of about 1.2. |
<!-- Uncomment this to enable Functional Parameter display | <!-- Uncomment this to enable Functional Parameter display | ||
Latest revision as of 15:51, 25 October 2015
J23100-lldRO1-lldRO2
Collection of promoters regulated by LldR. Check also: BBa_K1847008 BBa_K1847007 BBa_K1847009
Sequence and Features
- 10COMPATIBLE WITH RFC[10]
- 12INCOMPATIBLE WITH RFC[12]Illegal NheI site found at 7
Illegal NheI site found at 30 - 21COMPATIBLE WITH RFC[21]
- 23COMPATIBLE WITH RFC[23]
- 25COMPATIBLE WITH RFC[25]
- 1000COMPATIBLE WITH RFC[1000]
We are grateful to Stockholm iGEM 2015 for their help with the characterization!
Usage and Biology
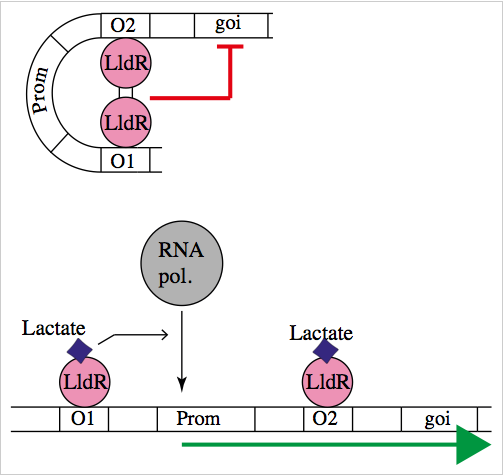
The natural promoter of LldR (Part:BBa_K822000) consists of two operators (O1 and O2) and a promoter which is intercalated between the operators. It regulates the expression of the lldPRD operon, and it is involved in L-lactate metabolism. This promoter is repressed by a dimer of LldR, possibly by forming a DNA loop that does not allow the RNA polymerase to bind to the promoter. LldR can also have a function as an activator [1]. The repression of the promoter can be removed by lactate.
Characterization of the promoter
We wanted to know how the promoter would respond to the lactate presence and how important is the architecture of the promoter in this response. For this regard, we built several promoters. Part:BBa_K1847002, Part:BBa_K1847003, Part:BBa_K1847004, Part:BBa_K1847005, Part:BBa_K1847006, Part:BBa_K1847007, Part:BBa_K1847008, and Part:BBa_K1847009.
Genetic design for characterization with LldR
To test our promoter we designed a plasmid containing the promoter with sfGFP in a medium copy plasmid pSEVA261 and transformed it into Escherichia coli TOP10. Then, we added a second plasmid containing lldR with a medium strong promoter (Part:BBa_J23118) and a strong RBS (Part:BBa_B0034) in pSEVA371 backbone. According to literature [1], LldR will repress the promoter and by the addition of lactate the production of GFP will start, as the repressor will be removed.
Genetic design for characterization with LldP-LldP
The second step for our characterization was to add an L-lactate permease (LldP), which despite its name is an active transporter of L-lactate, D-lactate and glycolate. To understand the effect of LldP (L-lactatep permease) in our system, we tried the following conditions:
- Plasmid with the promoter and sfGFP in medium copy number plasmid+ J23114-B0032-lldP-lldR (LldP and LldR are under the control of the same low promoter) in low copy number plasmid
- Plasmid with the promoter and sfGFP in medium copy number plasmid + J23118-B0034-lldP-lldR (LldP and LldR are under the control of the same medium promoter) in low copy number plasmid
Plate reader
E. coli TOP10 strains were grown overnight in Lysogeny Broth (LB) containing kanamycin (50 µg/mL) and chloramphenicol (12.5 µg/mL) at 37°C and 200 rpm. Cultures were diluted 1:50 in fresh LB with the corresponding antibiotic and transferred to a 96-well plate (200 µL/well). Cultures were grown for 90 min to arrive to exponential phase and then different concentrations of lactate were added. Samples were always made in triplicates and a blank of LB with the corresponding lactate concentration was done. During 7 h the absorbance at OD600 and fluorescence (excitation 488 nm and emission 530 nm) were measured with intervals of 7 min. The plate was always kept at 37°C in a plate reader. We calculated dose-response curves from the exponential phase of the bacteria using normalized fluorescence corrected by optical density.
Data
In Figure 2 we can see that the lactate influences the promoter in a low fashion, with an ON/OFF ratio of about 1.2.


