Difference between revisions of "Part:BBa K3848004"
(→Modeling:-) |
(→Modeling:-) |
||
| Line 60: | Line 60: | ||
<img src="https://2021.igem.org/wiki/images/7/78/T--IISER_Bhopal--kill_switch_modeling_graph.png" style="width:100%"> | <img src="https://2021.igem.org/wiki/images/7/78/T--IISER_Bhopal--kill_switch_modeling_graph.png" style="width:100%"> | ||
<br> | <br> | ||
| − | <p style="text-align:center;">Figure 5: Modeling depicting the levels of | + | <p style="text-align:center;">Figure 5: Modeling depicting the levels of holin, antiholin and cI repressor, thus effectively the cell fate after removal of lactate in the environment.</p></body> |
</html> | </html> | ||
Revision as of 17:18, 20 October 2021
Lactate regulated kill switch
- 10COMPATIBLE WITH RFC[10]
- 12INCOMPATIBLE WITH RFC[12]Illegal NheI site found at 78
Illegal NheI site found at 101 - 21COMPATIBLE WITH RFC[21]
- 23COMPATIBLE WITH RFC[23]
- 25INCOMPATIBLE WITH RFC[25]Illegal AgeI site found at 2457
Illegal AgeI site found at 2527 - 1000INCOMPATIBLE WITH RFC[1000]Illegal SapI site found at 391
Gene cassettes:-
Our kill switch is divided into 2 cassettes: antiholin-cI repressor cassette and holin-endolysin cassette. Here cassette refers to polycistronic operons so that the genes encoded in the operons are expressed in a coordinated fashion. The antiholin-cI repressor cassette is under the control of a lactate promoter (a constitutive promoter flanked by lacO operator sites for lldR product binding). This gives us control of lactate which is at a higher concentration in tumor microenvironments[5], hence we express these “life-saving” proteins for the bacterium only when it will be present in the tumor microenvironment. The other cassette is the holin-endolysin cassette, which is responsible for the production of killer proteins against the bacterium. This cassette is under the control of cI promoter. This promoter is negatively regulated by cI repressor.
Mechanism:-
Our kill switch consists of a holin-antiholin toxin-antitoxin system. The holin protein creates holes in the bacterial cell membrane, which allows endolysin protein to pass through and degrade the cell wall, killing the cell. The antiholin protein binds to the holin protein, inactivating it. When both proteins are expressed, whether the cell dies depends on the relative concentrations of both the holin and antiholin components[6]. In addition, we have placed other regulatory elements to increase the stringency of the kill switch. For instance, we have expressed antiholin and cI repressor in a single operon under a promoter that allows expression in the environment found in tumors (lac operon), which ensures that during culturing there are enough kill switch delaying proteins so as to allow the bacteria enough time to colonize the tumor microenvironment. The cI repressor is degradation tagged, so its level will only be sustainable in the tumor microenvironmental conditions. If these conditions are not provided, the repressor is degraded, and holin and endolysin expression kickstarts. The holin that is initially made is neutralized by the already present antiholin. Meanwhile endolysin is building up in the cytosol. Once the holin overwhelms antiholin, holin starts to form holes in the membrane and the endolysin already present in the cytosol lyses the cell wall, effectively killing the cell. This model ensures that our kill switch actually works in a switch-like manner with greater stringency instead of a sigmoidal curve.
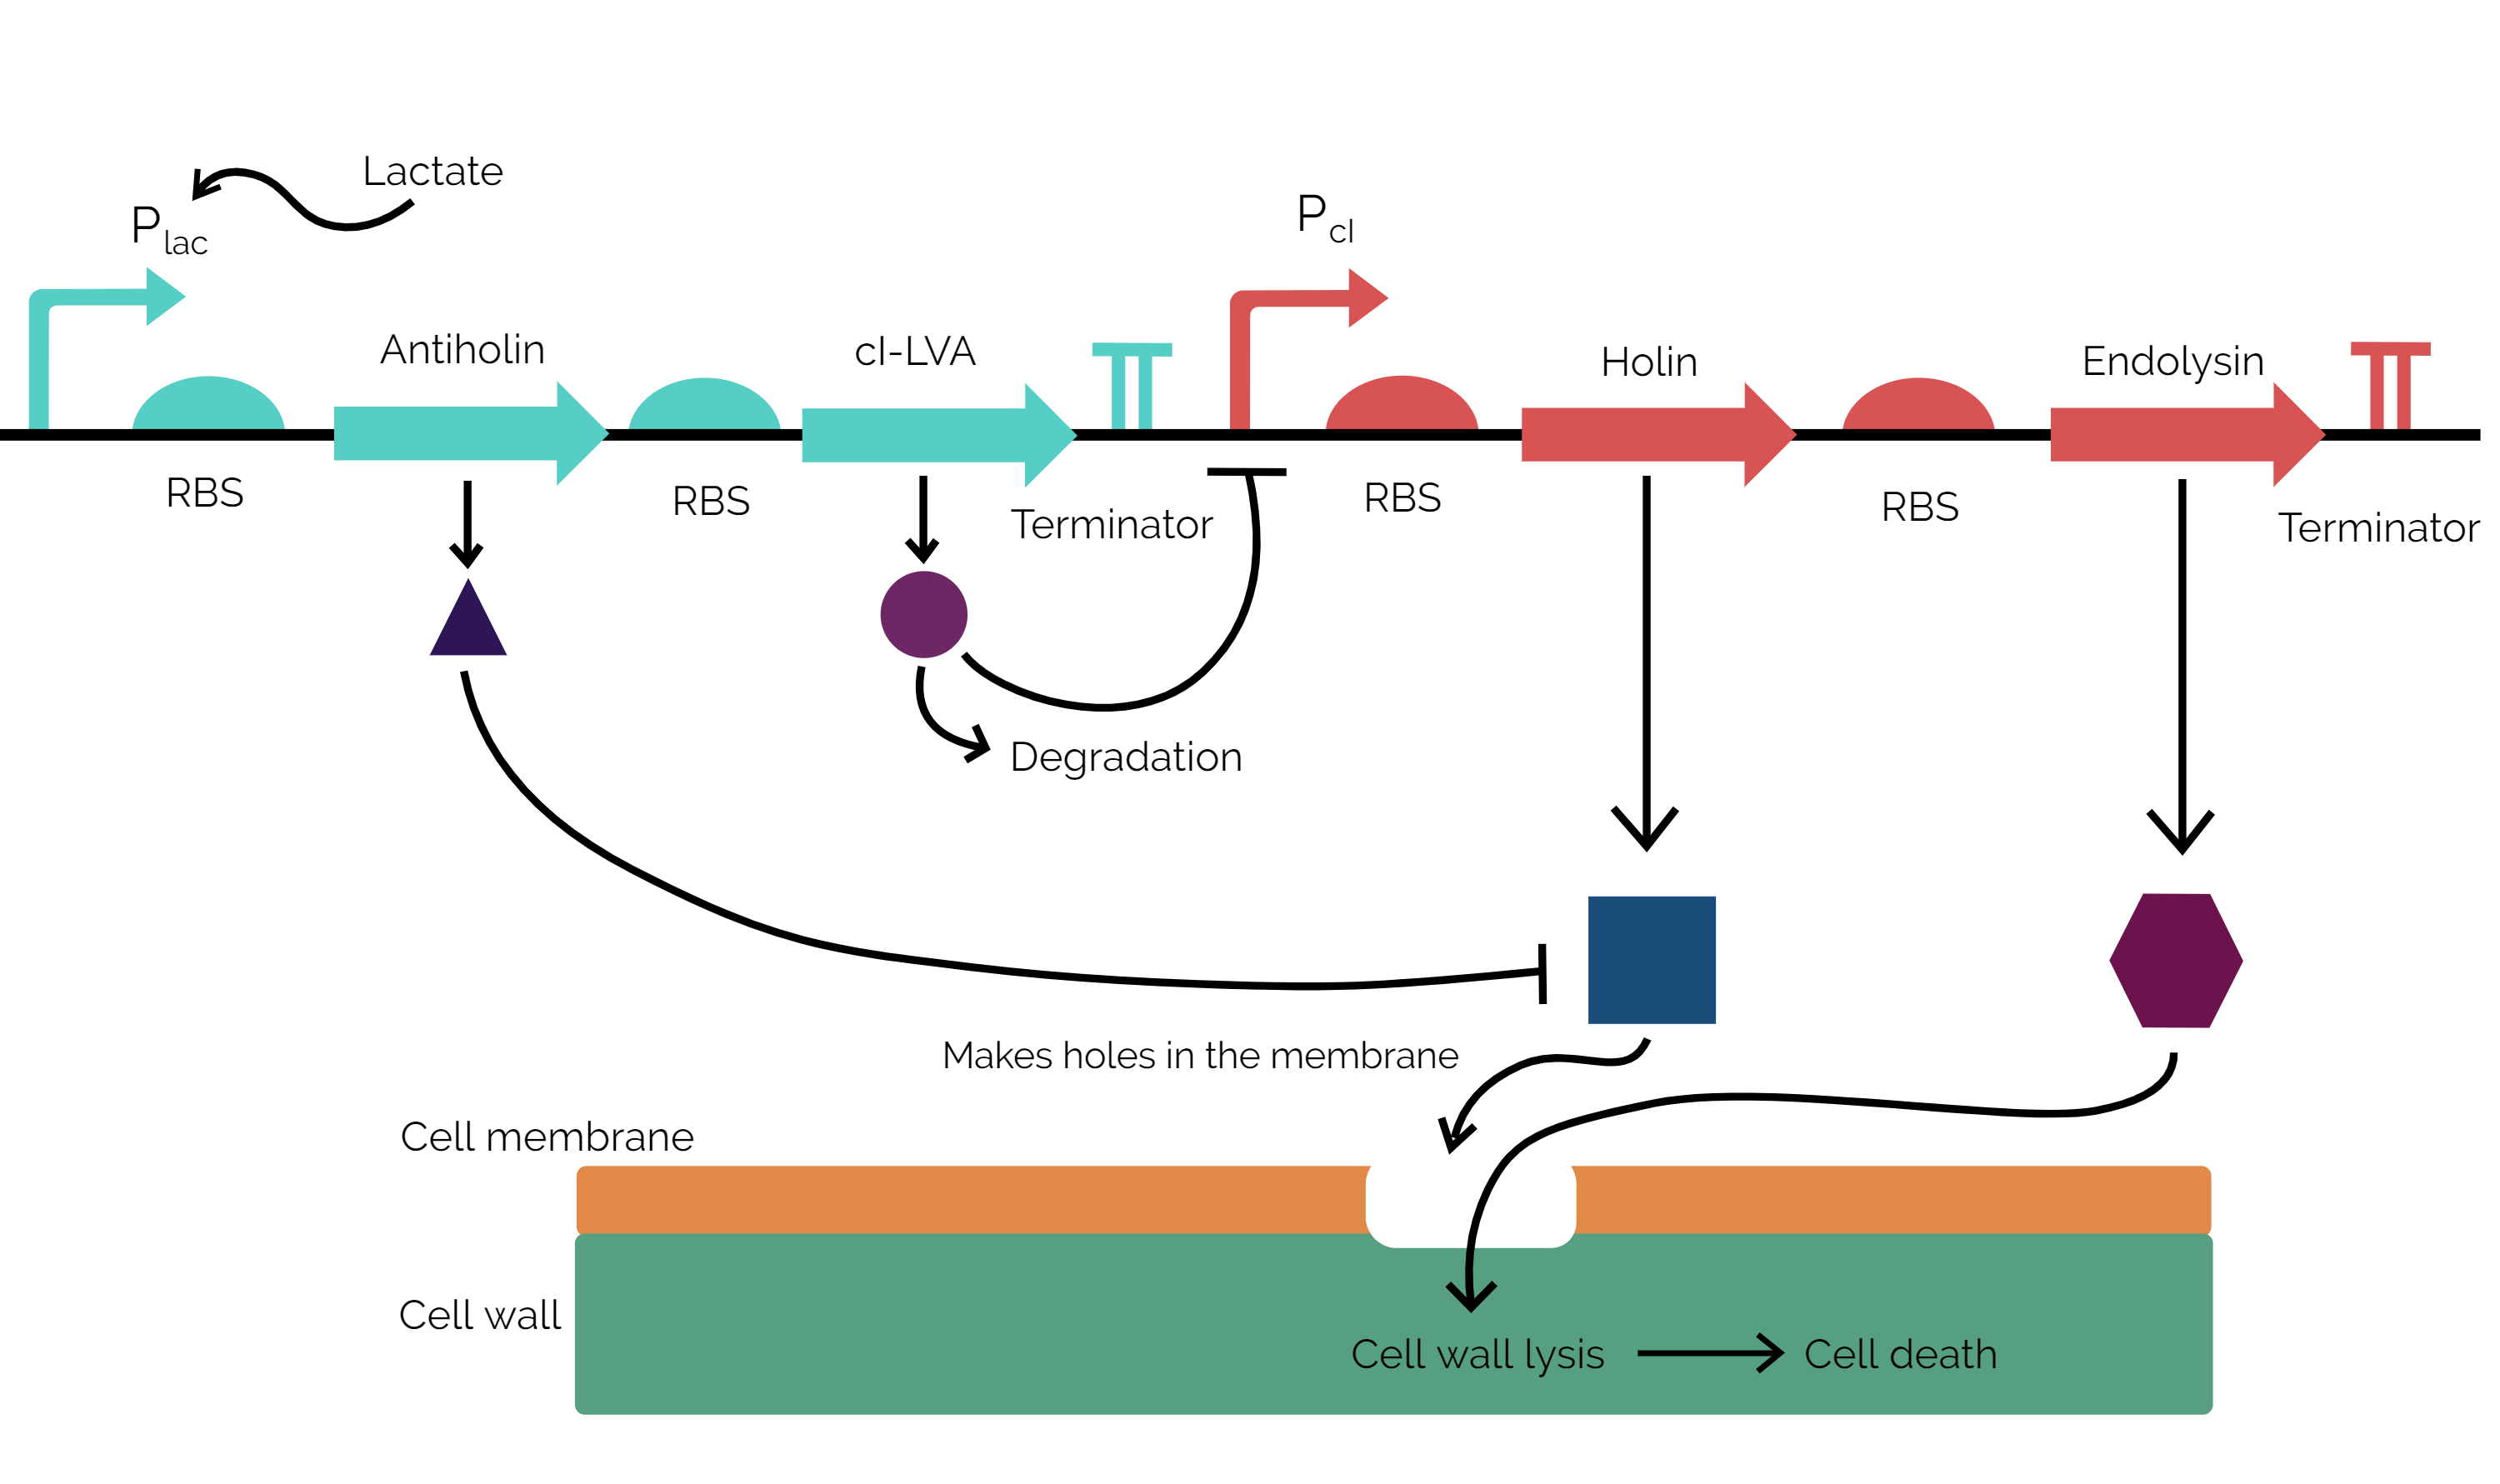
Figure 1: Mechanism of action of the kill switch.
Results:-
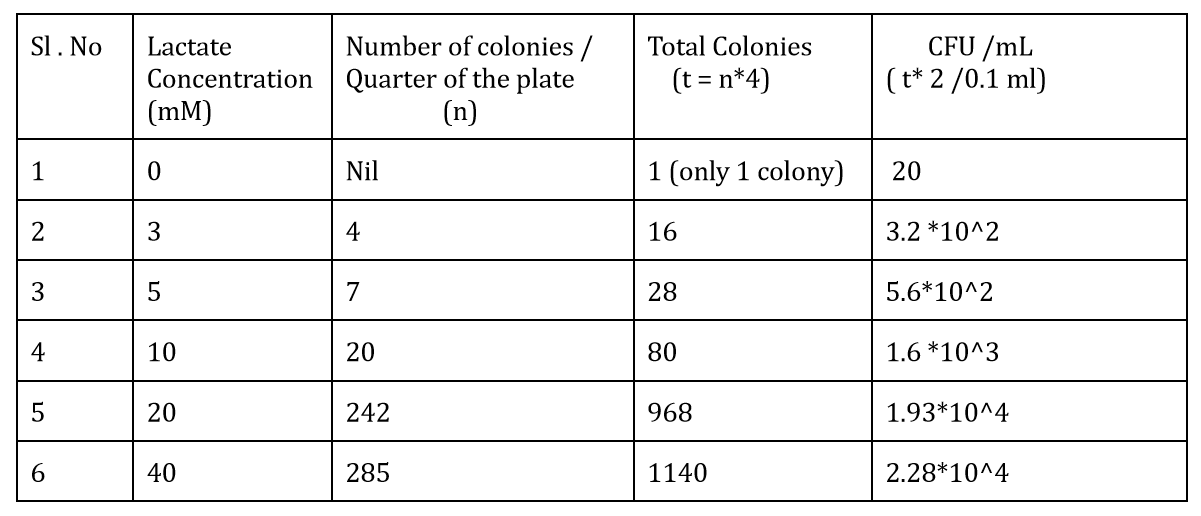
We performed OD measurements and CFU calculations to check the stringency of the kill switch under different lactate concentrations. The plates of kill-switch cassette transformed bacteria at different concentrations of lactate are:-
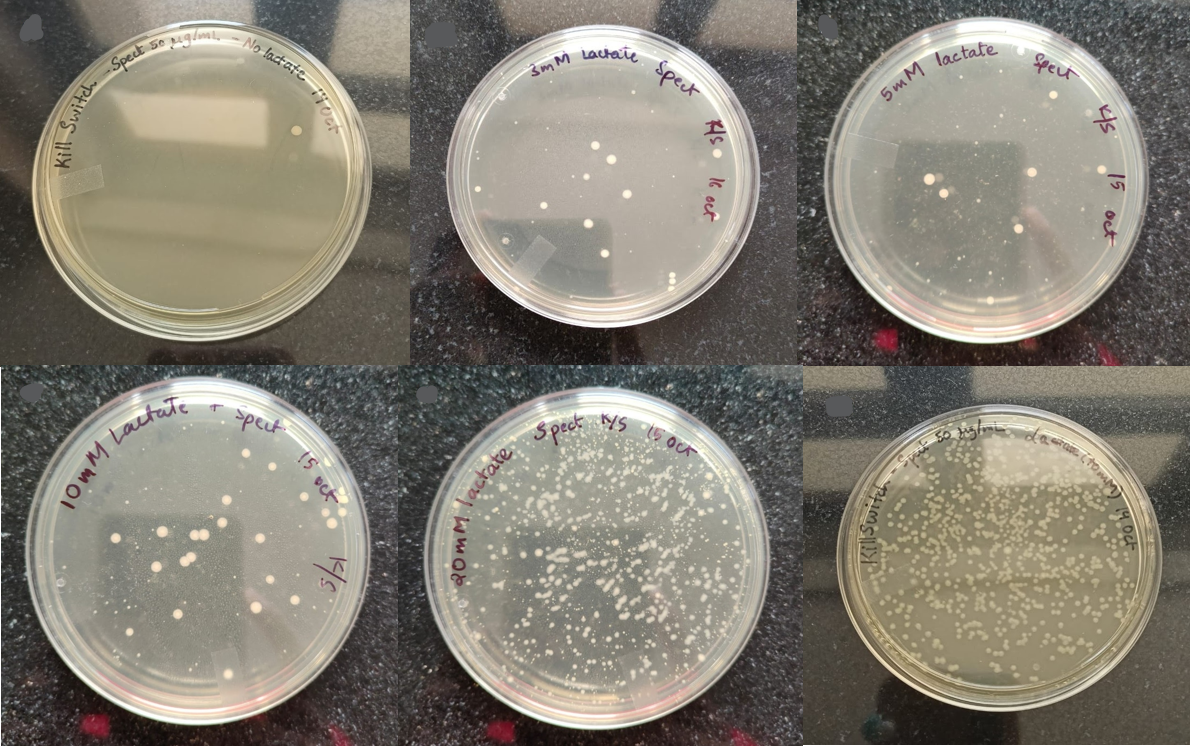
Figure 2: The colonies of kill switch cassette transformed bacteria at different concentrations of lactate (from L to R): 0 mM, 3 mM, 5 mM, 10 mM, 20 mM, 40 mM."
The CFU measurements at different lactate concentrations is:-
We also measured the OD at different lactate concentrations to check the change in the growth rate of bacteria. The graph depicting it is:-
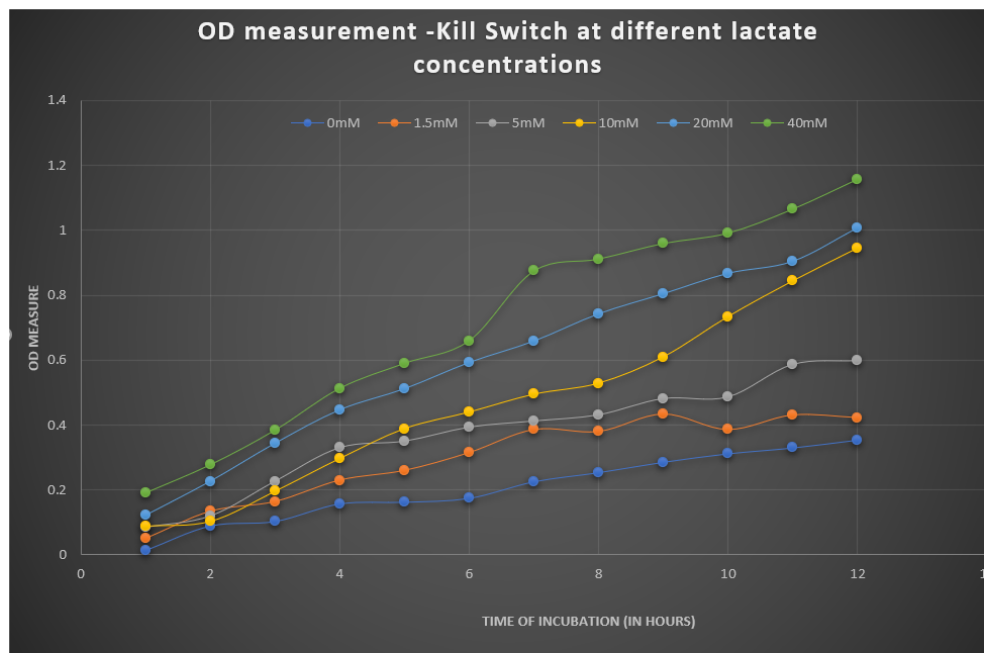
Figure 4: OD vs Time graph showing growth curves of bacteria under different concentrations of lactate."
Modeling:-
We also performed modeling of the kill switch to check for how much time the bacteria can survive without lactate after culturing in lactate rich conditions.
The modeling of the levels of holin, cI repressor and antiholin after removal of lactate from the environment is represented in the graph below:-
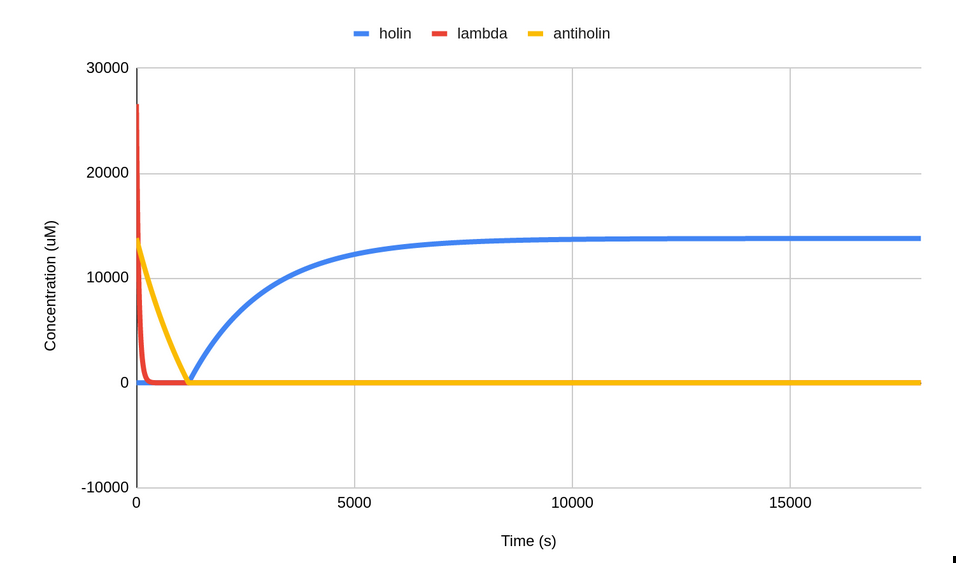
Figure 5: Modeling depicting the levels of holin, antiholin and cI repressor, thus effectively the cell fate after removal of lactate in the environment.
Thus, the time for which the bacteria can survive without lactate is approximately 20 minutes, which is enough for it to localize to the tumor microenvironment. The data used to generate this graph is given below:-
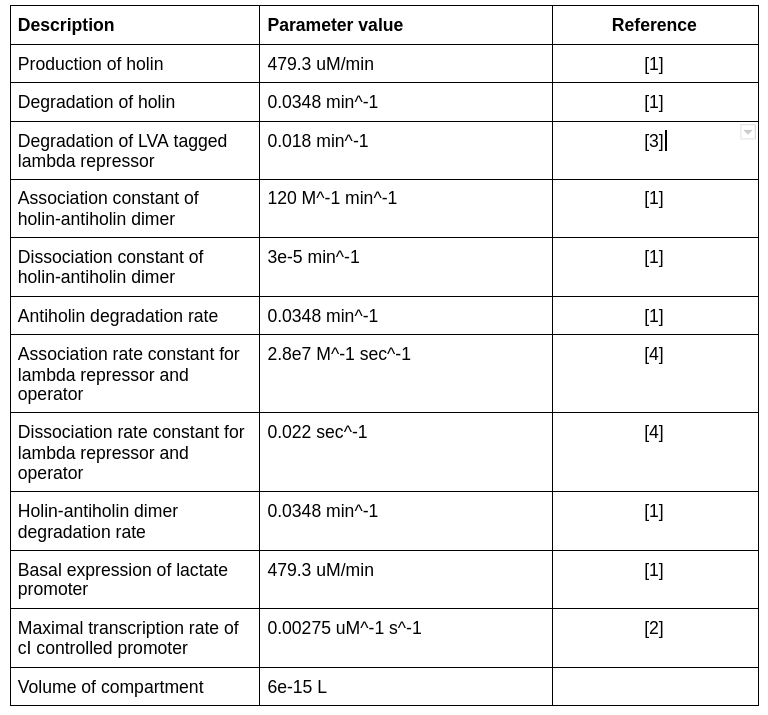
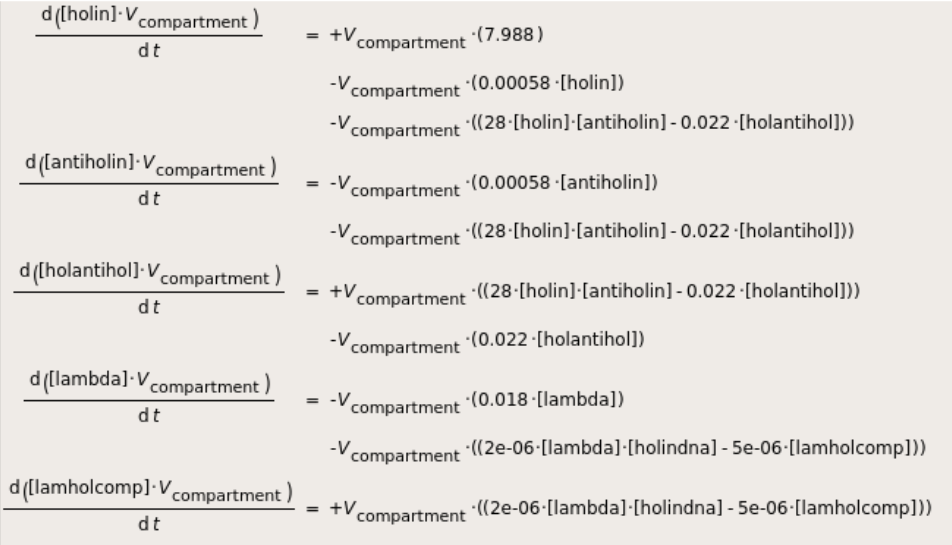
The pathways and parameters involved in the working of the kill switch were input into COPASI (http://copasi.org/) to obtain the following differential equations:-
Please visit our teams, kill switch results or our modeling page wiki for more information.
References
[1] https://parts.igem.org/Part:BBa_K3419005
[2] https://2020.igem.org/Team:IISER_Bhopal/Model_killSwitch
[3] https://parts.igem.org/Part:BBa_K1399001
[4] Nelson HC, Sauer RT. Lambda repressor mutations that increase the affinity and specificity of operator binding. Cell. 1985 Sep;42(2):549-58. doi: 10.1016/0092-8674(85)90112-6. PMID: 3161621.
[5] de la Cruz-López, Karen G et al. “Lactate in the Regulation of Tumor Microenvironment and Therapeutic Approaches.” Frontiers in oncology vol. 9 1143. 1 Nov. 2019, doi:10.3389/fonc.2019.01143
[6] Savva, Christos G et al. “The holin of bacteriophage lambda forms rings with large diameter.” Molecular microbiology vol. 69,4 (2008): 784-793. doi:10.1111/j.1365-2958.2008.06298.x
