Difference between revisions of "Part:BBa I746909"
| Line 109: | Line 109: | ||
<!-- Below contains the characterization added to this part by Exeter 2019 --> | <!-- Below contains the characterization added to this part by Exeter 2019 --> | ||
| − | <h2> | + | <h2 style="display: inline-block"> |
| − | <span class="mw-headline" | + | <span class="mw-headline" id="Expression in E.coli">University of Exeter 2019's Characterisation</span> |
</h2> | </h2> | ||
<html> | <html> | ||
Revision as of 22:15, 19 October 2019
superfolder GFP driven by T7 promoter
This is one of the constructs used to characterise superfolder GFP (see I746916 part description and http://openwetware.org/wiki/IGEM:Cambridge/2008/Improved_GFP for source and other information about this GFP variant)
iGEM TUDelft 2019
2019 iGEM TUDelftcharacterized this part in PUREfrex.Overview
We have added characterization to https://parts.igem.org/Part:BBa_I746909 by performing an assay of the plasmid in the PUREfrex® cell-free expression system. This experiment allows for RNA levels to also be detected in tandem with protein levels, all in a predetermined T7 RNAP concentration, allowing for a more detailed understanding of the kinetic behavior (i.e. transcription and translation) of the construct. We believe the use of the PURE system in measurements like this contribute to the development of the iGEM cell-free chassis and to obtain better parameterization of the kinetics of genetic constructs like this one.
Method
The following PUREfrex® system solutions were used:
- Solution 1: Aminoacids, NTPs, tRNAs, and enzymatic substrates.
- Solution 2: Proteins involved in T7 RNAP based transcription, in 30% glycerol.
- Solution 3: 20 μM ribosomes, allowing for the translation of proteins.
- Blank: Solution A + SYBR Green.
- DNA background: Solution A + Plasmid DNA + SYBR Green
- RNA measurement: Solution A + Plasmid DNA + Solution B + SYBR Green.
- Protein measurement: Solution A + Plasmid DNA + Solution B + Solution C.
Results
Final RNA level: 267.7 +- 2.75 ng.
The following graphs were generated and a logistic growth curve was fitted to the data.

Figure 1: GFP fluorescence timecourse in Pure system.

Figure 2: RNA SYBR green fluorescence timecourse in Pure system.
Characterization: PR4 vs. T7
Group: Queens_Canada, 2019
Author: Ruben Warkentin
Summary: We compared the amount of GFP expressed under a constitutive promoter (medium promoter, strong RBS) to T7 expression. Some proteins fold better under constitutive promoters; however, nobody had yet directly compared the amount of protein produced between constitutive vs. T7 expression.
Methods
BioBricks were transformed and expressed in E. coli (BL21). BL21 cells were cultured to an OD600=0.6 and 100 uL of culture was transferred into a 96 well plate. Colonies were transfered in quadruplicate. The fluorescence intensity of GFP was measured with a multi-mode microplate reader. The iGEM standardized fluorescence protocol was used for fluorescence measurement standardization (https://www.protocols.io/view/calibration-protocol-plate-reader-fluorescence-cal-6zrhf56).
Results
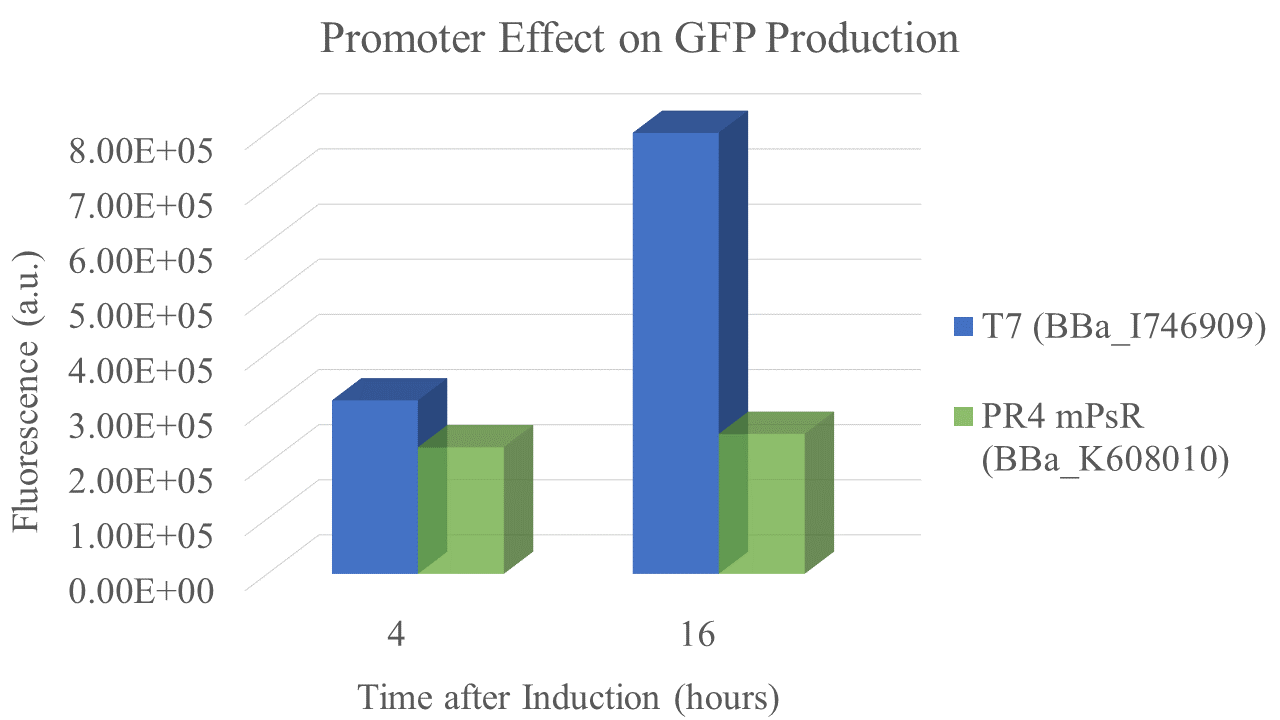
We found that the T7 promoter produced about 2.6 times as much fluorescent signal as the constitutive PR4 promoter, indicating that T7 is much more efficient at producing GFP (Fig. 5). Interestingly, the production of GFP under PR4 did not increase beyond the level observed at 4 hours after inoculation. It seems that PR4 leads to an initial production of protein; however, after the initial expression the promoter seems to be shut off.
Promoter and RBS:
PR4: medium Promoter (J23110) strong RBS (B0034)
T7: T7 Promoter (BBa_I746909)
| sample | PR4 | T7 |
| Fluorescence 4 hrs (a.u.) | 2.24E+05 | 3.09E+05 |
| Fluorescence 16 hrs (a.u.) | 2.48E+05 | 8.00E+05 |
University of Exeter 2019's Characterisation
Experimental Data Collection
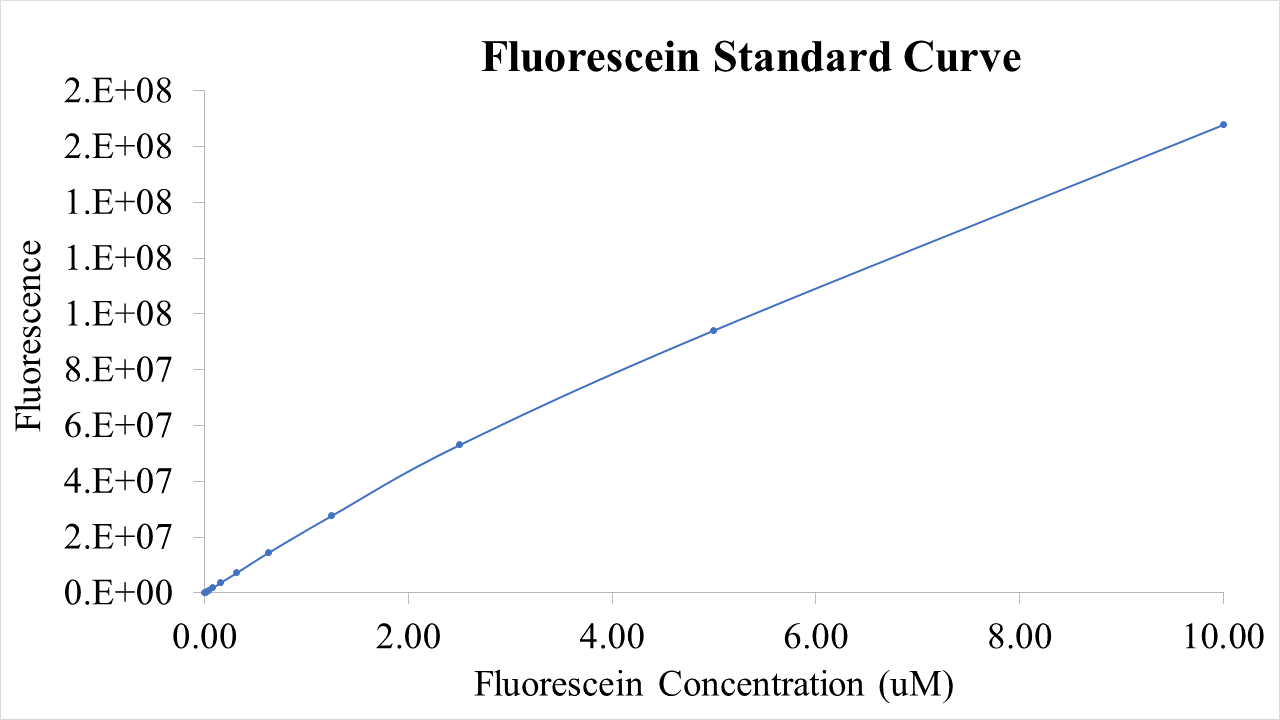
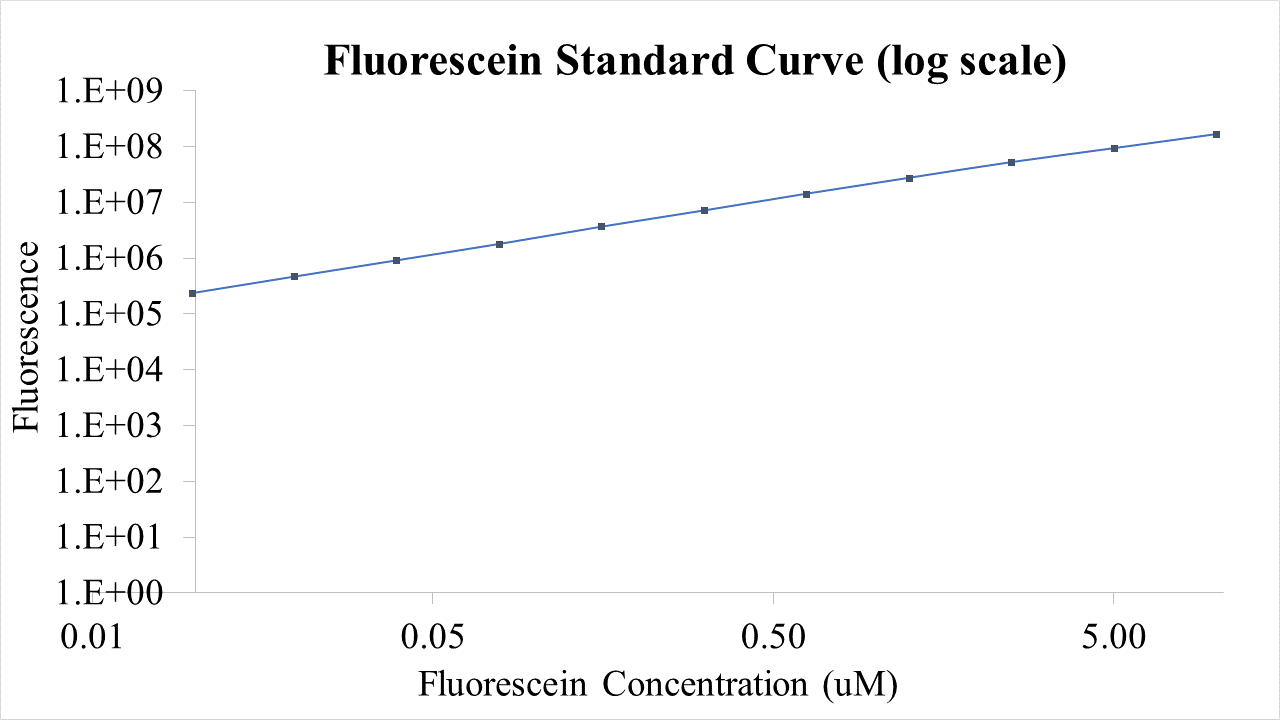
Plasmid pSB1C3-BBa_I746909 was extracted from the distribution kit and initially transformed into E. coli DH5α, for amplification, before transformation into E. coli BL21 and E. coli BL21(DE3). For transformation into E. coli BL21(DE3)pLysS, which is resistant to chloramphenicol, BBa_I746909 had to be cloned into an ampicillin resistant plasmid (pX1800) using restriction enzymes EcoRI and PstI (see protocols page). Cultures of E. coli carrying either pSB1C3-BBa_I746909 or pX1800-BBa_I746909 were grown in LB media with either 35μg/ml chloramphenicol or 100 μg/ml ampicillin as appropriate, in 96 well plates (200μl) at 37°C, 800 rpm. Cell growth was monitored by Optical Density (OD) at 600 nm (Tecan Infinite Plate reader) and calibrated using Cospheric monodisperse silica microspheres of a comparable size to E. coli (0.961 μm) (see Figure 1 below). Expression of sGFP was induced with 200μM of IPTG at an OD of 0.4. Protein expression was monitored by fluorescence (488 nm excitation, 520 nm emission) and calibrated using fluorescein isothiocyanate (see figure 2 below). After 24 h growth sGFP expression in individual cells was monitored by fluorescence using a BD FACS AriaIII Flow Cytometer (excitation laser (blue) 488 nm, emission 530/30 nm). Molecules of equivalent soluble fluorophore was calculated from a standard curve generated by running Takara Clontech AcGFP Calibration Beads with the same settings (see Figure 3 below). In addition, cell morphology was investigated using an Image Stream Mark II (Amnis-Luminex Corp.) Imaging Flow Cytometer configured with Bright Field (white light), Side-Scatter (785 nm) and GFP (excitation laser 488 nm, emission 533/55 nm).
- 10COMPATIBLE WITH RFC[10]
- 12COMPATIBLE WITH RFC[12]
- 21COMPATIBLE WITH RFC[21]
- 23COMPATIBLE WITH RFC[23]
- 25COMPATIBLE WITH RFC[25]
- 1000INCOMPATIBLE WITH RFC[1000]Illegal SapI.rc site found at 62


