Difference between revisions of "Part:BBa K325909"
| Line 51: | Line 51: | ||
https://static.igem.org/mediawiki/2018/thumb/9/9b/T--SHSID_China--imp1.png/800px-T--SHSID_China--imp1.png | https://static.igem.org/mediawiki/2018/thumb/9/9b/T--SHSID_China--imp1.png/800px-T--SHSID_China--imp1.png | ||
<p>The data is analyzed using the formula: (Average Luminescence/0Hrs Luminescence)/(Average Abs/0Hrs Abs) for each concentration of arabinose, and the graphs are plotted below, with part BBa_K325909 abbreviated as 4L:</p> | <p>The data is analyzed using the formula: (Average Luminescence/0Hrs Luminescence)/(Average Abs/0Hrs Abs) for each concentration of arabinose, and the graphs are plotted below, with part BBa_K325909 abbreviated as 4L:</p> | ||
| − | https://static.igem.org/mediawiki/2018/thumb/3/33/T--SHSID_China--imp2.png/ | + | https://static.igem.org/mediawiki/2018/thumb/3/33/T--SHSID_China--imp2.png/320px-T--SHSID_China--imp2.png |
<p>From the graph, even though the relative luminescence of the bacteria are similar during the first four hours, there is a significant increase in relative luminescence during the fifth hour at a concentration of 0.1M, therefore we have concluded that inducing part BBa_K325909 with 0.1M arabinose will result in the most intense light emission.</p> | <p>From the graph, even though the relative luminescence of the bacteria are similar during the first four hours, there is a significant increase in relative luminescence during the fifth hour at a concentration of 0.1M, therefore we have concluded that inducing part BBa_K325909 with 0.1M arabinose will result in the most intense light emission.</p> | ||
Revision as of 21:44, 17 October 2018
Lux Operon (under pBAD)
Vibrio Fischeri
|
|

|
Description
This page described the lux operon from Vibrio fischeri. To relieve LuxR control we placed Lux C, D, A, B, E under the pBad promoter. A more complete description can be found on the [http://2010.igem.org/Team:Cambridge/Bioluminescence/G28 Cambridge iGEM 2010 website].
This Bacterial lux operons encodes five enzymes involved in the light-generating pathway. LuxA and LuxB encode the two subunits of the bacterial luciferase, while the products of LuxC, LuxD and LuxE synthesise the substrate for the light emitting reaction, tetradecanal. The exact function of LuxG is unknown, and it appears to be non-essential for light emission, but its presence increases light output.
In nature, the lux genes appear to be repressed by the nucleoid protein, H-NS, and occur under quorum sensing control. We removed the natural quorum sensing control to facilitate use of the part in biosensors under different regulatory inputs.
As of October 2010 we believe this is the first and only BioBrick to emit light in normal E. coli strains without the addition of any external substrate.
Measured by the [http://2010.igem.org/Team:Cambridge Cambridge iGEM team 2010]
Compatibility
Chassis: Device has been shown to work in Top 10 (Invitrogen), [http://www.ecoliwiki.net/colipedia/index.php/BW25113 BW25113 DELTA H-NS::kan] and H-NS mutant JM 230 H-NS -205::tn10.br>
Plasmids: Device has been shown to work on pSB1C3
Additional characterisation by the [http://2015.igem.org/Team:Penn Penn iGEM team 2015]
Penn iGEM 2015 used this part to make the sender cells in light-mediated cell communication. The lux operon BioBrick on PSB1C3 was transformed into NEB 10-beta competent cells (since it is a commonly used E. coli strain in iGEM) and an H-NS mutant E. coli strain (since the protein has been shown to reduce lux gene expression). The luminescent signal of the two sender strains was compared over time to determine what luminescent output trend would be best for inducing our light-sensitive receiver. Furthermore, using a calibrated conversion system designed by the team, Penn IGEM was about to convert the output from relative lights units (a measure typically used to calculate bioluminescent signals) to an absolute measure in uW/cm^2. Using the absolute units will assist in making the characterization of bioluminescent parts such as BBa_K325909 more consistent across luminometer devices and across projects. For more information, please follow this [http://2015.igem.org/Team:Penn/Sender link].
Additional characterisation by the [http://2017.igem.org/Team:NTNU_Trondheim NTNU Trondheim iGEM team 2017]
Team NTNU Trondheim 2017 has improved the characterisation of the biobrick BBa_K325909, which is an operon consisting of Lux C, D, A, B, E under the arabinose-induced promoter pBAD.
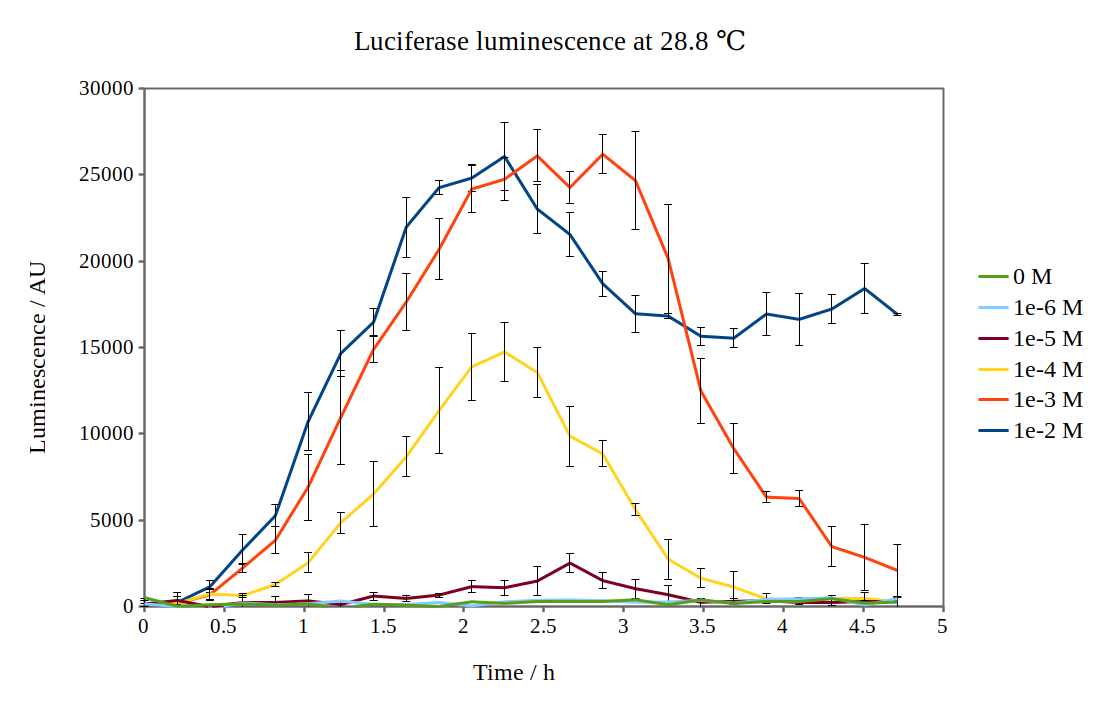
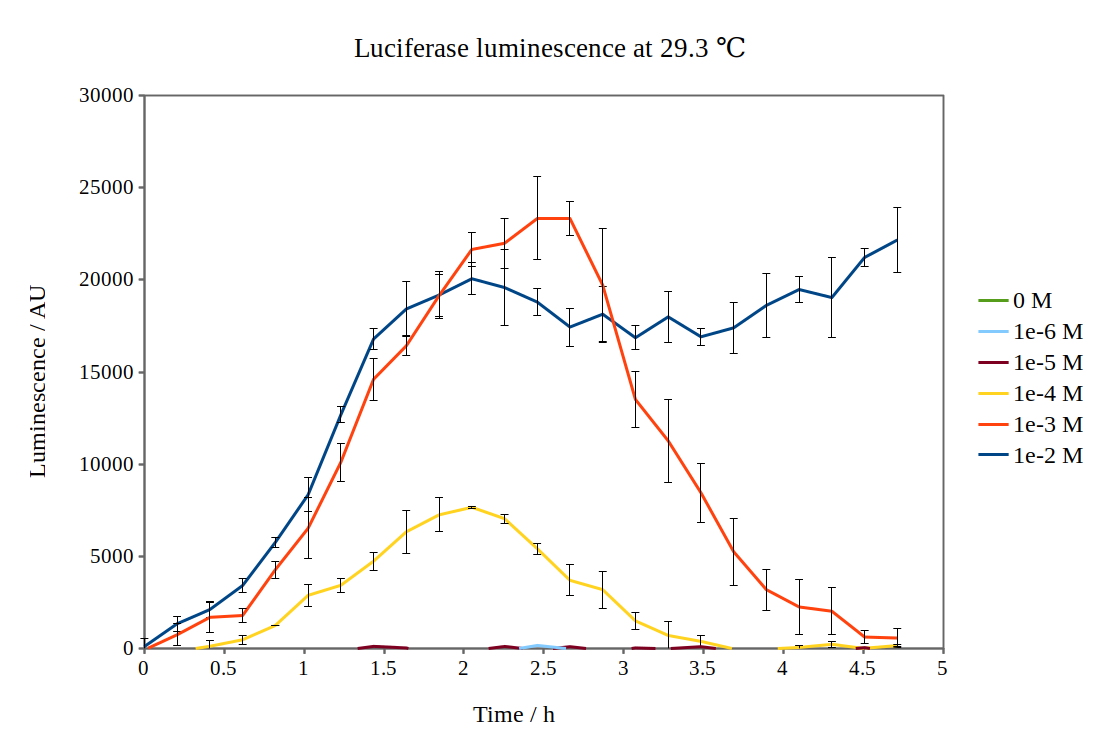
By looking at previous characterisation results of the biobrick, we thought it would work reasonably to use DH5α competent E. coli cells and an incubation temperature of 37 °C. However, when testing with 0.01M arabinose concentrations, no observable luminescence was detected at any time after induction. Therefore, we decided to characterise the biobrick by measuring the luminescence from the lux operon at different arabinose concentrations and temperatures. We measured the luminescence with a Tecan M200 plate reader, using four different temperatures and six different arabinose concentrations. As the machine could only perform heating and not cooling, it was challenging to measure at temperatures below 29 °C.
Results from our experiments are shown in the graphs below. As no luminescence was detected at 37 °C, these graphs are not included.
By looking at how luciferase luminescence from the lux operon developed with time after induction by arabinose, we established that a temperature of 29 °C was optimal. This can be seen in the graph below:
Additional Characterization by the SHSID_China Team 2018
The SHSID_China Team 2018 has improved upon the work of the Cambridge iGEM team 2010 and NTNU Trondheim iGEM team 2017, by performing additional experiments to determine the optimal conditions of maximum light emission to add further information and build upon the characterization of part BBa_K325909. As this part is provided in the 2018 Distribution Kit, we tested the effectiveness of the arabinose induced lux operon-encoded enzymatic pathway for light emission in part BBa_K325909 by transforming it into E. coli, incubating overnight and subjecting it to different final concentrations of arabinose over a course of five hours. Reflecting upon the previous characterizations, we chose a temperature of 29℃ to perform our experiments, since by looking at the information presented by the NTNU Trondheim iGEM team 2017, it seems as if 29℃ may provide us with the brightest results.
Luminometric and photometric measurements were taken with a Thermo Scientific Varioskan Flask 4.00.53 every hour throughout the experiment, and the data was recorded on the raw data table provided below.

The data is analyzed using the formula: (Average Luminescence/0Hrs Luminescence)/(Average Abs/0Hrs Abs) for each concentration of arabinose, and the graphs are plotted below, with part BBa_K325909 abbreviated as 4L:

From the graph, even though the relative luminescence of the bacteria are similar during the first four hours, there is a significant increase in relative luminescence during the fifth hour at a concentration of 0.1M, therefore we have concluded that inducing part BBa_K325909 with 0.1M arabinose will result in the most intense light emission.
Pictures
References
[http://www.jstor.org/stable/4449975 [1]:] J. Slock, (1995) Transformation Experiments Using Bioluminescence Genes of Vibrio fischeri,The American Biology Teacher, 57, 225-227.
[http://www.annualreviews.org/doi/pdf/10.1146/annurev.mi.42.100188.001055 [2]:] E.A. Meighen (1988) Enzymes and genes from the lux operons of bioluminescent bacteria, Annual Reviews in Microbiology 42, 151-176.
[http://www.annualreviews.org/doi/pdf/10.1146/annurev.ge.28.120194.001001 [3]:] E.A. Meighen, (1994) Genetics of bacterial bioluminescence, Annual Reviews of Genetics, 28, 117-139.


